ORIGINAL ARTICLE
High-risk behaviors and experiences with traffic law
among night drivers in Curitiba, Brazil
Sandra L. Ulinski, Simone T. Moyse´s, Renata I. Werneck, Samuel J. Moyse´s
Pontifı´cia Universidade Cato´lica do Parana´ (PUCPR), Curitiba, PR, Brazil.
Objective:To explore high-risk behaviors and experiences with traffic law among night drivers in Curitiba, Brazil.
Method:Data from 398 drivers on sociodemographic parameters, high-risk behaviors, experiences with traffic law, and traffic law violations were collected through interviews conducted at sobriety checkpoints. Exploratory-descriptive and analytical statistics were used.
Results:The mean age of the participants was 32.6611.2 years (range, 18 to 75 years). Half of the drivers reported having driven after drinking in the last year, predominantly single men aged 18 to 29 years who drive cars and drink alcohol frequently. Only 55% of the drivers who had driven after drinking in the last year self-reported some concern about being detected in a police operation.
Conclusions:A significant association was found between sociodemographic variables and behavior, which can help tailor public interventions to a specific group of drivers: young men who exhibit high-risk behaviors in traffic, such as driving after drinking alcohol, some of whom report heavy alcohol consumption. This group represents a challenge for educational and enforcement interventions, particularly because they admit to violating current laws and have a low perception of punishment due to the low risk of being detected by the police.
Keywords: Risk factors; traffic; alcohol; traffic violations
Introduction
Traffic crashes are the eighth leading contributor to death globally and the first among those aged 15 to 29 years in contemporary societies. More than 1 million people die on public roads around the world each year, and current trends suggest that, unless urgent measures are taken, crashes will become the fifth leading contributor to death by 2030.1 Reports and reviews1,2 reveal that the human factor contributes to 90% of traffic crashes. This factor involves high-risk behaviors with multiple determinants, the causes of which are linked to a complex context of individual, behavioral, environmental, social-cognitive, and social variables. Potentially causal links involved in the source and severity of traffic crashes have been described, such as age, gender, socioeconomic conditions, and high-risk behaviors (especially driving after consuming alcohol, and speeding), and are compounded by a grievous combina-tion of ineffective enforcement and percepcombina-tion of impunity.2 Alcohol consumption is recognized as a direct cause of social and health problems. As the third most significant risk factor for death and disability among productive individuals worldwide, it has great significance to public health. Alcohol intake compromises drivers’ skills and impairs their motor coordination, increasing the risk of involvement in traffic violations and incidents.3-5
The World Health Organization6lists alcohol consump-tion, especially in its ‘‘binge’’ pattern (heavy episodic consumption of alcohol characterized by the consumption of five drinks or more by men and four drinks or more by women on a single occasion), as an important indicator to be considered for acute consequences of alcohol use, such as road traffic injuries. Similarly, abstention from alcohol should also be considered a protective factor. Within the complex of alcohol epidemiology, individuals can be categorized variously with regard to abstention, e.g., lifetime abstainers, former drinkers, and those who have drunk alcohol in the past 12 months.6
The binge pattern has been associated with the most severe alcohol-related damage and is particularly linked to trauma and injuries.3,6In addition to being a key indicator of alcohol abuse, it also indicates the frequency and circum-stances of alcohol consumption and the proportion of people who drink to intoxication in a specific location, region, or country.4 The literature shows that binge drinking is a defining factor of high-risk behavior both for drivers and for other road users3,7 and is linked to reckless driving8 and violation of other traffic laws.9The blood alcohol concentra-tion (BAC) limit for drivers in Brazil has been zero since 2008, and violation (any level of alcohol content) is punish-able by fine, suspension or revocation of license, and driver detention. Punishments for driving while under the influence of alcohol have since become increasingly severe, and traffic authorities have sought to improve detection with a weekly increase in the frequency and sites of police operations.
Studies on the issue of driving after drinking alcohol have been conducted in Brazil, but some factors related to Correspondence: Sandra Lu´cia Vieira Ulinski, Rua Pedro Ame´rico,
505, CEP 81110-010, Curitiba, PR, Brazil. E-mail: [email protected]
Submitted Oct 17 2014, accepted May 14 2015. Associac¸a˜o Brasileira de Psiquiatria
alcohol consumption patterns and the characteristics of drivers who engage in this practice still warrant further investigation.5,9,10For example, a recently published study found that a high prevalence (8.3%) of drivers reported consumption of alcohol before driving in Curitiba, Brazil.10 Thus, it is relevant to characterize the behaviors of these drivers and examine their experiences with traffic law.
The literature reports a high prevalence of traffic accidents involving alcohol use at night and on weekends – during which many people are driving not only for the purpose of work or education, but also for leisure.10-12 This is a compelling justification for research into the characteristics of drivers under these circumstances.
Within this context, it is understood that multi-profes-sional teams and managers in the fields of traffic safety, education, and health, among others, need robust evi-dence to provide information and communication to the public, direct resources, and formulate educational, engi-neering, and traffic control strategies in an effort to deploy effective and sustainable policies based on sound evi-dence. Given these assumptions, this paper sought to investigate high-risk behaviors related to drinking and driving and experiences with traffic law among night drivers in Curitiba, state of Parana´, Brazil.
Methods
This was an observational, cross-sectional, quantitative study. The study considered the number of vehicle license plates issued in the municipality of Curitiba as reported by the Traffic Department of Parana´ (DETRAN-PR) in February 2012 (1,280,864 vehicles). In the probabilistic sample calculation, a 3% error parameter was used with a 95% confidence interval (95%CI) and an expected prevalence of 12.8% for driving under the influence of any amount of alcoholic beverages (distilled or fermented) ingested on the day of the survey among night drivers in the city.11This resulted in a sample size of 315 participants. Accounting for an estimated refusal rate of 20% (proportion of all potentially eligible sample cases that could deny the request to be interviewed, as estimated in an exploratory approach), 511 night drivers were targeted during recruit-ment, of whom 398 (77.9%) agreed to be interviewed.
The field portion of the study took place at sobriety checkpoints (roadblocks) conducted by Curitiba traffic police. The locations of these checkpoints had been previously defined by the traffic police on the basis of traffic intelligence, operational logistics, and safety issues. The selection of urban roads for checkpoint implementa-tion prioritized certain areas of the city, paths taken by leisure drivers at night (as assessed by vehicle traffic flow), and georeferenced roads where more traffic violations occur, as well as those that provided a suitable environment for setting up the checkpoint infrastructure.
Data were collected on Wednesday through Saturday, 8 p.m. to 1 a.m., from March to November 2012. The study took into account only those night drivers aged 18 years or older (the minimum legal age for driving in Brazil) who agreed to participate. Therefore, as this is a probabilistic sample, it is credible to assume that its demographics can
be generalized to the ‘‘population of nighttime drivers’’ in Curitiba. The data collection procedure included:
a) Random interception of drivers on the road, conducted by a police officer: the police officer signaled to selected automobile drivers (or motorcycle riders) to park their vehicles in the checkpoint area. At this time, the police officer performed only the standard inspection procedures regarding documentation and operating conditions of the vehicle, taking legal action if any violation was found. b) Invitation to participate in the study: after inspection and
legal compliance procedures, the officer explained the study to the driver, emphasizing that he or she was free to choose whether to participate. Field researchers always remained away from the area in which the police inspection procedures were conducted.
c) Refusal to participate in the study: drivers who refused to take part in the survey were allowed back onto the public road, if compliance with the law permitted.
d) Acceptance of the invitation: drivers who accepted the invitation to participate were referred to one of the field researchers and, after signing an informed consent form, were interviewed.
Offenders were brought to a mobile traffic police module placed at the sobriety checkpoints, thus allowing interviewers to approach them and collect data on site.
The data collection team was made up of 10 trained individuals who interviewed drivers using a survey instrument consisting of closed-ended questions. Instru-ment variables were selected considering sociodemo-graphic aspects frequency and pattern of alcohol consumption, the driver’s high-risk behaviors, the driver’s experiences with traffic law, and violations.
The alcohol consumption pattern variable was divided into: i) no consumption (those who had not consumed alcohol in the year preceding the survey), ii) moderate consumption (men who drank fewer than five drinks and women who drank fewer than four drinks on a single occasion), and iii) heavy consumption or ‘‘binge’’ drinking (men who drank more than five drinks and women who drank more than four drinks on a single occasion).6
Statistical analyses were performed in SPSS version 17. A descriptive analysis of the data was carried out to determine the frequency distribution and sample profile, followed by univariate and bivariate analyses using contingency tables. Likelihood ratio chi-square tests were used to verify association between the selected variables. A significance level of p o 0.05 was established for all analyses.
The study was approved by the Ethics Committee of Pontifı´cia Universidade Cato´lica do Parana´ (protocol no. 005752/12).
Results
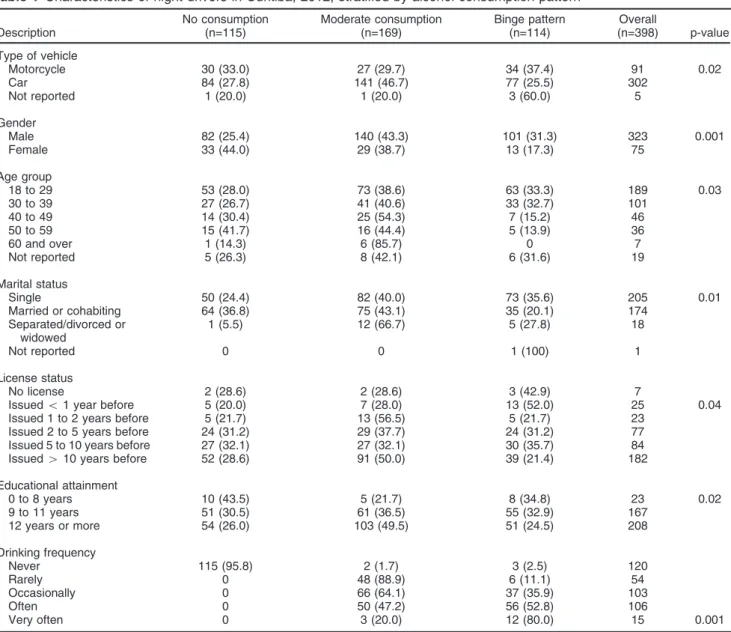
The drivers’ profile, stratified by alcohol consumption pattern, is shown in Table 1. Motorcycle riding (37.4%) and male gender (31.3%) were associated with the binge drinking pattern (p o 0.05). The rate of binge drinking tended to decrease with age (po0.05). The percentage of binge drinkers was lower among married drivers (po 0.05) and higher among drivers whose license had been issued less than 1 year before (po0.05). A significant, positive relationship was identified between the frequency with which participants drank alcohol and their alcohol consumption pattern (po0.05).
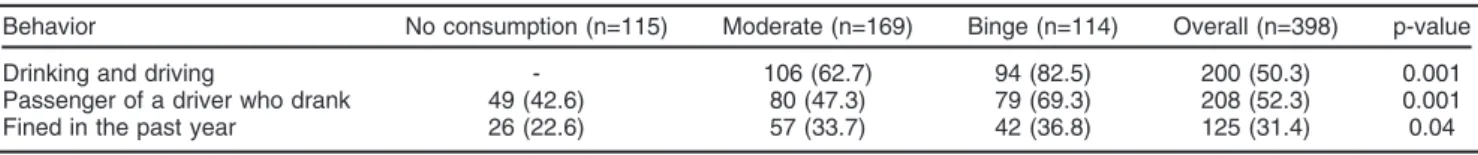
Table 2 lists some high-risk behaviors associated with alcohol consumption pattern. Overall, 50% of drivers reported having driven under the influence of alcohol in the past 12 months. Among binge drinkers, 82.5% confirmed this practice. Furthermore, 52.3% of respon-dents (n=208) reported having been the passenger of a
driver who drank before driving; this percentage increased to 69.3% when considering only the subgroup of respondents with the binge drinking pattern. To explore high-risk behaviors among drivers who drink alcohol, the association between alcohol consumption and having been fined in the preceding year was assessed (Table 2). Overall, 36.8% of binge drinkers had been fined in the preceding year (p o0.05).
Table 3 shows which characteristics were significantly associated with the sample of drivers (n=200) who admitted to drinking and driving in the preceding year. Among these drivers, approximately 50% were aged 18 to 29 years. Significant characteristics observed in these drivers were male gender (n=178) and single marital status (n=121; po0.05), frequent drinking (n=92; po0.05), having been fined in the preceding year (n=81; p o0.05), and having been a passenger of a driver who drank alcohol before
Table 1 Characteristics of night drivers in Curitiba, 2012, stratified by alcohol consumption pattern
Description
No consumption (n=115)
Moderate consumption (n=169)
Binge pattern (n=114)
Overall
(n=398) p-value
Type of vehicle
Motorcycle 30 (33.0) 27 (29.7) 34 (37.4) 91 0.02
Car 84 (27.8) 141 (46.7) 77 (25.5) 302
Not reported 1 (20.0) 1 (20.0) 3 (60.0) 5
Gender
Male 82 (25.4) 140 (43.3) 101 (31.3) 323 0.001
Female 33 (44.0) 29 (38.7) 13 (17.3) 75
Age group
18 to 29 53 (28.0) 73 (38.6) 63 (33.3) 189 0.03
30 to 39 27 (26.7) 41 (40.6) 33 (32.7) 101
40 to 49 14 (30.4) 25 (54.3) 7 (15.2) 46
50 to 59 15 (41.7) 16 (44.4) 5 (13.9) 36
60 and over 1 (14.3) 6 (85.7) 0 7
Not reported 5 (26.3) 8 (42.1) 6 (31.6) 19
Marital status
Single 50 (24.4) 82 (40.0) 73 (35.6) 205 0.01
Married or cohabiting 64 (36.8) 75 (43.1) 35 (20.1) 174
Separated/divorced or widowed
1 (5.5) 12 (66.7) 5 (27.8) 18
Not reported 0 0 1 (100) 1
License status
No license 2 (28.6) 2 (28.6) 3 (42.9) 7
Issuedo1 year before 5 (20.0) 7 (28.0) 13 (52.0) 25 0.04
Issued 1 to 2 years before 5 (21.7) 13 (56.5) 5 (21.7) 23
Issued 2 to 5 years before 24 (31.2) 29 (37.7) 24 (31.2) 77
Issued 5 to 10 years before 27 (32.1) 27 (32.1) 30 (35.7) 84
Issued410 years before 52 (28.6) 91 (50.0) 39 (21.4) 182
Educational attainment
0 to 8 years 10 (43.5) 5 (21.7) 8 (34.8) 23 0.02
9 to 11 years 51 (30.5) 61 (36.5) 55 (32.9) 167
12 years or more 54 (26.0) 103 (49.5) 51 (24.5) 208
Drinking frequency
Never 115 (95.8) 2 (1.7) 3 (2.5) 120
Rarely 0 48 (88.9) 6 (11.1) 54
Occasionally 0 66 (64.1) 37 (35.9) 103
Often 0 50 (47.2) 56 (52.8) 106
Very often 0 3 (20.0) 12 (80.0) 15 0.001
driving (n=122; po0.05). Regarding traffic enforcement/ legislation, only 55% of respondents were concerned about being intercepted at a police roadblock (n=110; po0.05). Most respondents who drank alcohol before driving reported knowing the penalties for drinking and driving (79.4%). However, 63.3% of these drivers had never been pulled over at a roadblock and 84.5% had never undergone a Breathalyzer test.
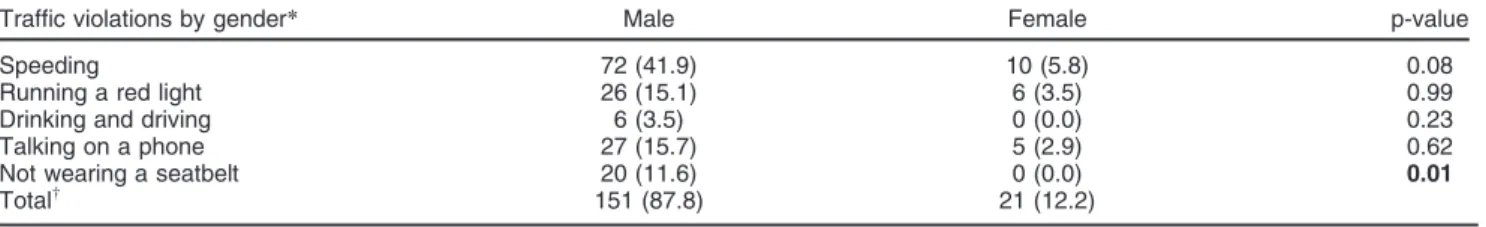
A total of 125 drivers fined in the past year (31.4%), predominantly males (p o 0.05), self-reported having committed a total of 172 violations (Table 4). These drivers also committed the highest number of violations for items such as failing to wear a seatbelt (p o0.05). Speeding was the most frequent violation, followed by talking on a phone while driving and running a red light. There was a low frequency of fines due to drinking and driving violations, despite the high percentage of drivers who reported having driven under the influence of alcohol during the preceding year.
Discussion
This study found significant associations of gender, age, and binge drinking pattern with high-risk traffic behaviors such as drinking and driving, being the passenger of a drunk driver, and committing traffic violations with a perception of impunity. Approximately half of the drivers who participated reported having driven after drinking in the preceding year. These drivers were predominantly male, single, aged 18 to 29 years, and frequently drove after drinking.
The prevalence found was greater than that identified in the Vigitel Brasil 2012 national survey,12which corres-ponded to 8.6% of the overall sample (95%CI 6.9-10.3) and 14.8% of men (95%CI 11.6-17.9). VIGITEL is a stan-dardized phone survey conducted in all Brazilian state
capitals by the Ministry of Health; therefore, comparisons should be made with caution due to methodological differences between the two studies. Pechansky et al.13 and Castro et al.14found that approximately one-third of drivers reported drinking alcohol before driving in the last year. De Boni et al.15identified that 56.3% of individuals who drank intended to drive in the next hour, a percentage similar to that found in this study.
Studies confirm that, with respect to sociodemographic characteristics, men are more likely to violate traffic laws,16 drive at a high rate of speed,17drive under the influence of alcohol,18,19 and repeat such behaviors,20 ultimately be-coming involved in crashes. Similarly, young people have a higher prevalence of driving after drinking alcohol and being a passenger of a driver who drank alcohol.8In Brazil, a study identified the risk profile for drinking and driving in 2,166 youths.9The characteristics associated with drinking and driving were high alcohol intake, being a frequent passenger of a driver who drank and drove, having friends who drink and drive, and considering high alcohol intake to be safe for driving. Other studies indicate that high-risk behavior among young drivers is the main factor contribut-ing to high rates of crashes and injuries.2,17,21 Young drivers are more likely to underestimate risks, overestimate their abilities, disobey traffic laws, and believe that vio-lations are socially acceptable.22
In line with other investigations, approximately one-third of respondents in the present study reported a binge drinking pattern in the last year,23,24reinforcing previous findings about the predominance of young,7 male7,25 drivers who had been issued a license for less than a year. Laranjeiras et al.23 recorded a 10% increase in binge drinking accompanied by an increase in drinking frequency to once a week (11%) from 2006 to 2012.24
Another relevant finding was the association between frequency and pattern of alcohol consumption, which
Table 2 High-risk behaviors of night drivers in Curitiba, 2012, stratified by alcohol consumption pattern
Behavior No consumption (n=115) Moderate (n=169) Binge (n=114) Overall (n=398) p-value
Drinking and driving - 106 (62.7) 94 (82.5) 200 (50.3) 0.001
Passenger of a driver who drank 49 (42.6) 80 (47.3) 79 (69.3) 208 (52.3) 0.001
Fined in the past year 26 (22.6) 57 (33.7) 42 (36.8) 125 (31.4) 0.04
Data expressed as n (%).
Table 3 Characteristics of drivers who reported having driven under the influence of alcohol in the preceding year, Curitiba, 2012 (n=200)
Description n (%) p-value
Male gender 178 (89.0) o0.001
Age 18 to 29 years 99 (49.5) 0.29
Single marital status 121 (60.5) 0.01
Education, 12 years or more 105 (52.5) 0.39
Drinking frequency, often 92 (46.0) o0.001
Was fined in the preceding year* 81 (64.8) o0.001
Was the passenger of a driver who drank and drove 122 (61.0) o0.001
Knows the penalties for drinking and driving 158 (79.4) 0.78
Intercepted at a roadblock in the past year 74 (36.7) 0.11
Subjected to a Breathalyzer test 31 (15.5) 0.49
Worries about being pulled over at a roadblock 110 (55.0) o0.001
indicates that individuals who meet criteria for binge-pattern drinking not only drink larger amounts of alcohol, but also drink more often. This finding is in line with the first national survey on alcohol consumption patterns of the Brazilian population,23conducted in 2007; the higher the binge drinking frequency, the greater the risk of being involved in a traffic incident.
Furthermore, the present study identified a trend of reduced binge drinking with age, which is consistent with the existing literature, although the relationship is not one-to-one, given that some age groups share similar prevalence rates of binge drinking.7,12,23,25,26This finding was also identified in a study by Melcop et al.,27in which traffic accident victims who had drunk alcohol before driving comprised 43% of such victims aged 20 to 29 years vs. only 2% of those aged 60 years and over. VIGITEL12 showed the same trend for the total adult population in the Brazilian state capitals.
Confirming the findings of the existing literature,10,27 men committed more violations, especially speeding2and talking on the phone.2 Studies suggest that women perceive a greater amount of risk involved in committing a violation, while men feel more capable of driving and are more defiant regarding traffic laws, and thus obey such laws selectively in a situation-dependent manner.16
Most drivers who had been fined for any violation reported having drunk alcohol and driven in the last year. On the other hand, there was a low frequency of fines reported for drinking and driving, despite the high percentage of drivers who claimed to drink and drive. This is probably due to the fact that the number of inspections/sobriety checkpoints taking place in the city was low, considering the extent of its roads and the size of its vehicle fleet.
In this sample, drivers who binge-drank committed most of the violations. Studies show a high prevalence of drinking and driving among Brazilian drivers due to cultural differences regarding the use of alcohol and a low perception of punishment.9,10Schimitz et al.20warn that the lack of effective enforcement of traffic legislation results in a feeling of impunity and contributes to the maintenance of high-risk behavior.
The practical implications of these findings are relevant for guiding educational measures and improving super-vision and law enforcement. These findings may help tackle a worrying and challenging scenario: a study conducted in Curitiba in 2009 revealed that 22% of all victims of traffic collisions (drivers, passengers, and
pedestrians) had drunk alcohol before the crash, and that 4.2% had a previous history of a traffic collision while under the influence of alcohol.27
Alcohol consumption is a risk factor for driving because it induces psychomotor changes and creates an illusion of better performance. It decreases critical capacity, thus impairing logical connections, coordination, and attention to traffic events. This renders intoxicated drivers unable to predict situations (defensive driving), as their ability to make choices and decisions and to react is compro-mised.28 Furthermore, the binge drinking pattern is associated with many types of social and behavioral problems and with a high incidence of diseases.4 The literature29 emphasizes the importance of including this variable when drawing up prevention programs.
In this study, drivers were aware of the penalties for drinking and driving and demonstrated a different context than that found by Pinsky et al.,29in which only a small percentage of drivers knew the laws about drinking and driving. Despite such awareness, only one-third of the interviewed drivers were concerned about being pulled over at a roadblock. Vanlaar & Yannis30stress that there will always be a group of people whose awareness of a risk is not enough to impact their behavior, leading to the assertion that awareness is a necessary but insufficient condition for safe traffic behavior.
In this sense, the relevance of control beyond informative actions must be emphasized, since the lack of effectiveness compromises the credibility of the enforcement of traffic laws.8,29,31The majority of respon-dents had never been intercepted at a roadblock and had never even been subjected to a Breathalyzer test. In addition, only half of those who had driven after drinking in the preceding year were worried about being intercepted by a police operation. Studies show that the risk of being punished reduces the likelihood of being involved in crashes and impacts behavioral changes in drivers who engage in risky behaviors.5,32
De Boni et al.15 reported a low frequency of lifetime Breathalyzer testing (8.1% of drivers), highlighting the need for effective law enforcement through random sobriety checkpoints, a measure that effectively reduces the prevalence of drinking and driving. The effectiveness of traffic laws is subject to efficient inspection strategies, in which drivers are highly at risk of being caught and punished.33 Therefore, it depends on the immediate perception of punishment for drivers, as evinced by the international literature.34,35
Table 4 Types of traffic violation committed stratified by gender, Curitiba, 2012
Traffic violations by gender* Male Female p-value
Speeding 72 (41.9) 10 (5.8) 0.08
Running a red light 26 (15.1) 6 (3.5) 0.99
Drinking and driving 6 (3.5) 0 (0.0) 0.23
Talking on a phone 27 (15.7) 5 (2.9) 0.62
Not wearing a seatbelt 20 (11.6) 0 (0.0) 0.01
Totalw 151 (87.8) 21 (12.2)
Data expressed as n (%). Significant result in bold.
*Total sample by gender: n=398 (323 men, 75 women).
wOf the 398 drivers committing violations, 125 were fined (self-reported), namely 110 males and 15 females (p = 0.02). Some drivers were
Another important issue is punishment avoidance. Scott-Parker et al.36 reported that some young drivers reported they became ‘‘smarter’’ by momentarily reducing their hazardous behavior when in the vicinity of the police, or by changing driving routes to evade detection. Facebook pages which alert drivers to the location of speed enforce-ment and roadside blocks are controversial: while increased awareness is expected to result in less drunk driving, individuals who drink and drive may avoid these locations in an attempt to to avoid detection and come to rely on this practice as a means of breaking the rules of the road with impunity. Hence, the phenomenon of punishment avoidance must be better understood so as to improve implementation of traffic laws and enhance the safety of all road users.
The main limitation of this study concerns the char-acteristics of the sample, which consisted mainly of drivers who work or study at night and those who were out for leisure/entertainment during the hours alcohol intake is greatest. For this reason, generalization of our findings is not possible. However, the profile of such drivers (i.e., those who drive during periods in which more traffic incidents occur) must be characterized so that prevention strategies can be more effective. Another potential limitation involves underreporting of risky beha-viors due to lower percentages of socially unacceptable self-reported behaviors.
Finally, it is relevant to note that driving behavior is a complex phenomenon with multiple determinants.37This implies that no single method is enough to grasp all its intricate relationships, focusing on the practical applica-tion of findings obtained from this type of study. Future research will always be necessary, seeking to use multiple approaches to look further into the different vectors that guide human behavior in traffic and the most effective measures for safe mobility.38
This study reported on the association between alcohol consumption and high-risk behaviors of night drivers on weekends, when the highest number of traffic incidents occurs. A significant share of these drivers are young men who binge-drink frequently, drink before driving, take risks by riding with drunk drivers, are more likely to commit violations, and are not concerned about detection of or punishment for their actions. In this sense, there is a need for traffic education policies, measures for the social control of alcohol use, harmful or otherwise, and strategies to eliminate the sense of impunity among drivers.
Disclosure
The authors report no conflicts of interest.
References
1 World Health Organization (WHO). Global status report on road safety 2013: supporting a decade of action. Geneva: WHO; 2013. 2 de Andrade SM, Soares DA, Braga GP, Moreira JH, Botelho FM.
[Risky behavior for traffic accidents: a survey among medical stu-dents in Southern Brazil]. Rev Assoc Med Bras. 2003;49:439-44. 3 Segatto ML, Silva RS, Laranjeira R, Pinsky I. O impacto do uso de
a´lcool em pacientes admitidos em um pronto-socorro geral uni-versita´rio. Rev Psiquiatr Clin. 2008;35:138-43.
4 World Health Organization (WHO). Global status report on alcohol and healthGeneva: WHO; 2011.
5 Wray TB, Simons JS, Dvorak RD. Alcohol-related infractions among college students: associations with subsequent drinking as a function of sensitivity to punishment. Psychol Addict Behav. 2011;25:352-7. 6 World Health Organization (WHO). Global status report on alcohol
and health. Geneva: WHO; 2014.
7 Naimi TS, Brewer RD, Mokdad A, Denny C, Serdula MK, Marks JS. Binge drinking among US adults. JAMA. 2003;289:70-5.
8 Pinsky I, Labouvie E, Laranjeira R. Disposic¸a˜o e alternativas ao dirigir
alcoolizado entre jovens paulistanos. Rev Bras Psiquiatr. 2004; 26:234-41.
9 Pechansky F, Duarte Pdo C, De Boni R, Leukefeld CG, von Diemen L, Bumaguin DB, et al. Predictors of positive Blood Alcohol Concentration (BAC) in a sample of Brazilian drivers. Rev Bras Psiquiatria. 2012;34:277-85.
10 Aguilera SL, Sripad P, Lunnen JC, Moyse´s ST, Chandran A, Moyse´s SJ. Alcohol consumption among drivers in Curitiba, Brazil. Traffic Inj Prev. 2015;16:219-24.
11 Pechansky F, De Boni R, Duarte Pdo C, De Paula FC, Benzano D, Diemen LV, et al. Consumo de a´lcool e drogas entre motoristas privados e profissionais do Brasil. In: Pechansky F, De Boni R, Duarte Pdo CeditoresUso de bebidas alco´olicas e outras drogas nas rodovias brasileiras e outros estudos Porto AlegreSecretaria Nacio-nal de Polı´ticas sobre Drogas; 2010.p. 121.
12 Brasil, Ministe´rio da Sau´de. Vigitel Brasil 2012: vigilaˆncia de fatores de risco e protec¸a˜o para doenc¸as croˆnicas por inque´rito telefoˆnico.
Brası´lia: Ministe´rio da Sau´de; 2013.
13 Pechansky F, De Boni R, Diemen LV, Bumaguin D, Pinsky I, Zaleski M, et al. Highly reported prevalence of drinking and driving in Brazil: data from the first representative household study. Rev Bras Psiquiatr. 2009;31:125-30.
14 Castroand DS, Sanchez ZM, Zaleski M, Alves HN, Pinsky I, Caetano R, et al. Sociodemographic characteristics associated with binge drinking among Brazilians. Drug Alcohol Depend. 2012;126:272-6. 15 De Boni R, Pechansky F, Silva PL, de Vasconcellos MT, Bastos FI. Is the prevalence of driving after drinking higher in entertainment areas?. Alcohol Alcohol. 2013;48:356-62.
16 Yagil D. Gender and age-related differences in attitudes toward traffic laws and traffic violations. Transp Res Part F Traffic Psychol Behav. 1998;1:123-35.
17 Machin MA, Sankey KS. Relationships between young drivers’ per-sonality characteristics, risk perceptions, and driving behaviour. Accid Anal Prev. 2008;40:541-7.
18 Campos VR, Salgado R, Rocha MC, Duailibi S, Laranjeira R. Beber e dirigir: caracterı´sticas de condutores com bafoˆmetro positivo. Rev Psiquiatr Clin. 2012;39:166-71.
19 Campos VR, de Souza e Silva R, Duailibi S, dos Santos JF, Laranjeira R, Pinsky I. The effect of the new traffic law on drinking and driving in Sa˜o Paulo, Brazil. Accid Anal Prev. 2013;50:622-7. 20 Schmitz AR, Goldim JR, Guimaraes LS, Lopes FM, Kessler F,
Sousa T, et al. Factors associated with recurrence of alcohol-related traffic violations in southern Brazil. Rev Bras Psiquiatr. 2014;36:199-205. 21 Castella J, Perez J. Sensitivity to punishment and sensitivity to
reward and traffic violations. Accid Anal Prev. 2004;36:947-52. 22 Forward SE. Intention to speed in a rural area: reasoned but not
rea-sonable. Transp Res Part F Traffic Psychol Behav. 2010;13:223-32. 23 Laranjeira R, Pinsky I, Zaleski M, Caetano R, Duarte P. I levantamento
nacional sobre os padro˜es de consumo de a´lcool na populac¸a˜o
bra-sileira [Internet] Brası´lia: Secretaria Nacional Antidrogas; 2007, [cited 2014 Jun 18]. http://bvsms.saude.gov.br/bvs/publicacoes/relatorio_ padroes_consumo_alcool.pdf.
24 Laranjeira R. II Levantamento Nacional de A´ lcool e Drogas (LENAD II) - consumo de a´lcool no Brasil: tendeˆncias entre 2006/2012 [Internet]. Sa˜o Paulo: Instituto Nacional de Cieˆncia e Tecnologia para Polı´ticas Pu´blicas de A´ lcool e Outras Drogas (INPAD), UNIFESP; 2014 [cited 2013 Mar]. http://inpad.org.br/wp-content/uploads/2014/ 03/Lenad-II-Relat%C3%B3rio.pdf.
25 Kypri K, Bell ML, Hay GC, Baxter J. Alcohol outlet density and uni-versity student drinking: a national study. Addiction. 2008;103:1131-8. 26 Moura EC, Malta DC, Morais Neto OL, Penna GO, Tempora˜o JG. Direc¸a˜o de veı´culos motorizados apo´s consumo abusivo de bebidas
alcoo´licas, Brasil, 2006 a 2009. Rev Saude Publica. 2009;43:891-4. 27 Melcop AGT, Chagas DMM, Falbo GH. O consumo de a´lcool e os acidentes de traˆnsito: pesquisa sobre a asssociac¸a˜o entre o consumo
[Internet]. Recife: CCS Gra´fica e Editora; 2011 [cited 2013, May 18]. http://www.ibradecbrasil.com.br/wp-content/uploads/2012/08/O-Con-sumo-de-%C3%81lcool-e-Os-Acidentes-de-Tr%C3%A2nsito.pdf. 28 Hoffmann MH, Carbonell E, Montoro L. A´ lcool e seguranc¸a -
epide-miologia e efeitos. Psicol Cienc Prof. 1996;16:28-37.
29 Pinsky I, Labouvie E, Pandina R, Laranjeira R. Drinking and driving: pre-driving attitudes and perceptions among Brazilian youth. Drug Alcohol Depend. 2001;62:231-7.
30 Vanlaar W, Yannis G. Perception of road accident causes. Accid Anal Prev. 2006;38:155-61.
31 Campos VR, Salgado Rde S, Rocha MC. [Positive breathalyzer test: factors associated with drinking and driving in the city of Belo Horizonte, Minas Gerais State, Brazil]. Cad Saude Publica. 2013;29:51-61. 32 Cuffa M. Percepc¸a˜o e comportamento de risco de beber e dirigir: um
perfil do universita´rio de Curitiba [dissertation]. Curitiba: UFPR; 2012 [cited 2014, May 25]. http://www.humanas.ufpr.br/portal/psicologia-mestrado/files/2012/05/Marina-de-Cuffa-trabalho-de-disserta%C3% A7%C3%A3o.pdf.
33 Stanojevic´ P, Jovanovic´ D, Lajunen T. Influence of traffic enforce-ment on the attitudes and behavior of drivers. Accid Anal Prev 2013;52:29-38.
34 Farchi S, Chini F, Giorgi Rossi P, Camilloni L, Borgia P, Guasticchi G. Evaluation of the health effects of the new driving penalty point system in the Lazio Region, Italy, 2001-4. Inj Prev. 2007;13:60-4.
35 Novoa AM, Perez K, Santamarina-Rubio E, Mari-Dell’Olmo M, Ferrando J, Peiro R, et al. Impact of the penalty points system on road traffic injuries in Spain: a time-series study. Am J Public Health. 2010;100:2220-7.
36 Scott-Parker B, Watson B, King MJ, Hyde MK. Mileage, car owner-ship, experience of punishment avoidance, and the risky driving of young drivers. Traffic Inj Prev. 2011;12:559-67.
37 Moyse´s SJ. Determinac¸a˜o sociocultural dos Acidentes de Transporte
Terrestre (ATT). Cienc Saude Coletiva. 2012;17:2241-3.
38 Panichi RMD, Wagner A. Comportamento de risco no traˆnsito: revisando a literatura sobre as varia´veis preditoras da conduc¸a˜o perigosa na