Licence Creative Commom
CC
RBCDH
1 Universidade Federal de Santa Catarina. Centro de Desportos. Laboratório de Esforço Físico. Florianópolis, SC. Brasil.
2 Universidade Estadual Paulista. Laboratório de Avaliação da Performance Humana. Instituto de Biociências. Rio Claro, SP. Brasil.
Received: 10 September 2013 Accepted: 13 January 2014
Performance prediction of endurance
runners through laboratory and track tests
Predição da performance de corredores de endurance
por meio de testes de laboratório e pista
Kristopher Mendes de Souza1
Ricardo Dantas de Lucas1
Talita Grossl1
Vitor Pereira Costa1
Luiz Guilherme Antonacci Guglielmo1
Benedito Sérgio Denadai2
Abstract – he objectives of this study were: 1) determine and compare physiological
indexes from laboratory and track tests (Université de Montréal Track Test - UMTT) in endurance runners; 2) analyze the predictive capacity of VO2max, vVO2max and AT with the running performance at 1,500 m, 5,000 m and 10,000 m time trials; 3) analyze the efects of running distance on the relationship between the physiological indexes with aerobic performance. he study included 10 moderately trained endurance runners who performed the following series of tests on diferent days: 10,000 m, 5,000 m, and 1,500 m time trials on a 400 m track; two maximal incremental tests (laboratory and track) to determine the VO2max, vVO2max, and AT. here were no signiicant diferences between VO2max, vVO2max and AT determined in both protocols. he multiple regression analy-sis revealed that vVO2max was the only index from laboratory associated with running performance at 1,500 and 5,000 m (62 and 35%, respectively). In addition, vVO2max from UMTT explained the running performance for the same previous distance (78 and 66%, respectively). On the other hand, the AT determined in both incremental tests explained 38 and 52% of performance at 10,000 m time trial, respectively. hus, the prediction of endurance performance of long distance runners using VO2max, vVO2max and AT de-termined in the laboratory and UMTT tests depends on the running distance.
Key words:Aerobic metabolism; Endurance running; Physiological indexes.
Performance prediction of endurance runners Souza et al.
INTRODUCTION
Maximum oxygen uptake (VO2max) has an important relationship with endurance running performance1-4. However, trained runners may have
similar VO2max values and thus other physiological indexes such as ve-locity associated with VO2max (vVO2max) and anaerobic threshold (AT) can contribute for the success of predominantly aerobic events5-8. For
example, vVO2max has shown a close relationship with performance in short, intermediate and long distance races2-8. In turn, AT has been
con-sidered an essential parameter in assessing aerobic capacity9 and training
prescription10 and also an important factor in predicting performance in
endurance races1,6,8,11.
However, these indexes are usually determined in laboratory protocols, since there is better control of the environment and greater precision in measurements performed. hus, one of the disadvantages of laboratory tests is the diiculty in reproducing a situation closer to reality daily experienced by athletes. In this context, the track test at the University of Montreal (UM), proposed by Léger and Boucher12 is a more speciic protocol, since
it allows identifying VO2max and vVO2max13,14. Furthermore, although
there are no studies that provide information, it could be hypothesized that, by identifying the heart rate delection point (HRDP), as proposed by Conconi et al.15 and Conconi et al.16, it is possible to estimate AT in UM.
Diferent studies have analyzed the prediction of aerobic performance of endurance runners using indexes previously mentioned1-8. These,
however, used single or multiple regression models analyzing the same group of athletes, the relationship between physiological indexes and performance in a single distance, which frequently varies from 1,500 m to 10,000 m1-8. Based on these studies, it has been proposed that the
running distance and therefore the exercise intensity may inluence the relationship between physiological indexes and the aerobic performance of runners6. Furthermore, to our knowledge, no study has investigated
the endurance performance obtained for the same runners at diferent distances with two or more indexes determined in laboratory and track tests, particularly using UM.
As the percentage of aerobic contribution and intensity relative to vVO2max and AT are proportionally diferent between 1,500 m, 5,000 m and 10,000 m distances6,17, some hypotheses have been formulated: the
submaxi-this research. hus, the aims of submaxi-this study were: a) determine and com-pare physiological indexes from laboratory and track tests (Université de Montréal Track Test - UM) in endurance runners; b) analyze the predictive capacity of VO2max, vVO2max and AT with the running performance at 1,500 m, 5,000 m and 10,000 m time trials; c) analyze the efects of running distance on the relationship between the physiological indexes VO2max, vVO2max and AT with aerobic performance at distances of 1.500 m, 5.000 m and 10.000 m.
METHODS
Subjects
he study included 10 moderately trained runners with at least two years of experience with training and endurance events (28.3 ± 6.8 years and 68.5 ± 8.5 kg, 173.5 ± 7.5 cm and 10.6 ± 3.1% body fat). he study was approved by the Ethics Committee on Human Research of the Federal University of Santa Catarina. Participants were informed and familiarized with all experimental procedures, as well as about risks and beneits, signing the informed consent form.
Experimental procedure
Initially, in an oicial 400-m track, athletes performed three simulated tests in the following distances: 10,000 m, 5,000 m and 1,500 m. Subse-quently, each athlete performed an incremental laboratory test to determine VO2max, vVO2max and AT. Finally, to determine VO2max, vVO2max and AT in track, protocol proposed by Léger and Boucher 12 (UM) was used.
All tests (laboratory and track) occurred in similar climatic conditions (temperature = 23-25ºC; relative humidity = 60-68%), with at least 48 h interval between tests. Athletes were instructed to participate in the study under conditions of total recovery, hydration and nourishment. he experiment was completed in two weeks, with all tests occurring in the same period of the day.
Determination of performance on 10.000 m, 5.000 m and 1.500 m tests
Runners performed simulated tests in a 400-m track on diferent days at distances of 10,000 m, 5,000 m and 1,500 m. Before each test, athletes were allowed to perform a moderate-intensity warm-up exercise followed by stretching (15 min total).
Determination of VO
2max, vVO2max and AT at laboratory
VO2max was determined using an incremental protocol on a treadmill (IMBRAMED SUPER ATL, Porto Alegre, Brazil). he initial velocity was 12 km h-1 (1% slope) with increments of 1 km h-1 every 3 min until
Performance prediction of endurance runners Souza et al.
µl of blood from the earlobe for the estimation of blood lactate using an electrochemical analyzer (YSI 2700 STAT, Yellow Springs, OH, USA). VO2 was measured breath by breath throughout the protocol from the expired gas (K4b2, Cosmed, Rome, Italy), and data were reduced to an average of
15 s. VO2max was considered as the highest value obtained during the test in these intervals of 15 s. To consider that the subjects reached VO2max during the test, the following criteria were adopted18: 1) respiratory
quo-tient > 1.1; 2) blood lactate concentration ≥ 8 mmol L-1; and 3) heart rate
≥ 90% of maximum heart rate (HRmax) predicted for age. vVO2max was considered as the lowest running velocity in which VO2max occurred10.
AT was determined as the velocity corresponding to the ixed lactate con-centration of 3.5 mmol L-1, as proposed by Heck et al.9.
Determination of VO
2max, vVO2max and AT in UM
VO2max was determined using the incremental test of Léger and Boucher12
in an oicial athletics track. he initial velocity was 8 km h-1, with
incre-ments of 1 km h-1 every 2 min until voluntary exhaustion. he velocity of
each stage was controlled by sound signals from a computer and speaker system. Furthermore, the track has been marked with cones every 40 m, and at each sound signal, athletes should be passing near the cones simul-taneously. he test was inished when the athlete could no longer maintain the speed required, being considered maximal when the inal heart rate was equal to or above 90% of HRmax predicted for age. VO2max was esti-mated by equation (mL.kg-1.min-1) = 0,0324x² + 2,134x + 14.49; where “x”
represents vVO2max (km h-1)12. vVO2max was determined as the velocity
corresponding to the last stage completed by the athlete. However, if the athlete failed to complete the last stage, vVO2max was determined ac-cording to the following equation: vVO2max (km h-1) = speed of the last
complete stage (km h-1) + [t (s) / stage duration (s) x incremental velocity
(km h-1); where “t” was the time of incomplete stage19. AT was the velocity
corresponding to the HRDP15, which was identiied using the mathematical
method Dmax, as described by Kara et al.20.
Statistical Analysis
Data are expressed as mean ± SD and normality was veriied by the Shapiro-Wilk test. To compare the physiological parameters determined in laboratory and track tests, Student’s t test was used for paired samples. Multiple regression analysis investigated the relationship between the run-ning time in the diferent distances and the physiological indexes in both protocols. To compare the average velocity in the tests with vVO2max and AT, One-way ANOVA complemented by LSD post hoc test was used. In all analyses, signiicance level of 5% was adopted.
RESULTS
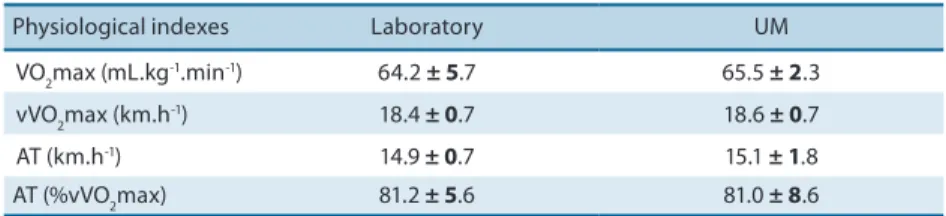
Table 1. Physiological indexes obtained in the incremental test performed at laboratory and UM.
Physiological indexes Laboratory UM
VO2max (mL.kg-1.min-1) 64.2 ± 5.7 65.5 ± 2.3
vVO2max (km.h-1) 18.4 ± 0.7 18.6 ± 0.7
AT (km.h-1) 14.9 ± 0.7 15.1 ± 1.8
AT (%vVO2max) 81.2 ± 5.6 81.0 ± 8.6
Note: VO2max = maximum oxygen uptake; vVO2max = velocity corresponding to maximal oxygen uptake; AT =
anaerobic threshold; UM = incremental test track at the University of Montreal12.
Performance times on 1,500 m, 5,000 m and 10,000 m tests were 4.8 ± 0.2 min, 18.2 ± 0.8 min and 38.6 ± 0.2 min, respectively. he relative values (% vVO2max and %AT) of velocities adopted in each distance are shown in Table 2. he average velocity in the 1,500 m test (v1,500) showed no sig-niicant diference in relation to vVO2max determined in both protocols. However, the average velocity that runners maintained over the 5.000 m (v5.000) was signiicantly higher (p <0.001) than AT and signiicantly lower (p <0.001) than vVO2max in both protocols. In the distance of 10,000 m, the average velocity maintained during the test (v10.000) was signiicantly diferent (p <0.01) from AT determined in laboratory. However, when this physiological index was determined in UM, there was no diference from v10.000.
Table 2. Relative velocity values shown at distances of 1,500 m, 5,000 m and 10,000 m
Distance (m)
Velocity (km.h-1)
%vVO2max (laboratory)
%vVO2max (UM)
%AT (laboratory)
%AT (UM)
1.500 18.8 ± 0.8 102.3 ± 2.7 101.2 ± 1.9 126.3 ± 9.0 124.1 ± 8.7
5.000 16.5 ± 0.7 89.8 ± 3.3 88.7 ± 2.0 110.7 ± 6.6 108.8 ± 6.7
10.000 15.6 ± 0.6 84.9 ± 3.9 83.9 ± 2.5 104.6 ± 4.2 102.8 ± 5.2
Note: vVO2max = velocity corresponding to maximal oxygen uptake; AT = anaerobic threshold; UM =
incremental test track at the University of Montreal12.
Tables 3 and 4, respectively, show the physiological indexes determined at laboratory and UM with capacity to predict performance in diferent distances analyzed. For all cases, the indexes obtained in Léger and Boucher
12 test explained performance better than indexes obtained at laboratory.
Performance prediction of endurance runners Souza et al.
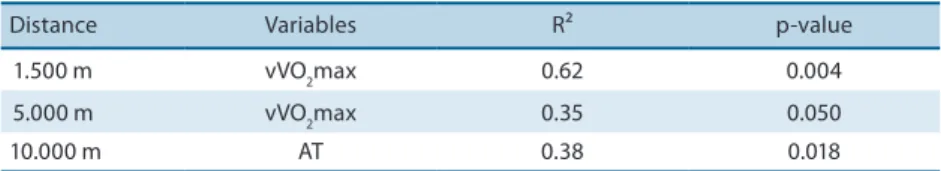
Table 3. Multiple correlation coeicients of physiological indexes determined in laboratory with performance at distances of 1,500 m, 10,000 m 5,000 m.
Distance Variables R² p-value
1.500 m vVO2max 0.62 0.004
5.000 m vVO2max 0.35 0.050
10.000 m AT 0.38 0.018
Note: vVO2max = velocity corresponding to maximal oxygen uptake; AT = anaerobic threshold.
Table 4. Multiple correlation coeicients of physiological indexes determined in UM with performance at distances of 1,500 m, 10,000 m 5,000 m.
Distance Variables R² p-value
1.500 m vVO2max 0.78 0.001
5.000 m vVO2max 0.66 0.002
10.000 m AT 0.52 0.001
Note: vVO2max = velocity corresponding to maximal oxygen uptake; AT = anaerobic threshold.
DISCUSSION
Conirming the hypothesis of the present study, the results found were: the physiological indexes determined in laboratory showed no signiicant dif-ferences from those determined in UM (Table 1); performance prediction from VO2max, vVO2max and AT determined in both protocols (laboratory and UM) was dependent on the running distance; physiological indexes obtained in laboratory test that were able to predict performance in the 1,500 m, 5,000 m and 10,000 m tests were similar to indexes obtained in UM; indexes derived from UM had higher ability to predict perfor-mance than indexes derived from laboratory tests in the three distances analyzed. However, although the test duration afected the relationship between VO2max, vVO2max and AT and the performance of athletes at these distances, it is noteworthy that the aerobic system is prevalent in all tests17,21.
In relation to VO2max, no signiicant diference was found for this index when compared between track and laboratory protocols (Table 1). his is in agreement with other studies that also found no diferences between VO2max determined in laboratory and UM in heterogeneous individuals in terms of training level, age and sex12,13,22,23. However,
although VO2max is considered a physiological determinant of aerobic performance in endurance runners, when homogeneous groups of run-ners are analyzed, this index has shown little discriminatory power of performance in predominantly aerobic events6. his was also observed
in this study, since there was no correlation of VO2max with the tests analyzed. One explanation for this behavior may be due to the low vari-ation coeicient of VO2max (8.4 and 3.5%, respectively to laboratory and track tests).
runners with similar VO2max are analyzed, it is believed that the group homogeneity can provide more precise information on the capacity of predicting performance by other physiological indexes (e.g. vVO2max and AT).
Similarly to VO2max, no signiicant diference was found for vVO2max when it was compared between protocols (Table 1). his corroborates studies by Berthoin et al.13,23, who also found no diferences between
vVO2max determined in laboratory and in UM in moderately trained individuals. In contrast, Lacour et al.18 found in a group of well-trained
runners that vVO2max determined in UM (21.9 ± 1.5 km h-1) was slightly
higher (p<0.05) than vVO2max determined in laboratory (21 6 ± 1.6 km h-1). However, it is important to note that in this study18, the sample
con-sisted of endurance runners of both sexes, which, somehow, might have inluenced the results.
In relation to the ability to predict performance, vVO2max determined in both protocols was the only to explain performance on 1,500 m and 5,000 m tests (Tables 3 and 4). At these distances, vVO2max determined in labo-ratory explained 62% and 35% of the performance variability, respectively. However, in a greater proportion, vVO2max explained the performance variation in 78% for 1,500 m and 66% for 5,000 m.
In relation to the 1,500 m test, this study corroborates other stud-ies that examined the relationship between vVO2max determined in laboratory and UM and the performance of endurance runners at this distance6,11,18,24,26. Lacour et al.11,18 found a signiicant correlation between
vVO2max obtained on treadmill and the performance of runners in the 1,500 m test (r = -0.62 and r = -0.90, respectively). Similarly, also when determined in laboratory, vVO2max explained 67% and 64% of the perfor-mance variation in the 1,500 m test for a group of well-trained runners24
and a group of moderately trained runners6, respectively. When vVO 2max
was obtained through the Léger and Boucher 12 protocol in well-trained
endurance runners, Lacour et al. 22 found a high correlation (r = 0.96)
between this index and v1,500.
In the 5,000 m test, the results conirm the indings of other studies that investigated the relationship between vVO2max and the performance of endurance runners at this distance8,11,25,26. Tanaka et al.8 found a signiicant
correlation between vVO2max and the performance of runners at distance of 5,000 m at diferent stages of an endurance training program (correla-tion coeicients between -0.67 and -0.79). Also in the 5,000 m test, Lacour et al.11 observed signiicant correlation (r = 0.86) between vVO
2max and
v5,000. In addition, when estimated from the submaximal relationship between VO2 and the running velocity, vVO2max has also been correlated (r = -0.63) with the 5,000 m test26. On the other hand, in a group of
mod-erately trained runners, Mercier and Léger25 found high correlation (r =
Performance prediction of endurance runners Souza et al.
of 5,000 m test. However, this high correlation may be explained by the heterogeneous characteristics of the sample 25.
Blood lactate response also shows an important relationship with performance in endurance tests17. his was conirmed in this study, since
AT was the only index that explained performance in the 10,000 m test (Tables 3 and 4). Moreover, v10,000 was very similar to AT determined in both protocols (Table 2). In fact, AT has shown signiicant associations with the performance of endurance runners in the 10,000 m test5,8. hus,
based on data obtained, it could be inferred that the performance at this distance is highly dependent on aerobic capacity.
However, although being an important physiological parameter of aerobic capacity17, blood lactate is very diicult to be determined in sports
due to several factors (e.g., high costs, invasive procedures, etc.). In contrast, the heart rate response, although still very contradictory27, has shown a
direct relationship with the blood lactate response during exercise15,16. Based
on this relationship, this study has hypothesized that by identifying the HRDP in the Léger and Boucher12 test, it would be possible to estimate AT
using the method of Heck et al.9 for incremental protocols with stages of
3 min duration. his could be conirmed, since no signiicant diference was found for this index when compared between laboratory and UM protocols (Table 1).
CONCLUSION
Based on the results found, it was concluded that the prediction of the aerobic performance in moderately trained endurance runners using VO2max, vVO2max and AT (determined in laboratory and in UM) is dependent on the running distance (1.500m, 5,000m 10,000m). Further-more, no diferences were observed in mean values of indexes obtained using the diferent protocols, although indexes determined in UM showed greater predictive power of performance than those determined in labo-ratory, thus conirming the ecological validity of the test proposed by Léger and Boucher12.
REFERENCES
1. Brandon LJ. Physiological factors associated with middle distance running perfor-mance. Sports Med 1995;19(4):268-7.
2. Schabort EJ, Killian SC, St Clair Gibson A, Hawley JA, Noakes TD. Prediction of triathlon race time from laboratory testing in national triathletes. Med Sci Sports Exerc 2000;32(4):844-9.
3. McLaughlin JE, Howley ET, Bassett Jr. DR, hompson DL, Fitzhugh EC. Test of the classic model for predicting endurance running performance. Med Sci Sports Exerc 2010;42(5):991-7.
Exerc 1989;21(1):78-83.
6. Denadai BS, Ortiz MJ, Mello MT. Índices isiológicos associados com a performance aeróbia em corredores de endurance: efeitos da duração da prova. Rev Bras Med Esporte 2004;10(5):401-4.
7. Noakes TD, Myburgh KH, Schall R. Peak treadmill running velocity during the VO2max test predicts running performance. J Sports Sci 1990;8(1):35-45. 8. Tanaka K, Matsuura Y, Matsuzaka A, Hirakoba K, Kumagai S, Sun SO, et al. A
longitudinal assessment of anaerobic threshold and distance running performance. Med Sci Sports Exerc 1984;16(3):278-82.
9. Heck H, Mader A, Hess G, Mucke S, Müller R, Hollmann W. Justiication of the 4-mmol/l lactate threshold. Int J Sports Med 1985;6(3):117-30.
10. Billat VL, Flechet B, Petit B, Muriaux G, Koralsztein JP. Interval training at VO2max: efects on aerobic performance and over training markers. Med Sci Sports Exerc 1999;31(1):156-63.
11. Lacour JR, Padilla-Magunacelaya S, Barthélémy JC, Dormois D. he energetics of middle distance running. Eur J Appl Physiol Occup Physiol 1990;60(1):38-43. 12. Léger L, Boucher R. An indirect continuous running multistage ield test: the
Université de Montréal track test. Can J Appl Sport Sci 1980;5(2):77-84.
13. Berthoin S, Pelayo P, Lensel-Corbel G, Robin H, Gerbeaux M. Comparison of maximal aerobic speed as assessed with laboratory and ield measurements in moderately trained subjects. Int J Sports Med 1996;17(7):525-9.
14. Basset FA, Chouinard R, Boulay MR. Training proile counts for time to exhaustion performance. Can J Appl Physiol 2003;28(4):654-66.
15. Conconi F, Ferrari M, Ziglio PG, Droghetti P, Codeca L. Determination of the anaerobic threshold by a noninvasive ield test in runners. J Appl Physiol 1982;52(4):869-73.
16. Conconi F, Grazzi G, Casoni I, Guglielmini C, Borsetto C, Ballarin E, et al. he Conconi test: methodology ater 12 years of application. Int J Sports Med 1996;17(7):509-19.
17. Billat VL. Interval training for performance: a scientiic and empirical practice special recommendations for middle- and long-distance running. Part I: Aerobic interval training. Sports Med 2001;31(1):13-31.
18. Lacour JR, Padilla-Magunacelaya S, Chatard JC, Arsac L, Barthélémy JC. As-sessment of running velocity at maximal oxygen uptake. Eur J Appl Physiol 1991;62(2):77-82.
19. Kuipers H, Verstappen FT, Keizer HA, Geurten P, van Kranenburg G. Variability of aerobic performance in the laboratory and its physiologic correlates. Int J Sports Med 1985;6(4):197-201.
20. Kara M, GökbeL H, Bediz C, Ergene N, Uçok K, UysaL H. Determination of the heart rate delection point by the Dmax method. J Sports Med Phys Fitness 1996;36(1):31-4.
21. Spencer MR, Gastin PB. Energy system contribution during 200 to 1500m running in highly trained athletes. Med Sci Sports Exerc 2001;33(1):157-62.
22. Lacour JR, Montmayeur A, Dormois D. Validation of the UM test in a group of elite midlle-distance runners. Sci Mot 1989;7:3-8.
23. Berthoin S, Gerbeaux M, Turpin E, Guerrin F, Lensel-Corbeil G, Vandendorpe F. Comparison of two ield tests to estimate maximum aerobic speed. J Sports Sci 1994;12(4):355-62.
Performance prediction of endurance runners Souza et al.
Corresponding author
Kristopher Mendes de Souza Universidade Federal de Santa Catarina (UFSC)
Centro de Desportos – Laboratório de Esforço Físico (LAEF) – Bloco V Trindade.
88040-900, Florianópolis, SC E-mail: [email protected]
25. Mercier D, Léger L. Prediction of the running performance with the maximal aerobic power. Staps 1986;14:5-28.
26. Paavolainen LM, Nummela AT, Rusko HK. Neuromuscular characteristics and muscle power as determinants of 5-Km running performance. Med Sci Sports Exerc 1999;31(1):124-30.