RBCDH
Licence Creative Commom CC BY1 Universidade Estadual Paulista. Instituto de Biociências. Pós--Graduação em Ciências da Motri-cidade. Rio Claro, SP. Brasil.
2 Centro de Estudos e Laborató-rio de Avaliação e Prescrição de Atividades Motoras. Presidente Prudente, SP. Brasil.
3 Universidade do Oeste Paulista. Departamento de Educação Física. Presidente Prudente. SP. Brasil.
4 Universidade de São Paulo. Pós--Graduação em Epidemiologia. São Paulo, SP. Brasil.
5 Universidade Estadual Paulista. Departamento de Educação Física. Presidente Prudente. SP. Brasil.
Received: 14 September 2012 Accepted: 22 January 2013
Predictive capacity of anthropometric
indicators for abdominal fat in the
oldest old
Capacidade preditiva de indicadores antropométricos na
indicação da gordura abdominal em idosos longevos
Vanessa Ribeiro dos Santos1,2
Diego Giulliano Destro Christofaro3,5
Igor Conterato Gomes4
Lionai Lima dos Santos 2
Ismael Forte Freitas Júnior1,2,5
Abstract – Cardiovascular diseases are a growing public health problem that afects most people over the age of 65 years and abdominal obesity is one of the risk factors for the development of these diseases. here are several methods that can be used to measure body fat, but their accuracy needs to be evaluated, especially in speciic populations such as the elderly. he aim of this study was to assess the accuracy of anthropometric indicators to estimate the percentage of abdominal fat in subjects aged 80 years or older. A total of 125 subjects ranging in age from 80 to 95 years (83.5 ± 3), including 79 women (82.4 ± 3 years) and 46 men (83.6 ± 3 years), were studied. he following anthropometric indicators were used: body mass index (BMI), waist circumference (WC), waist-hip ratio (WHR), and waist-to-height ratio (WHtR). he percentage of abdominal fat was measured by DEXA. Sensitivity and speciicity were analyzed using an ROC curve. he sensitivity, speciicity and AUC were 0. 578, 0. 934 and 0. 756 for BMI, respectively; 0.703, 0.820 and 0.761 for WC; 0.938, 0.213 and 0.575 for WHR, and 0.984, 0.344 and 0.664 for WHtR. BMI and WC were the anthropometric indicators with the largest area under the curve and were therefore more adequate to identify the presence or absence of abdominal obesity.
Key words: Abdominal adiposity; Anthropometric indicators; Elderly.
Abdominal fat indicators in the elderly Santos et al.
INTRODUCTION
he life expectancy of the population is growing around the world. In Bra-zil, the aging rate has increased from 10.5% in 1980 to 19.4% in 2006. his increase was more expressive in the group of individuals older than 75 years, particularly those aged 80 years or older1. Aging is a dynamic and progressive
process characterized by morphological, functional and biochemical altera-tions and is associated with the prevalence of chronic non-communicable diseases (NCDs) such as cardiovascular diseases, hypertension, diabetes, and other metabolic disorders2. he proportion of Brazilian older adults with
some type of NCD is approximately 77%3. he treatment of these diseases
leads to increases in public health spending and in the number of subjects attending basic health units. In addition, NCDs afect the quality of life of elderly people, decreasing independence in instrumental activities of daily living and daily life activities4, and may even cause death.
he prevalence of death due to NCDs has increased from 14.2% in 1901 to 49.6% in 20055, with cardiovascular diseases accounting for about 16.6
million of these deaths in the world6. Studies have shown that the
diagno-sis of some of these diseases is associated with obesity, mainly abdominal obesity7,8, which is an inherent feature of the aging process9. Gomes et al.10,
investigating the frequency of cardiovascular risk factors in the oldest old, observed that 45% of the participants presented abdominal obesity. his inding is a matter of concern since excess fat in this region compromises the mobility of older adults more than total body fat or fat accumulation at other sites. Bouchard et al.11 therefore considered the identiication of
excess fat in this region to be of the utmost importance.
Anthropometry is the method most commonly used for the estimation of body fat because of its easy application, low cost, and high correlation with more precise methods12. In addition, the predictive capacity of
anthro-pometric indicators for abdominal fat in adults and younger elderly has been demonstrated in the literature13-15. However, studies investigating the
predictive capacity of these indicators the oldest old are scarce. In view of the apparent association of aging with increased adiposity and the incidence of NCDs, accessible and inexpensive procedures such as anthropometry are important to estimate excess abdominal fat in subjects over the age of 80 years. herefore, the objective of the present study was to evaluate the predictive capacity of anthropometric indicators to estimate the percentage of abdominal fat in older adults aged 80 years or older.
METHODOLOGICAL PROCEDURES
Sample
the municipality, were invited to participate in the study. he municipal department of health provided the name, address and telephone number of subjects ≥ 80 years, who used the public health service of the town. On the basis of this information, individuals were invited by telephone and the study was also disseminated through local media.
Excluded from the sample were subjects unable to walk, bedridden and institutionalized subjects, rural residents, subjects with a pacemaker, and those with incomplete data in the database. he inal sample consisted of 125 older adults of both genders aged 80 years or older.
he subjects invited to participate received detailed information about the objectives of the study and method used for data collection and only those who signed the free informed consent form were included in the sample. he study protocol was approved by the Ethics Committee of Universidade Estadual Paulista (Permit No. 26/2009).
Anthropometry
he following anthropometric measures were obtained: body weight, height, waist circumference (WC), and hip circumference for the calculation of body mass index (BMI), waist-hip ratio (WHR), and waist-to-height ratio (WHtR).
BMI
Body weight was measured with a Filizola® electronic scale (maximum ca-pacity of 180 kg) to the nearest 0.1 kg. A Sanny® stadiometer (2.20 m) ixed to the wall was used for the measurement of height to the nearest 0.1 cm. hese values were used to calculate BMI as weight divided by the square of the height. he following cut-ofs suggested by Troiano et al. (1996)16 were
used to classify excess weight: eutrophic < 28 kg/m2 and obese ≥ 28 kg/m2.
Waist circumference
WC was measured in millimeters at the midpoint between the iliac crest and last rib with an anthropometric metal tape. he cut-of values adopted for the indication of abdominal obesity were 88 cm for women and 102 cm for men17.
Waist-hip ratio
Waist and hip circumferences were used for the calculation of WHR. WC was measured at the midpoint between the iliac crest and last rib. For hip circumference measurement, the tape was positioned around the hips at the greatest protuberance. WC was then divided by hip circumference, both measured in centimeters, and the cut-of values suggested by Pereira18
were used for analysis (0.95 for men and 0.80 for women).
Waist-to-height ratio
Abdominal fat indicators in the elderly Santos et al.
Dual-energy X-ray absorptiometry
Total body fat was measured by dual-energy X-ray absorptiometry (DEXA) using the Lunar DPX-NT system (Lunar/GE Corp., Madison, WI), which uses a three-compartment model (lean mass, fat mass, and bone mass). his technique permits to estimate whole body composition and the com-position of subregions.
Statistical analysis
For numerical variables, normality of the data was conirmed by the Kolmogorov-Smirnov test. hus, descriptive statistics consisted of mean values (central tendency) and standard deviation (dispersion). he mean values of each variable were compared between genders by the Student t-test for independent samples. Sensitivity and speciicity were calculated using an ROC curve. he SPSS 13.0 sotware was used for statistical analysis, adopting a level of signiicance of 5%.
RESULTS
he general characteristics and anthropometric variables of the sample, stratiied according to gender, are shown in Table 1. here was no difer-ence in mean age between genders. Men presented higher weight, height (p=0.000), WC and WHR (p=0.001) than women. However, the percentage of trunk fat was higher in women (p≤0.001).
Table 1. General characteristics of the sample according to gender.
Variable Men
(n=46)
Women
(n=79) t p
Age (years) 83.2±2.8 83.3±2.9 0.382 0.703
Body weight (kg) 72.7±16.7 59.0±10.8 4.961 0.000
Height (cm) 164.8±8.0 150.9±7.2 10.118 0.000
BMI (kg/m2) 26.6±5.1 25.9±4.1 0.883 0.379
Waist circumference (cm) 97.1±13.6 87.9±11.5 4.064 0.001
Hip circumference (cm) 98.4±10.6 97.7±8.8 0.380 0.705
WHR (cm/cm) 0.99±0.08 0.90±0.07 6.591 0.001
WHtR (cm/cm) 0.59±0.08 0.58±0.08 0.408 0.684
Trunk fat (%) 34.2±10.4 41.7±10.3 -3.904 0.000
Total body fat (%) 29.5±8.8 40.2±8.5 -6.664 0.001
Values are reported as the mean ± standard deviation.
BMI: body mass index; WHR: waist-hip ratio; WHtR: waist-to-height ratio.
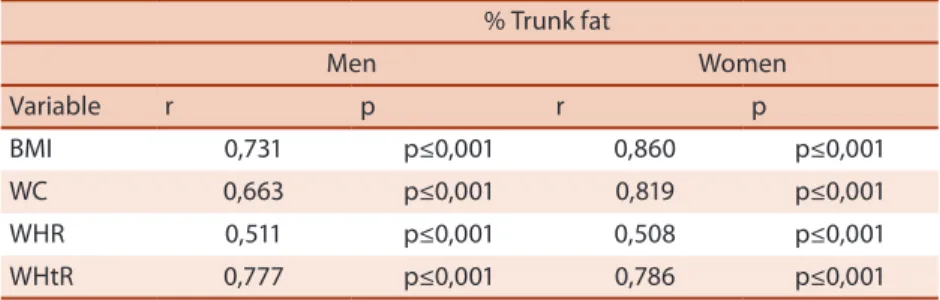
Men Women
Variable r p r p
BMI 0,731 p≤0,001 0,860 p≤0,001
WC 0,663 p≤0,001 0,819 p≤0,001
WHR 0,511 p≤0,001 0,508 p≤0,001
WHtR 0,777 p≤0,001 0,786 p≤0,001
BMI: body mass index; WC: waist circumference; WHR: waist-hip ratio; WHtR: waist-to-height ratio.
Among the anthropometric indicators studied, BMI presented a sensi-tivity of 0.578 in identifying abdominal, speciicity of 0.934, and area under the curve (AUC) of 0.756. WC presented a sensitivity of 0.703, speciicity of 0.82, and AUC of 0.761. he sensitivity and speciicity of WHR was 0.938 and 0.213, respectively, with a predictive capacity of 0.575. WHtR presented the best sensitivity (0.984) in identifying abdominal fat, with a speciicity of 0.344 and predictive capacity of 0.664. Table 3 shows the sensitivity, speciicity and AUC of the anthropometric indicators according to gender.
Table 3. Sensitivity and speciicity of abdominal fat indicators according to gender.
% Trunk fat
Men (n=46) Women (n=79)
Sensitivity Speciicity AUC Sensitivity Speciicity AUC
BMI 0.625 0.909 0.767 0.550 0.949 0.749
WC 0.583 0.864 0.723 0.775 0.795 0.785
WHR 0.958 0.364 0.661 0.925 0.182 0.527
WHtR 1.000 0.227 0.614 0.975 0.128 0.693
AUC: area under the curve; BMI: body mass index; WC: waist circumference; WHR: hip ratio; WHtR: waist-to-height ratio.
he comparison of the predictive capacity (AUC) of the anthropometric indicators to identify the presence or absence of abdominal fat is shown in Figure 1. he highest AUC values were observed for BMI and WC, with the diference being signiicant when compared to WHR and WHtR (p<0.05).
Abdominal fat indicators in the elderly Santos et al.
DISCUSSION
Aging is characterized by morphological alterations, especially the ac-cumulation of body fat and reduction of lean mass, a process known as sarcopenia. Within this context, anthropometry has been used in clinical and epidemiological studies for the identiication of excessive accumulation of fat in the body20. In addition, the evaluation of abdominal fat is important
since excess abdominal adiposity is associated with several diseases such as hypertension21, diabetes22, and dyslipidemias23. According to Wannamethee
et al.24, a positive association exists between the amount of abdominal fat
and mortality risk in elderly people, but the indicator of obesity that best characterizes the risk in this population is still undeined.
Shaw et al.14 compared WC and WHR with a more sophisticated
method (DEXA) in adults and older adults ranging in age from 50 to 79 years. Good agreement was observed between WC and DEXA, but the WHR results were highly variable. In the study of Roriz et al.15, WC also
showed good predictive capacity for visceral fat in adults and older adults when computed tomography was used as a reference. In agreement with these studies, WC also showed high predictive capacity in the present investigation.
Another indicator currently used is WHtR25,26. Haun, Pitanga and
Lessa27 found that WHtR possesses a good power to detect increased
coronary risk (AUC = 0.76) in adults and older adults ranging in age form 30 to 74 years. Schneider et al.28 showed that WHtR is a better indicator
of cardiovascular risk and mortality than BMI, WC and WHR in adults and older adults of both genders. In the present study, WHtR presented high sensitivity in identifying abdominal fat (100% for men and 97.5% for women), but speciicity was very low. his fact resulted in a low AUC, which was lower than that obtained for BMI and WC.
Pitanga and Lessa29 evaluated diferent anthropometric indicators of
obesity as a screening tool for coronary risk in 968 adults and observed that WHR was one of the best predictors of coronary risk. In contrast to that study, the present results showed that BMI and WC were the best pre-dictors (higher AUC values) when compared to the other anthropometric indicators. Gomes et al.13 found a strong correlation of BMI and WC with
abdominal fat in older adults aged 60 to 80 years, in agreement with the present indings obtained for the population older than 80 years.
Another factor that may explain these diferences is the fact that BMI is the only anthropometric indicator with pre-established cut-of values for the elderly population. One advantage of WHtR in relation to the other indicators is that normalization of WC for height permits to obtain a pre-dictor of abdominal fat that is not inluenced by the subject’s height. his is an interesting aspect, particularly in older adults, since height undergoes important changes during growth and development30. However, no cut-of
of this study was that BMI continued to show the best relationship with DEXA when only crude AUC values (without the use of cut-ofs) were analyzed, as demonstrated in Figure 1.
One of the limitations of the present study is the fact that no biochemi-cal parameters were used to discriminate increased cardiovascular risk. Furthermore, the WC, WHR and WHtR cut-ofs were adapted from the adult population since no values exist for the oldest old. However, a strength of the study was the objective to evaluate subjects older than 80 years, a population that has not been explored in the literature, particularly because of the overall increase in life expectancy in diferent countries2.
CONCLUSION
he anthropometric indicators studied had limited capacity to correctly identify the presence/absence of excess abdominal fat. Nevertheless, BMI and WC presented the best performance in older adults over the age of 80 years. he determination of the best anthropometric indicator of abdomi-nal fat is important since anthropometry is an easy and low-cost method. hese indicators can therefore be used in public health services to identify excess abdominal fat and cardiovascular risk, which can cause dependence in activities of daily living in elderly subjects.
REFERENCES
1. Nogueira SL, Geraldo JM, Machado JC, Ribeiro RCL. Distribuição espacial e crescimento da população idosa nas capitais brasileiras de 1980 a 2006: um estudo ecológico. Rev Bras Est Pop 2008;25(1):195-8.
2. Veras R. Fórum Envelhecimento populacional e as informações de saúde do PNAD: demandas e desaios contemporâneos. Cad Saúde Pública 2007; 23(10):2463-6. 3. Instituto Brasileiro de Geograia e Estatística/IBGE. Censo Demográico e
Conta-gem da População: População residente por sexo, situação e grupos de idade. 2010; Available from <http//www.sidra.ibge.gov.br>[2012 Set 10].
4. Alves LC, Leimann BCQ, Vasconcelos MEL, Carvalho MS, Vasconcelos AGG, Fonseca TCO, et al. A inluência das doenças crônicas na capacidade fun-cional dos idosos do município de São Paulo, Brasil. Cad Saúde Pública 2007; 23(8):1924-30.
5. Buchalla CM, Waldman EA, Laurenti R. A mortalidade por doenças infecciosas no início e no inal do século XX no Município de São Paulo. Rev Bras Epidemiol 2003;6(4):335-44.
6. Zanesco A, Zaros PR. Exercício físico e menopausa. Rev Bras Ginecol Obstet 2009;31(5):254-61.
7. Girotto E, Andrade SM, Cabrera MA. Prevalence of abdominal obesity in hyperten-sive patients registered in a Family Health Unit. Arq Bras Cardiol 2010;94(6):754-62. 8. Banegas JR, López-García E, Graciani A, Guallar-Castillón P, Gutierrez-Fisac
Abdominal fat indicators in the elderly Santos et al.
9. Sakurai T, Limuro S, Araki A, Umegaki H, Ohashi Y, Yokono K. Age-associated increase in abdominal obesity and insulin resistance, and usefulness of HA/ NHLBI deinition of metabolic syndrome for predicting cardiovascular disease in Japanese elderly with type 2 diabetes mellitus. Gerontology 2010;56(2):141-9. 10. Gomes IC, Santos VR, Christofaro DGD, Santos LL, Freitas Júnior IF. he most
frequent cardiovascular risk factors in Brazilian aged 80 years or older. J Appl Gerontol 2011; DOI: 10.1177/0733464811427443.
11. Bouchard DR, Choquette S, Dionne IJ, Brochu M. Is fat mass distribution related to impaired mobility in older men and women? Nutrition as a determinant of suc-cessful aging: he Quebec Longitudinal Study. Exp Aging Res 2011;37(30): 346-57. 12. Sun Q, Van DRM, Spiegelman D, Heymsield SB, Willett WC, Hu FB. Comparison
of dual-energy x-ray absorptiometric and anthropometric measures of adiposity in relation to adiposity-related biologic factors. Am J Epidemiol 2010;172(12):1442-54. 13. Gomes MA, Rech CR, Gomes MBA, Santos DL. Correlação entre índices
an-tropométricos e distribuição de gordura corporal em mulheres idosas. Rev Bras Cineantropom Desempenho Hum 2006;8(3):16-22.
14. Shaw KA, Srikanth VK, Fryer JL, Blizzard L, Dwyer T, Venn AJ. Dual energy X-ray absorptiometry body composition and aging in a population-based older cohort. Int J Obes 2007; 31(2):279-84.
15. Roriz AK, De Oliveira CC, Moreira PA, Eickember GM, Medeiro JM, Sampaio LR. Methods of predicting visceral fat in Brazilian adults and older adults: a com-parison between anthropometry and computerized tomography. Arch Latinoam Nutr 2011;61(1):5-12.
16. Troiano RP, Frongillo Jr EA, Sobal J, Levitsky DA. he relationship between body weight and mortality: a quantitative analysis of combined information from exist-ing studies. Int J Relat Metab Disord 1996;20(1):63-75.
17. Lean ME, Han TS, Seidell JC. Impairment of health and quality of life in people with large waist circumference. Lancet 1998;351:853-6.
18. Pereira RA, Sichieri R, Marins VMR. Razão cintura/quadril como preditor de hipertensão arterial. Cad Saúde Pública 1999;15(2):333-44.
19. Pitanga FJG, Lessa I. Razão cintura-estatura como discriminador do risco coro-nariano de adultos. Rev Assoc Med Bras 2006; 52(3):157-61.
20. Sampaio LR. Avaliação nutricional e envelhecimento. Rev Nutr Campinas 2004; 17(4):507-14.
21. Hirani V. Generalised and abdominal adiposity are important risk factors for chronic disease in older people: results from a nationally representative survey. J Nutr Health Aging 2011;15(6):469-78.
22. Sluik D, Boeing H, Montonen J, Pischon T, Kaaks R, Teucher B, et al. Associations between general and abdominal adiposity and mortality in individuals with dia-betes mellitus. Am J Epidemiol 2011;174(1):22-34.
23. Palacios C, Pérez CM, Guzmán M, Ortiz AP, Ayala A, Suárez E. Association between adiposity indices and cardiometabolic risk factors among adults living in Puerto Rico. Public Health Nutr 2011;14(10):1714-23.
24. Wannamethee SG, Shaper AG, Lennon L, Whincup PH. Decreased muscle mass and increased central adi posity are independently related to mortality in older men. Am J Clin Nutr 2007;86(5):1339-46.
25. Czernichow S, Kengne AP, Stamatakis E, Hamer M, Batty GD. Body mass in-dex, waist circumference and waist-hip ratio: which is the better discriminator of cardiovascular disease mortality risk?: evidence from an individual-partic-ipant meta-analysis of 82864 particindividual-partic-ipants from nine cohort studies. Obes Rev 2011;12(9):680-7.
Corresponding author
Vanessa Ribeiro dos Santos Departamento de Educação Física. Rua Roberto Simonsen, 305. 19060-900 - Presidente Prudente, SP. Brasil.
E-mail: [email protected]
Rev Assoc Med Bras 2009; 55(6):705-11.
28. Schneider HJ, Friedrich N, Klotsche J, Pieper L, Nauck M, John U. et al. he predic-tive value of diferent measures of obesity for incident cardiovascular events and mortality. J Clin Endocrinol Metab 2010;95(4):1777-85.
29. Pitanga FJ, Lessa I. Anthropometric indexes of obesity as an instrument of screen-ing for high coronary risk in adults in the city of Salvador-Bahia. Arq Bras Cardiol 2005;85(1):26-31.