INTRODUCTION
Perinatal deaths include stillbirths plus early neona-tal deaths, defined as the deaths occurring in the first week after birth (Belitzky et al., 1978). A knowledge of perina-tal morperina-tality rates is very useful for evaluating indirectly the results of prenatal and perinatal care since any improve-ment results in a striking decrease in the early neonatal death and stillbirth rates (Osbourne and Patel, 1985; Papiernik et al., 1985). The perinatal mortality rate of twins is higher than that of singletons in all populations studied (Chen et al., 1992). Since there is little information on this aspect for Brazilian twins, we have investigated the frequency of stillbirths and of early neonatal deaths among twins and singletons born in a large city in southeastern Brazil.
SUBJECTS AND METHODS
One thousand and sixty-two twin pairs (412 MM, 279 MF and 371 FF pairs) and 115,637 singletons born from 1984 to 1996 were investigated using the records of the largest obstetric center (Maternidade de Campinas) in the city of Campinas, SP, Brazil, which assists women belong-ing to all social segments of the population (40% private patients, 59% welfare program patients and 1% indigents). Fetuses weighing ≤ 500 g were excluded from the study and classified as abortions, since this fetal weight
corresponds to a gestational age of 20-22 weeks (Belitzky et al., 1978). Children born without both respiratory and voluntary muscle movements, and no heartbeat or umbili-cal cord pulse were considered as stillbirths, while chil-dren who died in the first seven days of life were classi-fied as early neonatal deaths. Data on early neonatal deaths were obtained for the entire period, while data on still-births were restricted to the period from 1988 to 1996. As the twins were not classified by any available zygosity test, the frequency of monozygotic pairs was estimated using the classic Weinberg differential rule (1901).
The twins who remained alive and a sample of 1522 singletons born in the same period and in the same hospi-tal as the twins were used as controls for comparison of the gestational age, birth weight, and Apgar scores of still-births and neonates who died in the first week after birth. Since the records of these 1522 singletons were not al-ways complete, the number of control cases varied slightly for gestational age, birth weight and Apgar scores.
Newborns with gestational ages less than 37 weeks were classified as preterm. Gestational ages of 37-42 weeks indicated newborns at term, while gestational ages of more than 42 weeks indicated post-mature newborns (Belitzky et al., 1978). Children born with less than 2,500 g were classified as low birth weight, and those with less than 1,500 g at birth as very low birth weight (Keith, 1994). The clinical condition of the newborns was evaluated using
Perinatal mortality among twins and singletons in a city in southeastern
Brazil, 1984-1996
Bernardo Beiguelman1 and Carla Franchi-Pinto2
Abstract
Analysis of 116,699 deliveries (1062 twin pairs and 115,637 singletons) which occurred from 1984 to 1996 at the largest obstetric center in Campinas, SP, Brazil, provided the following conclusions: 1) despite the low percentage of twin births (0.9%), 10.7% of all early neonatal deaths and 3.5% of all stillbirths were twins. Compared to singletons, the likelihood of stillbirths and early neonatal deaths among twins was 1.9 and 6.5 times greater, respectively. 2) The proportion of twins among early neonatal deaths tended to decrease, probably because of improvements in prenatal and perinatal care. 3) The critical period for early neonatal deaths in singletons and twins lasted for the three first days after birth. 4) The incidence of perinatal deaths among twins was highest among MM pairs, followed by FF pairs, and lowest among MF pairs. 5) There was a trend towards a decrease in the annual rate of early neonatal deaths among both singletons and twins, and of stillbirths among singletons, the latter being more conspicuous among females. 6) The sex ratio of singletons was practically stable among living newborns, but showed strong cyclic variation among early neonatal deaths, and a tendency to increase among stillbirths. Twins who died in the first week, as well as living twins showed a strong increase in their sex ratio from 1984 to 1996. 7) The mean gestational age of singletons was highest among living newborns followed by stillbirths, and was lowest among early neonatal deaths. The mean gestational age of living twins was higher than that of early neonatal deaths, but not different from that of stillbirths. 8) The mean birth weight of singletons and twins was highest among living newborns, followed by stillbirths, and lowest among early neonatal deaths. 9) Apgar scores ≥ 7 obtained five minutes after birth are inadequate as a reliable indicator of the clinical condition of the newborn, since almost half of the early neonatal deaths had 5-min Apgar scores varying from 7 to 10.
1Laboratório de Epidemiologia Genética, Departamento de Parasitologia, ICB, USP, São Paulo, SP, Brasil. 2Serviço de Genética Médica do Hospital da Sta. Casa de Misericórdia, São Paulo, SP, Brasil.Send correspondence to B.B.
Apgar scores (Apgar, 1953) obtained 1 min and 5 min after birth. Apgar scores were divided into two classes: < 7 (bad prognosis) and ≥ 7 (good prognosis), since scores vary-ing from 7 to 10 indicated a very low risk of respiratory or neuropsychomotor developmental complications, while scores from 4 to 6 indicated moderate asphyxia, and scores lower than 4 were associated with a high risk of mortality and cerebral palsy (Grothe and Rüttgers, 1985; Commit-tee on Fetus and Newborn, AAP, 1986; Fanaroff and Mar-tin, 1992).
The best fit curves for the distribution of the data were obtained using the software Curve Fits (version 4.27).
The proportions were compared using the chi-square or Fisher’s exact test, while the variances and the means were compared using the F- and Student’s t-test, respectively.
RESULTS AND DISCUSSION
The data on single and twin births covering the pe-riod from 1984 to 1996 are shown in Tables I and II, re-spectively. These data include the number of newborns per year classified according to sex, early neonatal death and stillbirth rates, as well as their sex ratio. Based on these data, the proportion of twins among the newborns was only
Table II - Early neonatal death rate per 1,000 (NDR) from 1984 to 1996, number of stillbirths (ST) and stillbirth rate per 1,000 (STR) from 1988 to 1996 among twins born at the Maternidade de Campinas.
The sex ratios (number of males per 100 females) of all newborn co-twins and of those who died in the first week (ND) are also shown.
Year Males Females Total Sex ratio
No. NDR ST No. NDR ST No. NDR STR TWINS NDR
1984 52 115.38 100 40.00 152 65.79 52.0 150.0
1985 83 132.53 73 95.89 156 115.38 113.7 l57.0
1986 88 79.54 84 71.43 172 75.58 104.8 116.7
1987 65 30.76 63 111.11 128 70.31 103.2 28.6
1988 81 37.04 2 85 94.12 - 166 66.26 12.05 95.3 37.5 1989 79 50.63 1 61 32.79 2 140 42.86 21.43 129.5 200.0 1990 65 76.92 4 69 28.99 2 134 52.24 44.78 94.2 250.0 1991 89 67.42 1 79 50.63 - 168 59.52 5.95 112.7 150.0
1992 88 79.54 - 80 12.50 - 168 47.62 - 110.0 700.0
1993 69 28.99 - 73 13.70 1 142 21.13 7.04 94.5 200.0 1994 100 40.00 8 80 37.50 - 180 38.89 44.44 125.0 133.3 1995 127 39.37 3 109 9.17 3 236 25.42 25.42 116.5 500.0
1996 117 76.92 - 65 - 2 182 49.45 10.99 180.0
-Total 1103 64.37 19 1021 45.05 10 2124 55.08 19.13 108.0 154.3 Table I - Early neonatal death rate per 1,000 (NDR) from 1984 to 1996 and stillbirth rate per 1,000 (STR) from 1988 to 1996 among singletons born at the Maternidade de Campinas. The sex ratios (number of males per 100 females) of all singletons,
of those who died in the first week (ND) and of stillborn (ST) singletons are also shown.
Year Males Females Total* Sex ratio
No. NDR STR No. NDR STR No. NDR STR Births ND ST
1984 4498 8.23 4261 11.03 8786 9.56 106.6 78.7
1985 4626 9.73 4559 8.55 9197 9.13 101.5 115.4
1986 4693 11.51 4579 12.23 9284 12.06 102.5 96.4
1987 3868 8.53 3776 6.36 7653 7.45 102.4 137.5
1988 4560 10.96 11.84 4300 5.58 8.14 8871 8.45 10.26 106.0 208.3 154.3 1989 4432 9.93 11.73 4304 8.36 12.08 8748 9.26 12.96 103.0 122.2 100.0 1990 4287 9.80 10.73 3876 11.61 9.55 8176 10.64 10.40 110.6 93.3 124.3 1991 4091 7.82 8.56 3841 8.59 10.41 7951 8.30 10.19 106.5 97.0 87.5 1992 4230 11.11 11.82 4186 9.32 7.88 8419 10.21 9.86 101.1 120.5 151.5 1993 4614 7.37 9.32 4328 6.47 7.62 8943 7.04 8.50 106.6 121.4 130.3 1994 4853 4.74 7.62 4756 5.05 7.36 9611 4.99 8.32 102.0 95.8 105.7 1995 5073 9.07 11.43 4837 5.58 9.30 9915 7.36 10.39 104.9 170.4 128.9 1996 5096 8.05 10.40 4983 3.61 8.23 10083 5.85 9.32 102.3 227.8 129.3
Total 58921 8.96 10.39 56586 7.78 8.91 115637 8.43 9.99 104.1 120.0 121.9
1.8%, indicating that the percentage of twin deliveries was less than one percent (0.9%). In spite of the low percent-age of twin births in this period, 10.7% of all early neona-tal deaths and 3.5% of all stillbirths were twin births. Twins were thus responsible for 7.6% of all perinatal deaths. Compared to singletons, the likelihood of stillbirths, early neonatal death and perinatal mortality among twins was 1.9, 6.5, and 4, respectively. These figures are consistent with data reported elsewhere (Osbourne and Patel, 1985; Papiernik et al., 1985; Doherty, 1988; Lumme and Saarikoski, 1988; Spellacy et al., 1990; Kiely, 1991; Fraser et al., 1991; Chen et al., 1992; Keith, 1994). The early neonatal death rate/stillbirth rate ratio among twins (2.9) was almost 2.5 times higher than that among single-tons (1.2).
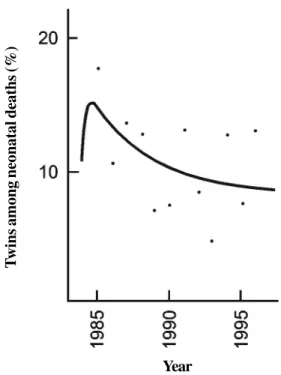
The high proportion of twins among early neonatal deaths was an average value, and there was a tendency for this frequency to decrease as shown clearly in the best fit regression curve for the annual variation of this propor-tion (Figure 1). This decline probably reflects the improve-ment in the conditions of obstetric and pediatric practice. The use of ultrasound, which enabled the early diagnosis of multiple gestation and increased the frequency of women who received prenatal care, and the improvement in perinatal care were factors that undoubtedly contrib-uted to the increase of the survival of twin births.
Because of the higher perinatal death rate of twins compared with singletons, it was reasonable, when con-sidering early neonatal or stillbirth death rates, to sepa-rate them according to whether they were singletons or twins. Indeed, if the data in Tables I and II had been pooled, the high neonatal death rate observed among twins (55.08 per thousand) would not have been detected since, in the total sample of newborns, the rate would have been esti-mated as 9.27 per thousand. Similarly, the stillbirth rate would have been estimated as 10.15 per thousand in the total sample, thereby obscuring the high stillbirth rate among twins (19.93 per thousand).
Table III shows that the distribution of early neona-tal deaths among singletons and twins according to the days elapsed from birth did not differ significantly, allowing an estimate that almost 80% of all neonatal deaths occurred in the first three days after birth. Thus, in contrast to other populations (Barr and Stevenson, 1961; Doherty, 1988), the critical period for the early neonatal deaths of both singletons and twins was not limited to the first day after birth.
Perinatal mortality was not uniform among MM, FF and MF twin pairs, a phenomenon already pointed out else-where (Lowe and Record, 1951; Barr and Stevenson, 1961; Myrianthopoulos, 1970; Rydhström, 1990). Table IV shows that the incidence of stillbirths and early neonatal deaths was highest among MM pairs, followed by FF twins and lowest among MF pairs. Thus, when the stillbirths and early neonatal deaths were pooled, irrespective of whether one or both elements of the pairs were affected, the
pro-Table IV - Stillbirths and early neonatal deaths among MM, FF and MF twin births, and estimates of the proportion of monozygotic
pairs (MZ) among like-sex pairs.
Pairs Stillbirths Early neonatal deaths MZ
Type No. One Both Total One Both Total
M M 412 8 5 13 (3.2%) 13 23 36 (8.7%) 66.0% FF 371 2 3 5 (1.4%) 10 12 22 (5.9%) 62.5% MF 279 3* 0 3 (1.1%) 4** 10 14 (5.0%)
-* 1 M + 2 F, -*-* 2 M + 2 F.
Table III - Distribution (%) of early neonatal deaths among singletons and twins according to the days elapsed from birth.
Day Singletons (N = 977) Twins (N = 117) Total (N = 1094)
1st 36.7 29.1 35.9
2nd 25.2 32.5 26.0
3rd 16.0 15.4 15.9
4th 8.5 10.2 8.7
5th 6.6 6.0 6.6
6th 4.9 3.4 4.7
7th 2.1 3.4 2.2
χ2= 5.61; 6 d.f.; 0.30 < P < 0.50.
T
wins among neonatal deaths (%)
Year
Figure 1 - Best fit regression curve for the annual distribution (1984-1996) of the percentage of twins among neonatal deaths (y = 6.689 + 28.145 - 23.851).
year2
portions of perinatal deaths among MM (11.9%), FF (7.3%) and MF (6.6%) twin pairs were significantly dif-ferent (χ2 = 8.532; 2 d.f.; P < 0.02).
It is not easy to explain these differences. If the well-known higher vulnerability of male births were the only cause for the excessive perinatal losses among MM twins, one would expect the proportion of perinatal deaths to be higher among MF pairs than among FF pairs. On the other hand, if monozygotic pairs, which were highly frequent in the present series of twins (66% for MM and 62.5% for FF pairs), were the only factor responsible for the exces-sive perinatal deaths among like-sex twins (Barr and Stevenson, 1961; Myrianthopoulos, 1970; Rydhström, 1990), then one would expect MM and FF pairs to show similar frequencies of losses. Since this is not true, and taking into account that the data in Table IV show a signifi-cant excess of perinatal deaths affecting both elements of the twin pairs, the gradient MM > FF > MF may be explained by assuming an association of higher vulnerability of male births with monozygosity and an excess of concordant pairs concerning perinatal deaths. This would explain also why the sex ratio of perinatal deaths in twins was higher than that observed among singletons (Tables I and II).
The regression curves that best fitted for the distri-bution of the annual early neonatal death rates for males, females and both sexes together among singletons and twins are shown in Figures 2 and 3. Figure 2 shows a de-crease in the annual rate of early neonatal deaths among singletons, which was more conspicuous among females. The same tendency of this death rate to decrease was seen when male and female twins were pooled (Figure 3), al-though the annual variation in the early neonatal death rate of twins was not as homogeneous as that of singletons. Indeed, the best fit regression curve for this variation was sinusoidal for males and inverse for females. In any case,
the tendency of the annual early neonatal death rate to de-crease was more conspicuous among female newborns (singletons or twins) than among males.
Figure 4 shows the best fit regression curves for the annual distribution of the stillbirth rates for singletons and twins. Again, the tendency of the stillbirth rate of single-tons to decrease, represented by an inverse regression curve, was influenced by the female newborns. Thus, the quadratic regression curve that best fit the stillbirths rate for male singletons indicated an increase, instead of a de-crease in tendency. The sinusoidal regression curve rep-resenting the annual variation of the stillbirth rate among twins showed a cyclic variation of this trait around the mean value, although it should be stressed that these rates were based on a small number of stillbirths (Table II).
The sexual differences observed in Figures 2 and 3 are reflected in Tables I and II by the higher proportion of male as compared to female neonatal deaths (χ2 = 4.881; 1 d.f.; P < 0.05) and stillbirths (χ2 = 6.608; 1 d.f.; P< 0.05) in the total sample of singletons. The same comparisons in twins produced no significant differences (χ2 = 3.801; 1 d.f.; 0.05 < P < 0.10; χ2 = 1.644; 1 d.f.; 0.10 < P < 0.20), perhaps because of the smaller sample size.
Table I shows that from 1984 to 1996 the annual varia-tion of the sex ratio of singletons was very small, the stan-dard deviation calculated for the annual ratios (2.85) be-ing less than 3% (2.73%) of the mean (104.3). This sta-bility around a mean value was confirmed by the very small amplitude of the best fit sinusoidal regression curve shown in Figure 5. In contrast, the best fit sinusoidal regression curve for the annual distribution of the sex ratio of single-tons who died in the first week after birth was compatible with a cyclic variation of this ratio. The standard deviation calculated for this distribution (45.81) was 35.3% of the mean sex ratio (129.6), indicating a rather large average
Figure 2 - Best fit regression curves for the annual distribution of the early neonatal death rate (ENDR) among singletons born from 1984 to 1996. Males: y = 10.383 e(ln year - 1.129)2
; females: y = 9.483 + 0.147 year - 0.042 year2; total sample: y = 9.288 + 0.253 year - 0.041 year2. -5.435
ENDR among singletons (
0/
00
)
amplitude for this annual distribution (Table I; Figure 5). The last curve in Figure 5, which represents the best fit inverse regression curve for the annual distribution of the sex ratio of stillbirth singletons (Table I), shows a ten-dency towards an increase in their sex ratio. Finally, the best fit quadratic regression curves for the annual variation of the sex ratio of twin births and of twins who died in the first week after birth (Figure 6; Table II), indicate a strong tendency of the sex ratio to increase from 1984 to 1996.
The mean gestational age of twin births is three weeks less than that of singletons (Beiguelman et al., 1997). Since the birth weight is highly dependent on the length of gestation (Pilotto et al., 1993), at birth, twins weigh sig-nificantly less than singletons (Beiguelman et al., 1997).
In contrast to the numerous reports on the gestational age and birth weight of singletons and twins (McKeown and Record, 1952; Powers, 1973; Gedda et al., 1981; Leroy et al., 1982; Watson and Campbell, 1986; Bonnelykke et al., 1987; Alfieri et al., 1987; Buckler and Buckler, 1987; Bleker et al., 1988; Keith 1994; Luke, 1996; Beiguelman et al., 1997), little is known of these traits in stillbirths and early neonatal deaths.
The shorter mean length of gestation and the lower birth weight of twins suggests that these traits should be studied separately in stillbirths and neonatal deaths of twins and singletons (Tables V and VI). Table V shows that still-births have a significantly higher mean gestational age than early neonatal deaths among both singletons (t = 4.250;
Stillbir
th rate (
0/
00
)
Year
Figure 4 - Best fit regression curves for the annual distribution (1988-1996) of the stillbirth rate of males (y = 13.331 - 1.259 year + 0.106 year2), females
(y = 5.643 + 19.991 - 17.389) and total sample of singletons (y = 7.134 + 16.254 - 13.008), as well as of twins [y = 16.709 + 13.213 sin (year - 0.239)].
year2
year year year2
Figure 3 - Best fit regression curves for the annual distribution of the early neonatal death rate (ENDR) among twins born from 1984 to 1996. Males: y = 64.958 + 37.534 sin (year - 0.038); females: y = 17.835 + 463.984 - 409.236); total sample (y = 11.185 + 311.950 - 255.785).
year2
year year year2
ENDR among twins (
0/
00
)
d.f. = ∞; P < 0.001) and twins (t = 3.829; 64 d.f.; P< 0.001). This table also shows that the smaller mean gestational age of early neonatal deaths compared with that of still-births was caused by a very high proportion of preterm deliveries (less than 37 weeks) among the former (67.8% of singletons and 82.3% of twins who died in the first week after birth).
The mean gestational age of singletons who remained alive for at least seven days after birth was significantly greater (39.5 ± 2.4 weeks) than for singleton stillbirths (34.4 ± 5.6 weeks) and early neonatal deaths (33.0 ± 5.7
weeks). This clearly reflected the fact that most of the newborns who remained alive for at least one week (81.1%) were born at term (between 37 and 42 weeks). Among the singleton stillbirths, 37.1% were born at term, whereas this proportion fell to 27.4% among singletons who died in the first week after birth. This difference was so strik-ing that no statistical test was needed to confirm it.
As in the case of singletons, the mean gestational age of twins who remained alive for at least one week af-ter birth was significantly higher (36.7 ± 3.4 weeks) when compared with twins who died in the first week after birth
Figure 5 - Best fit regression curves for the annual sex ratio distribution of all newborn singletons [y = 104.260 + 1.450 sin (year + 1.145)], of those who died in the first week [y = 129.450 - 31.596 sin (year - 0.765)] and of stillborn singletons (y = 145.886 - 165.247 + 172.948). The curves for all singletons and for those who died in the first week refer to the period from 1984 to 1996, while the curve for stillbirths refers to the period from 1988 to 1996.
year2
year
Sex ratio
Year
Figure 6 - Best fit regression curves for the annual sex ratio distribution (1984-1996) of all newborn twins (y = 87.686 + 0.572 year + 0.292 year2) and of those who died in the first week (y = 124.0 - 5.208 year + 2.448 year2).
Sex ratio
(29.5 ± 6.4 weeks). The proportion of twins born at term among the former (53.1%) was significantly greater (χ2 = 23.784; 1 d.f.; P < 0.001) than that observed among early neonatal deaths (17.7%). However, in contrast to single-tons, the proportion of twins born at term was practically the same among the stillbirths (53.3%) and newborns who remained alive for at least one week after birth (53.1%).
Table VI shows that stillbirths had a higher mean birth weight than early neonatal deaths among both singletons and twins, although among the former the difference was not striking when the comparison took into account new-borns with a low (χ2 = 4.249; 1 d.f.; P < 0.05) or very low (χ2 = 3.933; 1 d.f.; P < 0.05) birth weight. Among twins, this was only true for a low birth weight (Fisher’s exact test: P = 0.048) since the proportion of newborns with a very low birth weight among twins who died in the first week after birth (86.8%) was more than 2.5 times greater than among stillbirths (33.3%) (χ2 = 50.025; 1 d.f.; P < 0.001). The mean birth weight of singletons who remained alive for at least seven days after birth was significantly higher than that of singleton stillbirths and early neonatal deaths. Among the former, the proportion of newborns with a low (7.9%) and with very low (0.9%) birth weight was so much smaller than among stillbirths (72.4 and 43.9%) and early neonatal deaths (76.6 and 48.9%) that statistical tests were not necessary to confirm these differences (Table VI).
The mean birth weight of twins who remained alive for at least one week after birth was significantly higher than those of stillbirths and early neonatal deaths. The pro-portion of newborns with a low birth weight among the twins who remained alive (61.1%) was significantly lower than that among stillbirths (88.9%) and early neonatal deaths (98.2%) (χ2 = 8.662; 1 d.f.; P < 0.01 and χ2 = 63.170; 1 d.f.;P < 0.001, respectively). These differences were even more striking when the proportion of newborns with a very low birth weight among the twins who remained alive (9.9%) was compared with those observed among stillbirths (33.3%) and early neonatal deaths (86.8%).
The data in Tables V and VI thus point out clearly a close association between neonatal death rate and prema-turity as well as low birth weight. The higher early neona-tal death rate/stillbirth rate ratio of twins (2.9) compared to singletons (1.2) in Tables I and II was, undoubtedly, a consequence of the higher frequency of extreme prema-turity and very low birth weight among twins.
As expected, the proportions of 1-min and 5-min Apgar scores under 7 among singletons and twins who re-mained alive for at least seven days after birth were strik-ingly smaller than among early neonatal deaths (Table VII). For this reason, statistical tests to demonstrate signifi-cance of such large differences were considered super-fluous. As noted previously by Franchi-Pinto et al. (1999) in newborns who remained alive, singletons have a
sig-Table VI - Mean birth weight (MBW) in grams according to sex (M = males; F = females) and percentage of newborns with low (< 2500 g) and very low (< 1500 g) birth weight among singletons and twins.
Weight (g) Singletons Twins
Stillbirths Neonatal deaths Alive Stillbirths Neonatal deaths Alive
MBW M 1823.9 ± 979.5 1811.2 ± 927.7 3211.9 ± 526.8 1881.6 ± 618.3 1024.4 ± 325.1 2331.0 ± 615.5 (N = 414) (N = 515) (N = 750 ) (N = 19) (N = 70) (N = 711) F 1792.8 ± 957.8 1731.6 ± 944.5 3127.4 ± 477.2 1350.6 ± 597.8 1128.6 ± 535.9 2245.9 ± 610.7
(N = 333) (N = 431) (N = 765 ) (N = 8) (N = 44) (N = 728) M + F 1810.0 ± 969.4 1774.9 ± 935.7 3169.2 ± 504.0 1724.3 ± 649.6 1064.6 ± 420.0 2287.9 ± 614.3
(N = 747) (N = 946) (N = 1515) (N = 27) (N = 114) (N = 1439)
< 2500 g 72.4 76.6 7.9 88.9 98.2 61.1
< 1500 g 43.9 48.9 0.9 33.3 86.8 9.9
Table V - Mean gestational age (MGA) in weeks and percentage of preterm (< 37 weeks), term (37-42 weeks) and post-mature (≥ 42 weeks) newborns among singletons and twins.
Gestation Singletons Twins
(weeks)
Stillbirths Neonatal Alive Stillbirths Neonatal Alive
deaths deaths
MGA 34.4 ± 5.6 33.0 ± 5.7 39.5 ± 2.4 35.6 ± 5.1 29.5 ± 6.4 36.7 ± 3.4
< 37 56.3 67.8 9.4 46.7 82.3 44.9
37-42 37.1 27.4 81.1 53.3 17.7 53.1
≥ 42 6.6 4.8 9.5 - - 2.0
nificantly smaller proportion of Apgar scores under 7 (1 min and 5 min) than twins. For newborns who died in the first week, there were no significant differences between singletons and twins in the proportion of newborns with Apgar scores under 7 (Table VII). This similarity, while suggesting that almost half (44.6%) of the early neonatal deaths had 5-min Apgar scores varying from 7 to 10, also favors the hypothesis that Apgar scores ≥ 7obtained5 min after birth cannot be considered as an adequate indicator of a good clinical condition of the newborn.
ACKNOWLEDGMENTS
Research supported by CNPq. Publication supported by FAPESP.
RESUMO
Dados a respeito de 116.699 partos (1062 gemelares e 115.637 únicos) ocorridos entre 1984 e 1996 na maior maternidade de Campinas, SP, Brasil, permitiram fazer as seguintes observações: 1) a despeito da baixa porcentagem de nascimentos gemelares (0,9%), os gêmeos foram responsáveis por 10,7% dos óbitos neonatais precoces e 3,5% dos natimortos. Em relação aos recém-nascidos de parto único, a probabilidade de natimor-talidade e mornatimor-talidade neonatal precoce dos gêmeos foi, res-pectivamente, 1,9 e 6,5 vezes menor. 2) A proporção de gêmeos entre os óbitos neonatais precoces vem decrescendo, podendo essa tendência ser atribuída à melhoria da assistência pré- e peri-natal. 3) Os três primeiros dias após o nascimento constituíram o período crítico de ocorrência dos óbitos neonatais tanto dos gêmeos quanto dos recém-nascidos de parto único. 4) A mor-talidade perinatal incidiu mais freqüentemente nos pares MM, que foram seguidos pelos pares FF, e foi menor nos pares MF. 5) A taxa anual de óbitos neonatais precoces tem decrescido nos recém-nascidos de parto único e nos gêmeos, o mesmo ocorrendo com a taxa anual de natimortos de parto único, mas o decréscimo foi mais acentuado nos recém-nascidos do sexo feminino. 6) Du-rante o período analisado a razão de sexo esteve praticamente estável nos recém-nascidos de parto único vivos, mostrou variação cíclica nos recém-nascidos que foram a óbito na primeira semana e revelou tendência crescente nos natimortos. A razão de sexo dos gêmeos que foram a óbito na primeira semana e daqueles
que sobreviveram também mostrou crescimento acentuado no período entre 1984 e 1996. 7) Nos recém-nascidos de parto único a idade gestacional média foi maior naqueles que sobreviveram, os quais foram seguidos pelos natimortos, sendo menor nos que foram a óbito na primeira semana. Nos gêmeos a idade gestacional média dos sobreviventes foi maior do que a dos falecidos na primeira semana, mas não diferiu daquela apresentada pelos natimortos. 8) O peso médio de todos os recém-nascidos foi maior entre os sobreviventes, que foram seguidos pelos natimortos, e menor naqueles que foram a óbito na primeira semana. 9) Os índices de Apgar ≥ 7 obtidos cinco minutos após o nascimento não podem ser considerados como um indicador de boas condições clínicas do recém-nascido, porque quase a metade dos óbitos neonatais precoces mostraram índices de Apgar de cinco minutos variando de 7 a 10.
REFERENCES
Alfieri, A., Gatti, I. and Alfieri, C. (1987). Weight and height growth in twins and children born in the last decade. Acta Genet. Med. Gemellol. 36: 209-211.
Apgar, V. (1953). A proposal for a new method of evaluation of the new-born infant. Anesth. Analg. 32: 260-267.
Barr, A. and Stevenson, A.C. (1961). Stillbirths and infant mortality in twins.
Ann. Hum. Genet. 25: 131-140.
Beiguelman, B., Franchi-Pinto, C. and Magna, L.A. (1997). Biological and social traits associated with twinning among Caucasoids and Negroids.
Braz. J. Genet. 20: 311-318.
Belitzky, R., Fescina, R.E. and Ucieda, F. (1978). Definiciones y termi-nologias aplicables al periodo perinatal. Recomendaciones de la Orga-nización Mundial de la Salud y modificaciones de la F.I.G.O. Publi-cación Científica del CLAP757: 136-147.
Bleker, O.P., Oosting, J. and Hemrika, D.J. (1988). On the cause of the retardation of fetal growth in multiple gestations. Acta Genet. Med. Gemellol. 37: 41-46.
Bonnelykke, B., Sogaard, J. and Nielsen, J. (1987). Seasonality in twin birth rates, Denmark, 1936-1984. J. Epidemiol. Community Health 41: 338-343.
Buckler, J.M.H. and Buckler, J.B. (1987). Growth characteristics in twins and higher order multiple births. Acta Genet. Med. Gemellol. 36: 197-208.
Chen, C.J., Wang, C.J., Yu, M.W. and Lee, T.K. (1992). Perinatal mortality and prevalence of major congenital malformations of twins in Taipei City. Acta Genet. Med. Gemellol. 41: 197-203.
Committee on Fetus and Newborn, American Academy of Pediatrics (1986). Use and abuse of the Apgar scores. Pediatrics78: 1148-1149. Doherty, J.D.H. (1988). Perinatal mortality in twins, Australia, 1973-1980: II maternal age, lethal congenital malformations and sex. Acta Genet.
Table VII - Mean 1-min and 5-min Apgar scores (MAS) and percentage of early neonatal deaths and newborns alive for at least seven days after birth (singletons and twins) who had 1-min and 5-min Apgar scores of < 7 and ≥ 7.
One-minute Apgar score Five-minute Apgar score
Score Neonatal deaths Alive Neonatal deaths Alive
Singletons Twins Singletons Twins Singletons Twins Singletons Twins
MAS 3.7 ± 2.8 3.5 ± 2.4 8.1 ± 1.4 7.4 ± 2.2 5.4 ± 3.1 6.0 ± 2.4 8.9 ± 1.0 8.9 ± 1.8
< 7 78.3 85.9 9.2 23.6 55.9 50.5 3.4 9.5
≥ 7 21.7 14.1 90.8 76.4 44.1 49.5 96.6 90.5
N 866 99 1522 1396 869 99 1519 1396
Med. Gemellol. 37: 321-329.
Fanaroff, A.A. and Martin, R.J. (1992). Neonatal-Perinatal Medicine: Diseases of the Fetus and Infant. Vol. 2, 5th ed. Mosby-Yearbook, New York.
Franchi-Pinto, C., Dal Colletto, G.M.D., Krieger, H. and Beiguelman, B. (1999). Genetic effect on Apgar score. Genet. Mol. Biol. 22: 13-16. Fraser, D., Picard, R. and Picard, E. (1991). Factors associated with
neo-natal problems in twin gestations. Acta Genet. Med. Gemellol. 40: 193-200.
Gedda, L., Brenci, G. and Gatti, I. (1981). Low birth weight in twins versus singletons: separate entities and different implications for child growth and survival. Acta Genet. Med. Gemellol. 30: 1-8.
Grothe, W. and Rüttgers, H. (1985). Twin pregnancies: an 11-year review.
Acta Genet.Med. Gemellol. 34: 49-58.
Keith, L. (1994). Mortality and morbidity among twins: recent observa-tions from the United States. Acta Genet. Med. Gemellol. 43: 25-31. Kiely, J.L. (1991). Time trends in neonatal mortality among twins and
singletons in New York City, 1968-1986. Acta Genet. Med. Gemellol. 40: 303-309.
Leroy, B., Lefort, F., Neveu, P., Risse, R.J., Trévise, P. and Jeny, R. (1982). Intrauterine growth charts for twin fetuses. Acta Genet. Med. Gemellol. 31: 199-206.
Lowe, C.R. and Record, R.G. (1951). Risk of stillbirth in twin pregnancy related to sex and maternal age. Br. J. Soc. Med. 5: 34-40.
Luke, B. (1996). Reducing fetal deaths in multiple births: optimal birth weight and gestational ages for infants of twin and multiple births.
Acta Genet. Med. Gemellol. 45: 333-348.
Lumme, R.H. and Saarikoski, S.V. (1988). Perinatal deaths in twins
preg-nancy: a 22 years review. Acta Genet. Med. Gemellol. 37: 47-54. McKeown, T. and Record, R.G. (1952). Observations on foetal growth in
multiple pregnancy in man. J. Endocrinol. 5: 387-401.
Myrianthopoulos, N.C. (1970). An epidemiologic survey of twins in a large, prospectively studied population. Am. J. Hum. Genet. 22: 611-629. Osbourne, G.K. and Patel, N.B. (1985). An assessment of perinatal
mortal-ity in twin pregnancies in Dundee. Acta Genet. Med. Gemellol. 34: 193-199.
Papiernik, E., Mussy, M.A., Vial, M. and Richard, A. (1985). A low rate of perinatal deaths for twin births. Acta Genet. Med. Gemellol. 34: 201-206. Pilotto, R.F., Magna, L.A. and Beiguelman, B. (1993). Factors influencing human birth weight in normal pregnancy: a prospective study in a Brazilian university hospital. Rev. Bras. Genet. 16: 457-469. Powers, W.F. (1973). Twin pregnancy, complications and treatment. Obstet.
Gynecol. 42: 795-808.
Rydhström, H. (1990). The effects of maternal age, parity and sex of the twins on twin perinatal mortality. A population based study. Acta Genet. Med. Gemellol. 39: 401-408.
Spellacy, W.N., Handler, A. and Ferre, C.D. (1990). A case-control study of 1253 twin pregnancies from 1982-1987 perinatal data base. Obstet. Gynecol. 75: 168-171.
Watson, P. and Campbell, D.M. (1986). Preterm deliveries in twin pregnan-cies in Oxford. Acta Genet. Med. Gemellol. 35: 193-199.
Weinberg, W. (1901). Beiträge zur Physiologie und Pathologie der Mehrlingsgeburten beim Menschen. Pflügers Arch. Ges. Physiol. 88: 346-430.