Factors associated with
arterial stiffness in children
aged 9-10 years
Fatores associados ao aumento da
rigidez arterial em crianças de 9 e
10 anos
I Programa de Pós-Graduação em Saúde
Coletiva. Instituto de Medicina Social. Universidade do Estado do Rio de Janeiro. Rio de Janeiro, RJ, Brasil
II Departamento de Ciências Fisiológicas.
Universidade Federal do Espírito Santo. Vitória, ES, Brasil
III Programa de Pós-Graduação em Saúde
Coletiva. Universidade Federal do Espírito Santo. Vitória, ES, Brasil
IV Secretaria Estadual de Saúde. Vitória, ES,
Brasil
V Departamento de Nutrição. Universidade
Federal do Espírito Santo. Vitória, ES, Brasil Correspondence:
Maria del Carmen Bisi Molina Departamento de Nutrição – UFES Av. Marechal Campos, 1468 Maruípe 29043-900 Vitória, ES, Brasil E-mail: [email protected] Received: 2/28/2014 Approved: 10/15/2014
Article avaiable from: www.scielo.br/rsp
ABSTRACT
OBJECTIVE: To analyze the factors associated with stiffness of the great arteries in prepubertal children.
METHODS: This study with convenience sample of 231 schoolchildren aged 9-10 years enrolled in public and private schools in Vitória, ES, Southeastern Brazil, in 2010-2011. Anthropometric and hemodynamic data, blood pressure, and pulse wave velocity in the carotid-femoral segment were obtained. Data on current and previous health conditions were obtained by questionnaire and notes on the child’s health card. Multiple linear regression was applied to identify the partial and total contribution of the factors in determining the pulse wave velocity values.
RESULTS:Among the students, 50.2% were female and 55.4% were 10 years
old. Among those classiied in the last tertile of pulse wave velocity, 60.0%
were overweight, with higher mean blood pressure, waist circumference, and waist-to-height ratio. Birth weight was not associated with pulse wave velocity. After multiple linear regression analysis, body mass index (BMI) and diastolic blood pressure remained in the model.
CONCLUSIONS: BMI was the most important factor in determining arterial stiffness in children aged 9-10 years.
DESCRIPTORS: Child. Pulse Wave Analysis. Blood Flow Velocity. Vascular Stiffness. Risk Factors. Overweight.
Milena Santos BatistaI
José Geraldo MillII
Taisa Sabrina Silva PereiraIII
Carolina Dadalto Rocha FernandesIV
Traditional cardiovascular risk factors and associated alterations can act for decades, even before the onset of clinical manifestations of cardiovascular events.11,22
Arterial stiffness, an important determinant of blood pressure (BP) elevation and a predictor of adverse cardiovascular events,10,17 can manifest as early as in
childhood – in children with low levels of physical activity, type 1 diabetes, or obesity.3,4,6
The stiffness of the great arteries can be determined by various methods; the most indicated is measurement of pulse wave velocity (PWV), as it is easy to obtain and has good reproducibility.24 Carotid-femoral PWV has
become the most widely used method for assessing the degree of stiffness of the great arteries.
Epidemiological studies have observed an increased incidence of hypertension in children, probably due to its association with overweight and physical inac-tivity.7,13 Considering the association between
rial stiffness and hypertension, the evaluation of arte-rial stiffness in children24 can clarify this association
at an early age. Age, sex, body mass index (BMI), and BP are important factors in determining arterial stiff-ness from childhood. Li et al8 (2004) and Donald et al4
(2010) stated that systolic BP (SBP) in childhood was
RESUMO
OBJETIVO: Analisar fatores associados à rigidez arterial dos grandes vasos arteriais em crianças pré-púberes.
MÉTODOS: Estudo com amostra de conveniência de 231 escolares de nove e 10 anos de idade matriculados em instituições públicas e privadas de Vitória, ES, 2010-2011. Foram obtidos dados antropométricos e hemodinâmicos, pressão arterial e velocidade de onda de pulso no segmento carotídeo-femoral. Dados sobre condições de saúde atuais e pregressas das crianças foram obtidas por meio de questionário e anotações no cartão de saúde da criança. Foi aplicada
regressão linear múltipla para identiicar a contribuição parcial e total dos fatores
na determinação dos valores da velocidade de onda de pulso.
RESULTADOS: Dentre os escolares, 50,2% eram meninas e 55,4% tinham 10
anos de idade. Entre as classiicadas no último tercil de velocidade de onda de pulso, 60,0% apresentavam excesso de peso, maiores médias de pressão
arterial, circunferência da cintura e relação cintura/estatura. O peso ao nascer não foi associado à velocidade de onda de pulso. Após análise de regressão linear múltipla, permaneceram no modelo as variáveis índice de massa corporal e pressão arterial diastólica.
CONCLUSÕES: Excesso de peso foi o mais importante fator na determinação da rigidez arterial de crianças.
DESCRITORES: Criança. Análise de Onda de Pulso. Velocidade do Fluxo Sanguíneo. Rigidez Vascular. Fatores de Risco. Sobrepeso.
INTRODUCTION
positively associated with arterial stiffness. Donald et al4 (2010) and Aatola et al1 (2010) observed that age
was positively associated with PWV. According to Núñez et al14 (2010), obese children had higher PWV
than their normal-weight peers. The same was observed in the study by Sakuragi et al19 (2009), where BMI and
percentage of body fat were associated with higher carotid-femoral PWV levels in children and adolescents.
In recent years, special attention has been given to the assessment of these risk factors from a life cycle perspective. This approach was based on studies that evaluated the association of birth weight and the
development of chronic diseases, conirmed by subse -quent studies in different countries. This evidence led to the development of the hypothesis of fetal origins of disease, known as the Barker hypothesis,2,15 which
proposes that exposures during critical development periods (pregnancy and early childhood) may lead to permanent metabolic and/or structural changes to ensure the survival of the fetus in adverse conditions; however, these adaptations may increase the risk of developing chronic diseases in adulthood.
middle-income countries, as few studies have assessed this relationship in children from these regions; most
studies were conducted in adults. Therefore, it is difi -cult to determine the exact moment at which the alter-ations found in the arteries were produced or whether these are typical of hypertension. Studies in children may contribute to a better understanding of this process in countries such as Brazil.
This study aimed to analyze the factors associated with stiffness of the great arteries in prepubertal children.
METHODS
This study had a convenience sample of 231 children aged 9-10 years enrolled in public and private schools in Vitória, ES, Southeastern Brazil, who had already participated in a previous study.5
The sample size was calculated to reject the null hypothesis, with type I error of 5.0%, statistical power of 90.0%, and minimum difference in PWV of 0.5 m/s between groups. Consequently, the sample needed to comprise 224 children. Families were invited to partic-ipate in the study, considering the child’s prior partici-pation in other studies. Data were collected from July 2010 to November 2011 at the Health Sciences Center of the Universidade Federal do Espírito Santo (UFES), using questionnaires and clinical examinations.
In the initial assessment, 250 children aged 9-10 years came to the Cardiovascular Research Clinic (CRC) to be examined. Of these, 19 were excluded for not undergoing the main tests involved in this study (PWV and BP). The sample consisted of 231 children, of whom 50.2% were girls and 55.4% were 10 years old.
The examinations were performed by trained researchers in a calm, quiet, and climate-controlled environment (22°C-24°C). The children made a sched-uled visit to the CRC and fasted (10h-14h) before undergoing the blood tests; their BP was measured using the oscillometric method with an automatic device (OMROM® HEM-705CP), and their PWV was
measured. The children were seated in comfortable chairs, and chair height was adjusted so that their feet
were lat on the loor. The measurements were made
on the left arm, which was supported by a movable stand that maintained the brachial artery at heart level.
Cuffs appropriately sized to it the children’s arms
were used; to choose the correct size, arm circumfer-ence was measured at the midpoint between the acro-mion and olecranon processes. The OMRON® child
cuff was used for subjects with arm circumference
16-22 cm and the OMRON® adult cuff for subjects
with arm circumference 23-33 cm. Three BP measure-ments were obtained, with a two-min interval between them. SBP, diastolic BP (DBP), and heart rate (HR) were determined by the arithmetic mean of the last
two measurements. SBP and DBP were classiied as
normal (≤ 90th percentile for age and sex),
border-line (90th-95th percentile) or high (≥ 95th percentile),
as recommended by the VI Brazilian Guidelines on Arterial Hypertension.21 Later, they were
re-cate-gorized as normal BP (< 95th percentile) or high BP
(≥ 95th percentile).
PWV was obtained after resting in the supine position
for ive minutes, and the subjects wore clothing that
allowed easy access to the right femoral and carotid pulses. A tape measure was used to measure the distance between the sternal manubrium and the femoral pulse. PWV was measured by the simultaneous capture of pulse waves in the right carotid and femoral arteries. Dedicated software (Complior; Artech Medicale, France) assessed the adequacy of pulse waves; for posi-tive cases, PWV was calculated by the ratio between the manubrium-femoral distance and the time delay between the two pulses. The PWV of every child was determined based on the mean, which was calculated automatically from 12 heartbeats at a regular HR. It was
classiied into tertiles based on the following cut-off
points: tertile 1, < 5.1 m/s; tertile 2, 5.1-5.5 m/s; and tertile 3 > 5.5 m/s.
Anthropometric data were collected as recom-mended by the World Health Organization (WHO).24
Body weight was measured on an electronic scale (Toledo®, model 2096; Brazil) with precision of
100 g. Height was measured by a portable stadiom-eter (Seca®, model 206) attached to a lat wall with
no baseboard.a BMI was calculated, and the child was classiied as normal weight or overweight according
to WHO criteria. Waist circumference (WC) was measured using an anthropometric tape (Sanny®) at
the midpoint between the lower edge of the lowest rib and the iliac crest. The waist-to-height ratio (W/H) was obtained from the ratio of the waist and height measurements. The assessment of pubertal stage was performed using the criteria proposed by Tanner23 (1962), and was reported by the children. Data on
birth conditions, eating habits, and the child’s current health, as well as the durable consumer goods avail-able at home were obtained through interviews with one of the parents or guardian.
Socioeconomic status was classiied based on owner -ship of consumer goods and education level of the head of the household, as recommended by the Brazilian Association of Research Companies, and grouped into
a World Health Organization. Indicators for assessing infant and young child feeding practices.Conclusions of consensus meeting held 6-8
three categories:A+B, C, D+E.b This variable was only
used for sample characterization.
Birth weight was recorded based on the information on the child’s health card. Approximately 30.0% of the cards did not include this data. In such cases, this was reported by the mother. Additionally, information on whether the delivery was preterm was collected.
The Kolmogorov-Smirnov test was used to assess the normality of continuous variables. Student’s t-test for independent samples and the Mann-Whitney test were used to compare the means of continuous variables with normal distribution and non-parametric variables, respectively. The Chi-squared test (X2) or Fisher’s
exact test were used to compare proportions. One-way analysis of variance (ANOVA), followed by a Tukey test, were used to compare more than two means. The Kruskal-Wallis test was used for non-parametric
vari-ables. Pearson’s and Spearman’s correlation coefi -cients were used to test the correlations of the variables, according to their distribution. A multiple linear regres-sion was used to identify the partial and total contribu-tion of the factors in determining PWV values. To be included in the linear regression model, the variables with non-normal distribution were log-transformed. The residues of linear regression were evaluated for
normality. The signiicance level was set at a < 0.05.
Statistical analyses were performed using SPSS for Windows, version 18.0.
This study was approved by the Research Ethics Committee of the Health Sciences Center of the Universidade Federal do Espírito Santo (Case 144/2010). The children’s participation was voluntary, and their families signed an informed consent form.
RESULTS
The main clinical characteristics of the participants
were stratiied according to the PWV tertile, with
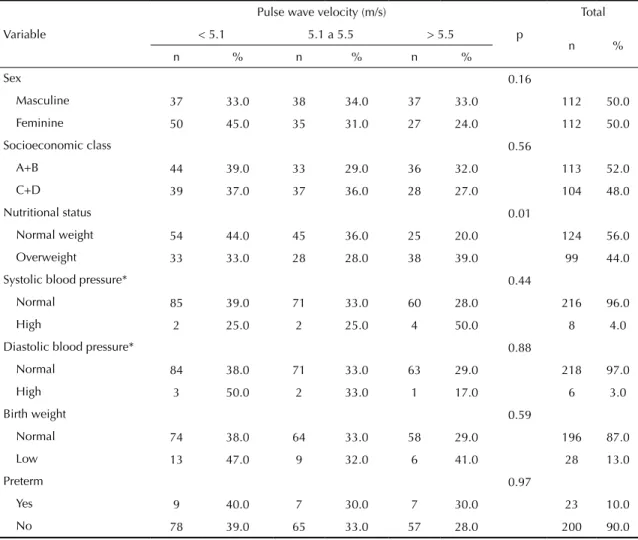
a mean of 5.3 m/s (standard deviation 0.52 m/s), minimum value of 4.1 m/s, and maximum of 7.8 m/s (Table 1). The only factor associated with PWV was
nutritional status; 39.0% of the children classiied in the
highest PWV tertile were overweight, while this ratio was 33.0% (p = 0.01) in the lower tertiles.
Height was the only variable that was not associated with PWV (Table 2). Mean SBP and DBP increased
from the irst to the third PWV tertile (p < 0.01). The
same occurred with the anthropometric variables WC, W/H, and body weight (p = 0.01; Table 2). The differ-ences between tertiles were due almost exclusively to the increases in BP and in the variables related to the
excess weight of the children in the third tertile, when
compared with the irst two.
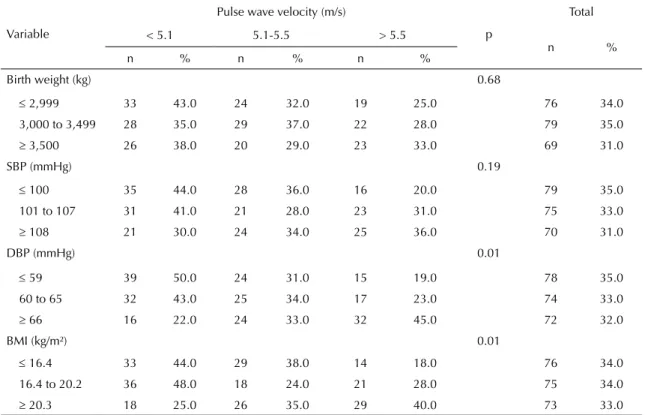
Birth weight was not associated with PWV (p = 0.68).
The higher the child’s BMI, the greater the PWV: 40.0% of the children with BMI > 20.3 kg/m² were in the highest PWV tertile (p = 0.01; Table 3).
Anthropometric variables and BP were signiicantly
correlated with PWV (Table 4). However, due to colin-earity between some of the anthropometric variables tested, only BMI and W/H were included in the multiple regression model. The other variables in the model were SBP, DBP, and sex.
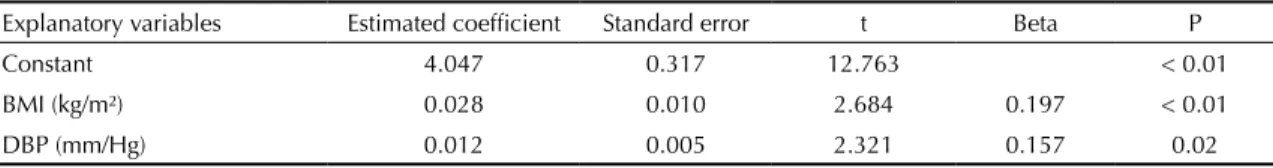
Residual analysis demonstrated homoscedasticity. The factors that explained the changes in PWV were BMI and DBP (p < 0.01; Table 5).
DISCUSSION
BMI was associated with PWV in children aged 9-10 years. Although other anthropometric variables
were also associated, only BMI remained in the inal regression model. This inding is similar to that of
Sakuragi et al19 (2009), Núñez et al14 (2010), and
Celik et al3 (2011), in which a positive association
was observed between overweight and arterial stiff-ness in children and adolescents. Although obesity is an important risk factor for cardiovascular disease, the pathophysiological mechanisms that associate it with arterial stiffness are not fully understood,18 especially
in the age group assessed in the present study.
Unlike other studies, no signiicant association was
observed between birth weight and PWV. The rela-tionship between birth weight and arterial stiffness remains controversial. Martin et al9 (2000) found a
negative correlation between birth weight and carotid artery stiffness, assessed by ultrasound. Miles et al12
(2011) found no association between arterial stiff-ness and birth weight, as assessed by carotid-femoral PWV. Conversely, in the assessment of carotid-femoral PWV in adolescents, Salvi et al20 (2012) found a
nega-tive association between low birth weight and PWV. However, birth data was obtained directly from clinical records, thus reducing the chance of recall bias.
Studies assessing arterial stiffness in children are contro-versial. This is mainly due to the divergent methodolo-gies used to measure arterial stiffness, such as different devices and arterial segments assessed. The distribution of blood components varies depending on the location of the vessel. The central arteries have a higher degree of elasticity because of high elastin/collagen ratio and
low inluence of smooth muscle tone. In contrast, the
b Associação Brasileira de Empresas de Pesquisa. Critério de classificação econômica Brasil. São Paulo; 2011 [cited 2010 Oct 15]. Available
Table 1. Distribution of sociodemographic, anthropometric, sex, blood pressure, and birth conditions variables, stratified by pulse wave velocity tertiles. Vitória, ES, Southeastern Brazil, 2010-2011.
Variable
Pulse wave velocity (m/s)
p
Total
< 5.1 5.1 a 5.5 > 5.5
n %
n % n % n %
Sex 0.16
Masculine 37 33.0 38 34.0 37 33.0 112 50.0
Feminine 50 45.0 35 31.0 27 24.0 112 50.0
Socioeconomic class 0.56
A+B 44 39.0 33 29.0 36 32.0 113 52.0
C+D 39 37.0 37 36.0 28 27.0 104 48.0
Nutritional status 0.01
Normal weight 54 44.0 45 36.0 25 20.0 124 56.0
Overweight 33 33.0 28 28.0 38 39.0 99 44.0
Systolic blood pressure* 0.44
Normal 85 39.0 71 33.0 60 28.0 216 96.0
High 2 25.0 2 25.0 4 50.0 8 4.0
Diastolic blood pressure* 0.88
Normal 84 38.0 71 33.0 63 29.0 218 97.0
High 3 50.0 2 33.0 1 17.0 6 3.0
Birth weight 0.59
Normal 74 38.0 64 33.0 58 29.0 196 87.0
Low 13 47.0 9 32.0 6 41.0 28 13.0
Preterm 0.97
Yes 9 40.0 7 30.0 7 30.0 23 10.0
No 78 39.0 65 33.0 57 28.0 200 90.0
* Fisher’s exact test.
Table 2. Means and standard deviations of the hemodynamic and anthropometric variables, stratified by pulse wave velocity tertiles. Vitória, ES, Southeastern Brazil, 2010-2011.
Variable
Pulse wave velocity tertile (m/s)
p
< 5.1 5.1 a 5.5 > 5.5
n Mean SD n Mean SD n Mean SD
SBP (mm/Hg)a 87 103 9 73 103 9 64 108c 9 < 0.01
DBP (mm/Hg)a 87 62 7 73 63 8 64 66c 7 < 0.01
Weight (kg)a 87 35.1 7.6 73 37.3 9.7 64 41.5c 11 < 0.01
Height (cm)a 87 140 7 73 141 7 64 142 7 0.18
n Median P25;P75 n Median P25;P75 n Median P25;P75
WC (cm)b 87 60.8 55.7;67.2 72 60.6 56;73.2 63 66.3c 59.1;75.6 < 0.01
W/H (cm)b 87 0.43 0.41;0.49 72 0.43 0.39;0.51 63 0.48c 0.42;0.53 < 0.01
BMI (kg/m²)b 87 17.2 15.5;19.9 73 17.6 15.4;22.1 64 20.2c 16.9;23.3 < 0.01
SD: standard deviation; SBP: systolic blood pressure; DBP: diastolic blood pressure; WC: waist circumference; W/H: waist-to-height ratio; BMI: body mass index
a ANOVA for parametric variables.
b Kruskal-Wallis test for nonparametric variables.
peripheral vessels have less elasticity, as they have a lower elastin/collagen ratio. Thus, the measurement method and the arterial segment evaluated must be considered. The results will probably not be the same if measurements are done in different segments. The values obtained in the aortic-brachial segment will
be higher than those obtained in the carotid-femoral, considering the amount of elastin in each segment.24
This study used the carotid-femoral PWV because it is considered to be the best method for assessing stiffness of the great arteries, especially the aorta.
The high frequency of overweight was probably related to the sample selection strategy. The participants had already participated in previous studies. Therefore, it is possible that parents who were more concerned with their child’s weight responded more favorably to the invitation to participate in this study. This bias, however, does not hinder the objectives of this study, which did not aim to estimate the prevalence of structural or functional altera-tions in children, but rather to associate these variables with an outcome that characterizes stiffness of the great arteries, the carotid-femoral PWV.
Another limitation of this study is its cross-sectional design, which is not suitable for inferring causal asso-ciation. Cohort studies provide the best conditions for
assessing indings.20,26 However, the measurements were checked for quality control and the appropriate methodology was used for establishing the associations found in this study.
This is one of the irst studies in Brazil to assess arterial
stiffness measured by carotid-femoral PWV in prepu-bertal children. The results of the present study can Table 3. Birth weight, blood pressure, and nutritional status, stratified by pulse wave velocity tertiles. Vitória, ES, Southeastern Brazil, 2010-2011.
Variable
Pulse wave velocity (m/s)
p
Total
< 5.1 5.1-5.5 > 5.5
n %
n % n % n %
Birth weight (kg) 0.68
≤ 2,999 33 43.0 24 32.0 19 25.0 76 34.0
3,000 to 3,499 28 35.0 29 37.0 22 28.0 79 35.0
≥ 3,500 26 38.0 20 29.0 23 33.0 69 31.0
SBP (mmHg) 0.19
≤ 100 35 44.0 28 36.0 16 20.0 79 35.0
101 to 107 31 41.0 21 28.0 23 31.0 75 33.0
≥ 108 21 30.0 24 34.0 25 36.0 70 31.0
DBP (mmHg) 0.01
≤ 59 39 50.0 24 31.0 15 19.0 78 35.0
60 to 65 32 43.0 25 34.0 17 23.0 74 33.0
≥ 66 16 22.0 24 33.0 32 45.0 72 32.0
BMI (kg/m²) 0.01
≤ 16.4 33 44.0 29 38.0 14 18.0 76 34.0
16.4 to 20.2 36 48.0 18 24.0 21 28.0 75 34.0
≥ 20.3 18 25.0 26 35.0 29 40.0 73 33.0
SBP: systolic blood pressure; DBP: diastolic blood pressure; BMI: body mass index
Table 4. Simple correlation between pulse wave velocity and anthropometric variables, birth weight, and breastfeeding duration. Vitória, ES, Southeastern Brazil, 2010-2011.
Variable Pulse wave velocity (m/s)
r p
SBPa (mmHg) 0.19 < 0.01
DBPa (mmHg) 0.22 < 0.01
WCb (cm) 0.19 < 0.01
W/Hb (cm) 0.18 < 0.01
Weighta (kg) 0.24 < 0.01
Heighta (cm) 0.08 0.23
BMIb (kg/m²) 0.20 < 0.01
Birth weighta (g) 0.08 0.24
SBP: systolic blood pressure; DBP: diastolic blood pressure; WC: waist circumference; W/H: waist-to-height ratio; BMI: body mass index
a Pearson’s correlation.
contribute to a better understanding of this subject in different locations where the lifestyle differs from that of the countries in which these parameters are usually studied. Arterial stiffness is often measured in adults, but its use in children has been previously reported. Most studies have demonstrated an association between increased PWV, age, and BP.16 In this study, BP was controlled in the linear regression adjustment to assess PWV, and the age range studied was narrow (9-10 years). Thus, it did not affect the PWV result of
in the studied population or the other indings.
Although BP was measured three times under controlled environmental conditions by a trained professional, this
measurement cannot be considered as a relection of the
BP of the assessed children. Ideally, measurements are carried out at different times. Nonetheless, children who were in puberty were excluded, thus avoiding potential hormonal effects on the outcome (PWV) and on related factors such as overweight.
Overweight was the most important factor in deter-mining arterial stiffness in this sample. Although it has not been widely studied in Brazil, the evaluation of the vascular structure and function measured by PWV
can be useful for the identiication of early vascular
involvement in children. Therefore, the contribution of this research on the discussion of children’s health
is timely, particularly regarding the identiication of
future cardiovascular problems.
Table 5. Multiple linear regression* for the dependent variable pulse wave velocity. Vitória, ES, Southeastern Brazil, 2010-2011.
Explanatory variables Estimated coefficient Standard error t Beta P
Constant 4.047 0.317 12.763 < 0.01
BMI (kg/m²) 0.028 0.010 2.684 0.197 < 0.01
DBP (mm/Hg) 0.012 0.005 2.321 0.157 0.02
BMI: body mass index; DBP: diastolic blood pressure
* Adjusted for systolic blood pressure, diastolic blood pressure, and sex.
1. Aatola H, Hutri-Kähönen N, Juonala M, Viikarj JS, Hulkkonen J, Laitinen T, et al. Lifetime risk factors and arterial pulse wave velocity in adulthood: the cardiovascular risk in young
Finns study. Hypertension. 2010;55(3):806-11.
DOI:10.1161/HYPERTENSIONAHA.109.145102
2. Barker DJP. The origins of the developmental
origins theory. J Inter Med. 2007;261(5):412-7.
DOI:10.1111/j.1365-2796.2007.01809.x
3. Celik A, Ozçetin M, Yerli Y, Damar IH, Kadı H, Koç F, et al. Increased aortic pulse wave velocity in obese
children. Turk Kardiol Dern Ars. 2011:39(7):557-62.
DOI:10.5543/tkda.2011.01694
4. Donald AE, Charakida M, Falaschetti E, Lawlor D, Halcox J, Golding J, et al. Determinants of vascular phenotype in a large childhood population: the Avon Longitudinal Study of Parents and Children
(ALSPAC). Eur Heart J. 2010:31(12):1502-10.
DOI:10.1093/eurheartj/ehq062
5. Faria CP, Nascimento L, Cade NV, Molina MCB. Prevalência de excesso de peso em crianças de 7 a 10 anos de Vitória-ES, Brasil: um estudo de base escolar.
UFES. Rev Bras Pesq Saude. 2011;13(1):31-7.
6. Haller H, Meier M. Diabetic nephropathy - current concepts in early diagnosis and treatment of diabetic microvascular
complications. Herz. 2004;29(5):496-503.
DOI:10.1007/s00059-004-2610-4
7. Iampolsky MN, Souza FIS, Sarni RS. Influência do índice de massa corporal e da circunferência
abdominal na pressão arterial sistêmica de
crianças. Rev Paulista Ped. 2010;28(2):181-7.
DOI:10.1590/S0103-05822010000200009
8. Li S, Chen W, Srinivasan SR, Berenson GS. Childhood blood pressure as a predictor of arterial stiffness in young adults: the Bogalusa heart study. Hypertension. 2004;43(3):541-6. DOI:10.1161/01HYP.0000115922.98155.23
9. Martin H, Hu J, Gennser G, Norman M. Impaired endothelial function and increased carotid stiffness in 9-year-old children with low
birthweight. Circulation. 2000;102(22):2739-44.
DOI:10.1161/01.CIR.102.22.2739
10. Martyn CN, Greenwald SE. Impaired synthesis of elastin in walls of aorta and large conduit arteries during early development as an initiating event in pathogenesis of
systemic hypertension. Lancet. 1997;350(9082):953-5.
DOI:10.1016/S0140-6736(96)10508-0
11. McGill HC, McMahan CA, Herderick EE, Malcom GT, Tracy RE, Strong JP. Origin of atherosclerosis in childhood and
adolescence. Am J ClinNutr. 2000:72(5Suppl):1307-15.
12. Miles KL, McDonnell BJ, Maki-Petaja KM, Yasmin CJR, Wilkinson IB, McEniery CM. Enigma Study investigators. The impact of birth weight on blood pressure and arterial stiffness in later life: the
enigma study. J Hypertens. 2011;29(12):2324-31.
DOI:10.1097/HJH.0b013e32834d0ca1
13. Monego ET, Jardim PCBV. Determinantes de risco para doenças cardiovasculares em
escolares. Arq Bras Cardiol. 2006;87(1):37-45.
DOI:10.1590/S0066-782x2006001400006
14. Núñez F, Martínez-Costa C, Sánchez-Zahonero J, Morata J, Chorro FJ, Brines J. Medida de la rigidez de la arteria carótida como marcador precoz de lesión vascular en ni-os y adolescentes con factores de riesgo
cardiovascular. Rev Esp Cardiol. 2010;63(11):1253-60.
DOI:10.1016/S0300-8932(10)70295-5
15. Osmond C, Barker DJP. Fetal, infant, and childhood growth are predictors of coronary heart disease, diabetes, and hypertension in adult men and women.
Environ Health Perspect. 2000;108(Suppl 3):545-53. DOI:10.1289/ehp.00108s3545
16. Pizzi OL, Brandão AA, Pozzan R, Magalhães MEC, Campana EMG, Fonseca FL, et al. Velocidade da onda de pulso, pressão arterial e adipocitocinas em adultos jovens: estudo do Rio
de Janeiro. Arq Bras Cardiol. 2013;100(1):60-6.
DOI:10.1590/S0066-782x2012005000116
17. Redington A, Sarkola EJT, Manlhiot C, Slorach C, Bradley TJ, Hui W, et al. Pressure changes evolution of the arterial structure and function from infancy to adolescence is related to anthropometric and blood pressure changes.
Arterioscler Thromb Vasc Biol. 2012;32(10):2516-24. DOI:10.1161/ATVBAHA.112.252114
18. Safar ME, Czemichov S, Blacher J. Obesity, arterial
stiffness, and cardiovascular risk. J Am Soc Nephrol.
2006;17(4):109-11.
19. Sakuragi S, Abhayaratna K, Gravenmaker KJ, O’Reilly C, Srikusalanukul W, Budge MM, et al. Influence of adiposity and physical activity on arterial stiffness in healthy children:the lifestyle o
four kids study. Hypertension. 2009;53(4):611-6.
DOI:10.1161/HYPERTENSIONAHA.108.123364
20. Salvi P, Revera M, Joly L, Reusz G, Iaia M, Benkhedda S, et al. Role of birth weigth and postnaltal growth on pulse wave velocity in
teenagers. J Adolesc Health. 2012;51(4):373-9.
DOI:10.1016/j.jadohealth.2012.01.009
21. Sociedade Brasileira de Cardiologia, Sociedade Brasileira de Hipertensão; Sociedade Brasileira de Nefrologia. VI Diretrizes brasileiras de hipertensão.
Arq Bras Cardiol. 2010;95(1Suppl 1):1-51. DOI:10.1590/S0066-782X2010001700001
22. Stary HC. Natural history and histological classification
of atherosclerotic lesions: an update. Arterioscler
Thromb Vasc Biol. 2000;20(5):1177-8.
23. Tanner JM. Growth at adolescence. 2.ed. Oxford: Blackwell Scientific; 1962.
24. Urbina EM, Williams RV, Alpert BS, Collins RT, Daniels SR, Hayman L, et al. Noninvasive assessment of subclinical atherosclerosis in children and adolescents: recommendations for standard assessment for clinical research. A scientific statement from the American Heart
Association. Hypertension. 2009;54(5):919-50.
DOI:10.1161/HYPERTENSIONAHA.109.192639
25. World Health Organization. Use and interpretation of anthropometry. Geneve; 1995. (Technical report series, 854).
26. Yu ZB, Han SP, Zhu GZ, Zhu C, Wang XJ, Cao XG, et al. Birth weight and subsequent risk of obesity: a systematic review and
meta-analysis. Obes Rev. 2011;12(7):525-42.
DOI:10.1111/j.1467-789X.2011.00867.x
Based on the master’s dissertation by Milena Santos Batista, titled: “Condições de nascimento e amamentação e saúde cardiovascular de crianças de 9 e 10 anos”, presented to the Universidade Federal do Espírito Santo in 2013.