Maternal effects on the genetic evaluation of Tabapuã beef cattle
José Elivalto Guimarães Campêlo
1, Paulo Sávio Lopes
2, Robledo de Almeida Torres
2, Luiz Otávio Campos
da Silva
3, Ricardo Frederico Euclydes
2, Cláudio Vieira de Araújo
3and Carmen Silva Pereira
21
Universidade Federal do Piauí, Departamento de Zootecnia, Teresina, PI, Brazil.
2
Universidade Federal de Viçosa, Departamento de Zootecnia, Viçosa, MG, Brazil.
3Embrapa - Gado de Corte, Campo Grande, MS, Brazil.
Abstract
The aim of this investigation was to study the influence of maternal effects on the genetic evaluation of sire production in Tabapuã beef cattle. Single and multiple trait analyses were done with adjusted animal weights at 120, 240 and 420 days of age. Antagonism was observed between additive direct and maternal genetic effects, with the maternal effect being higher until weaning. The inclusion of maternal effects in the models removed part of the additive variance only in single trait analyses and resulted in smaller means and standard deviations for the sire breeding values. The use of maternal effect associated with single or multiple traits may affect sire ranking. The contradictory results of the single and multiple trait analyses for additive direct and maternal effects indicate that caution is needed when considering recommendations about the importance of maternal effects in Tabapuã beef cattle.
Key words:additive direct effects, beef cattle, genetic parameters, growth, maternal effects.
Received: May 16, 2003; Accepted: December 16, 2003.
Introduction
Mammalian growth during the suckling period is af-fected by the offspring whose growth is measured and by the dam that provides the developmental environment. The trait measured is generally the phenotypic value of the spring and consists of at least two components, i.e., off-spring growth and a maternal effect contributed by the dam. The maternal effect is strictly environmental relative to the offspring, but phenotypic differences for the maternal ef-fect among dams are expressed in the phenotypic values of the offspring (Willham, 1972). According to Robison (1981), the importance of maternal influence on the growth of young mammals has been recognized since the earliest attempts to improve livestock production. Cundiff (1972) indicated that maternal effects are more important than di-rect gene effects during the early postnatal growth of young suckling their mothers. Later in life, the maternal influence diminishes and direct effects of the genes that influence growth assume primary importance.
The presence of maternal effects in the models used to genetic evaluation reduces the variance of direct genetic effects (Meyer, 1992). Part of this reduction is explained by
maternal genetic and maternal permanent environmental variances. Since antagonism has been observed between di-rect and maternal effects, a knowledge of the maternal in-fluence on pre- and post-weaning weights, and of the correlation between these effects, is fundamental for achieving unbiased heritability estimates. Another aspect that needs to be considered in beef cattle is the fact that the largest portion of the response to selection is directly influ-enced by the choice of sires because of their intensive use in the herd. Selection of the best sires is desirable in order to increase male performance for productive traits and to im-prove the maternal performance of females.
The aim of this study was to evaluate the importance of including maternal effects in single and multiple trait analyses of the variance component estimates of pre-weaning, weaning and post-weaning weights of Tabapuã beef cattle.
Material and Methods
The data were obtained from the body weight control program of the Tabapuã Beef Cattle Herd registered in the National Records of the breed belonging to the Brazilian Zebu Breeders Association (ABCZ) and were provided by Embrapa-Beef Cattle, in agreement with the Ministry of Agriculture. The pre-weaning, weaning and post-weaning weights adjusted at 120, 240 and 420 days of age, respec-www.sbg.org.br
Send correspondence to José Elivalto Guimarães Campêlo. Uni-versidade Federal do Piauí, Departamento de Zootecnia, 64049-550 Teresina, PI, Brazil. E-mail: [email protected].
tively, for animals born from 1975 to 1998 and raised under pasture conditions were used.
The models used in single or multiple trait analyses considered the fixed effects of contemporary groups (ani-mals of the same sex, herd, year and season of birth), the age of the cow as a covariate (linear and quadratic effects), and the random effects of animal, dam and error. The months of birth of the animals were divided into groups 1 and 2 corresponding to the dry season (April to September) and the rainy season (October to March), respectively.
The numerator relationship matrix (NRM) was ob-tained from the pedigree files of 46,296 animals. Of these, 312 were inbred, with an average inbreeding coefficient of 0.11%. The number of records and the means and standard deviations of the weights at 120, 240 and 420 days of age are shown in Table 1.
The inclusion of the maternal effects in the models was tested in single or multiple trait analyses by the likeli-hood ratio test. The statistics of the likelilikeli-hood ratio (LRij) test for sequentially reduced models (Rao, 1973) are:
LRij = - 2 loge(Lj/Li) = 2 logeLi- 2 logeLj,
where Liis the maximum likelihood for the complete model (with the maternal effect) and Lj is the maximum likelihood for the reduced model (without the maternal effect).
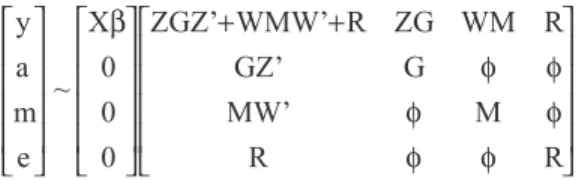
In matrix notation, the statistical model is:
Y = Xb+ Za + Wm + e,
where y is the vector n x 1 of the adjusted weight at standard ages, X is the matrix n x f of incidence for fixed effects and covariate,βis the vector f x 1 of fixed effects and covariate, a is the vector n x 1 of additive direct genetic values, m is the vector n x 1 of additive maternal genetic values, and W are the matrix n x n of incidence for direct and maternal ge-netic values, respectively, and e is the vector of residual ef-fects.
The assumptions concerning the distribution of y, a, m and e are:
y a m
e X
0 0 0
ZGZ’ WMW’ R ZG WM R
+ +
~
β
GZ’ G
MW’ M
R R
φ φ
φ φ
φ φ
where G = Aσa 2
, M = Aσm 2
and R = Iσe 2
for single trait anal-yses, G = A⊗G0, M = A⊗M0and R = I⊗R0for multiple trait analyses, A is the numerator relationship matrix, of an or-der equal to the number of individuals, and G0, M0and R0 are the matrices q x q, of direct, maternal and residual ge-netic variances, respectively, among q traits.
Estimates of covariance components and predicted breeding values were obtained using the MTDFREML (Multiple Trait Derivative - Free Restricted Maximum Likelihood) program (Boldmanet al.,1995). As a conver-gence criterion, the variance of the values of the function -2logλof simplex, was considered to be smaller than 10-9.
Total genetic effect heritability (hT 2
) of adjusted weights was estimated as (Willham, 1972):
hT2 a 2
m am
P
=σ + σ + σ
σ
0 5 2 15
2
. .
whereσP 2
is the phenotypic variance of the trait, as follows:
σP2
=σa 2
+σm 2
+σam +σe 2
Results
The values of minus twice the natural logarithm of the likelihood function (-2logeL) and the likelihood ratio test used to evaluate the significance of the maternal effect in the model for adjusted weights analyzed as single and mul-tiple traits are shown in Table 2. The inclusion of the mater-nal effects in the models was significant (p < 0.01) for all adjusted weights in all analyses.
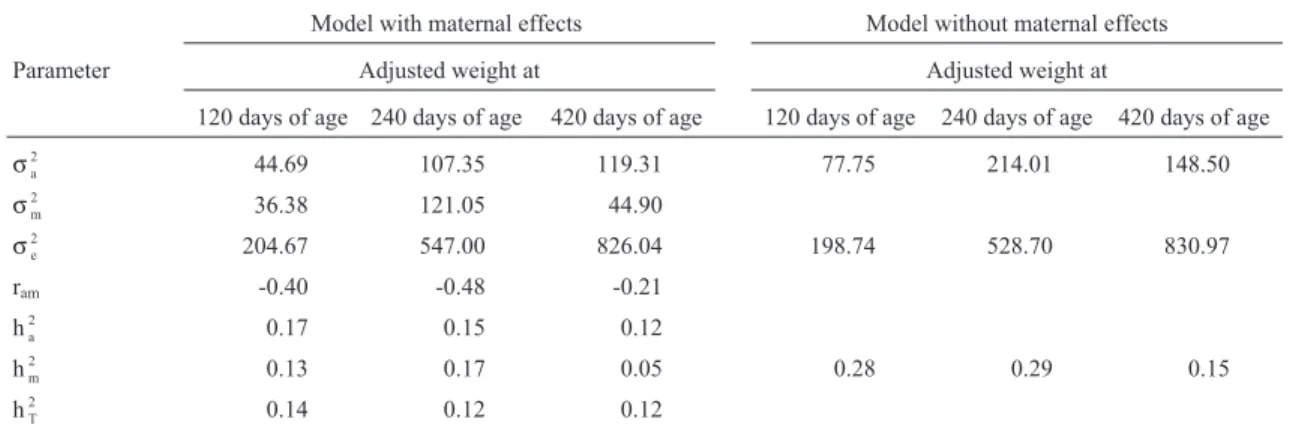
The variance components and genetic parameter esti-mates obtained by single trait analyses with and without maternal effect are shown in Table 3. Although the likeli-hood ratio test did not provide statistical evidence of a lack of maternal effects on post-weaning weight (420 days of age), the smallest variance components and the maternal
Table 1- Number of records, contemporary groups, sires, means and phenotypic standard deviations for the adjusted weights at 120, 240 and 420 days of age.
Item Adjusted weight at
120 days of age 240 days of age 420 days of age
Number of records 35,478 34,303 26,892
Contemporary group 763 751 704
Number of sires 478 478 476
Number of dams 19,077 18,370 13,831
Mean (kg) 117.96 193.69 245.36
genetic parameter estimates indicated a reduced impor-tance of this effect for weights at older ages.
In single trait analyses including the maternal effect, the heritability estimates of direct effects were small (0.17, 0.15, and 0.12 for adjusted weights at 120, 240 and 420 days, respectively). Without maternal effect, these values were 0.28, 0.29 and 0.15, respectively. However, the total heritability estimates were 0.14, 0.12 and 0.12 for adjusted weights at 120, 240 and 420 days of age, respectively.
The variance components and genetic parameter esti-mates obtained by multiple trait analyses for adjusted weights at different ages, with and without the maternal ef-fect, are shown in Table 4. For the adjusted weight at 420 days of age, with maternal effect, a difficulty was observed in approaching the convergence at the predetermined sim-plex variance level, probably because of the reduced size of the data set.
Multiple trait analyses with adjusted weights at dif-ferent ages showed that the heritabilities of direct genetic effects were not strongly affected by the maternal effects, with values of 0.20 and 0.22 being obtained for adjusted weight at 420 days of age with and without maternal effect, respectively. These values were considered to be relatively low. The maternal heritability estimates were also low
Table 2- Values of minus twice the natural logarithm of the likelihood
function (-2 logeL) and the likelihood ratio (LRij) test for the adjusted
weights at 120, 240 and 420 days of age.
Adjusted weight at
-2 logeL LRij
With maternal effect
Without maternal effect
Single trait analyses
120 days of age 229,742.67 229,967.65 224.9**
240 days of age 255,041.23 255,375.60 334.4**
420 days of age 207,966.04 207,997.53 31.5**
Multiple trait analyses1
120 days of age 456,913.89 457,080.19 166.89**
240 days of age 412,399.68 412,531.23 131.55**
420 days of age 430,152.06 430,263.49 111.43**
1
Multiple trait analyses using the combinations of the adjusted weight at 120 days of age with the adjusted weights at 240 and 420 days of age.**p < 0.01.
Table 3- Estimates of additive direct (σ
a 2
), maternal (σm 2
) and residual (σe 2
) variances, direct maternal genetic correlations (ram), and direct (ha 2
), maternal (hm
2) and total (h T
2) heritabilities obtained by single trait analyses.
Model with maternal effects Model without maternal effects
Parameter Adjusted weight at Adjusted weight at
120 days of age 240 days of age 420 days of age 120 days of age 240 days of age 420 days of age
σa
2 44.69 107.35 119.31 77.75 214.01 148.50
σm 2
36.38 121.05 44.90
σe 2
204.67 547.00 826.04 198.74 528.70 830.97
ram -0.40 -0.48 -0.21
ha 2
0.17 0.15 0.12
hm
2 0.13 0.17 0.05 0.28 0.29 0.15
hT 2
0.14 0.12 0.12
Table 4- Estimates of additive direct (σ
a 2
), maternal (σm 2
) and residual(σe 2
) variances, direct maternal genetic correlations (ram) and direct (ha 2
), maternal (hm
2
) and total (hT 2
) heritabilities obtained by multiple trait analyses1.
Model with maternal effect Model without maternal effect
Parameter Adjusted weight at Adjusted weight at
120 days of age 240 days of age 420 days of age2 120 days of age 240 days of age 420 days of age
σa 2
92.53 219.36 222.64 84.20 229.73 196.49
σm
2 15.59 57.26 12.63 810.72
σe 2
186.23 509.91 808.53 194.37 521.91
ram -0.40 -0.40 -0.37
ha 2
0.33 0.29 0.22 0.30 0.31 0.20
hm 2
0.06 0.08 0.01
hT
2 0.28 0.25 0.21
1
(0.06, 0.08 and 0.01 for the adjusted weights at 120, 240 and 420 days of age, respectively).
Sire breeding values (mean ± SD) for adjusted weights at 120, 240 and 420 days of age obtained by single trait analyses, with or without maternal effects, and multi-ple trait analyses with adjusted weights at different ages, with maternal effects, are shown in Table 5. When single trait analyses were used, the model without maternal effect gave higher mean sire breeding values because of the higher estimates for the additive direct variances observed with this model.
Discussion
Pre-weaning and weaning weights were similar to those observed for the Nellore breed by Mercadante and Lôbo (1997), Ferreira (1999), Ferraz-Filhoet al.(2000) and Mercadanteet al.(2000), who reported the importance of maternal effects on beef cattle, mainly during the pre-weaning phase.
When the parameters obtained in the models with and without maternal effects were compared (Table 3), the sin-gle trait model (without maternal effect) appeared to over-estimate the additive direct variance and, consequently, the potential response to selection, ignoring the negative covariance between the direct and maternal additive ge-netic effects. Similar results were reported by Mercadante and Lôbo (1997), Ferreira (1999), Scarpati and Lôbo (1999) and Sousaet al.(1999). The maternal contribution to the variance of adjusted weights in the single trait analy-ses was similar to the direct contribution at 120 and 240 days of age, but was much lower for the adjusted weight at 420 days of age, as also reported by Sousaet al.(1999).
The lowest additive genetic values observed in the analyses with maternal effects agreed with those reported by Notteret al.(1992), who stated that the estimates of ad-ditive direct parameters decrease when maternal effects are included in the model. The lower heritability observed for the adjusted weight at 420 days of age could be attributed to the selection applied to previous weights. Values of small
magnitude for these parameters were reported by Ferreira (1999) for the Nellore breed, for a much smaller data set. According to Willham (1972), for traits subject to maternal influence, total heritability (h2T) could become the main de-terminant of response to selection.
The direct heritability values obtained by multiple trait analyses (Table 4) for the adjusted weights at 120 and 240 days of age were close to those observed in single trait analyses without maternal effects (Table 3). In this case, there was no overestimation of additive direct variance, as indicated by the results of the single trait analyses.
Multiple trait analyses showed that the Tabapuã breed has additive genetic variability for growth traits, indicating that the breed has a genetic potential for the response to se-lection. However, in an analysis of data obtained for the Tabapuã breed, Ferraz Filho et al. (2000) found direct heritabilities of 0.16, 0.17 and 0.13 for adjusted weights at 205, 365 and 550 days of age, indicating that the genetic progress in these traits by selection may not be high.
Besides the possible selection effects, the lowest di-rect heritabilities for adjusted weight at 420 days of age ob-served in multiple trait analyses may also be a consequence of post-weaning compensatory growth, which most of the time is a result of environmental stress affecting the dams before weaning and results in lower milk production. Thus, the calf is forced to start feeding on pasture earlier, which reduces the stress during weaning and compensates for the reduced growth during the pre-weaning period.
The maternal heritability estimates obtained by multi-ple trait analyses were lower than those obtained by single trait analyses, indicating inconsistent results for maternal effects obtained by the two types of analyses. The low rele-vance of maternal components in multiple trait analyses was confirmed despite the expressive correlations between the direct and maternal additive effects, thus suggesting that field data limit the quality of maternal effect estimates, as pointed out by Sousaet al.(1999). This finding is proba-bly reflects the small number of calves per cow and the fact that cows had all their productions in a single herd. How-ever, the lack of consistency between the results of the
sin-Table 5- Means and standard deviations of the breeding values of sires for the adjusted weights at 120, 240 and 420 days of age obtained by single trait
analyses in the model with and without maternal effects, and multiple trait analyses for adjusted weights at different ages with maternal effects in the model.
Analysis Breeding value for adjusted weight at
120 days of age 240 days of age 420 days of age
Mean Standard deviation Mean Standard deviation Mean Standard deviation
Single trait
Without maternal effect 1.353 5.974 2.264 9.567 2.163 8.750
With maternal effect 0.639 4.914 1.099 7.604 1.684 7.899
Multiple trait
With maternal effect1 1.727 6.223 2.787 9.835 3.180 10.062
1
gle and multiple trait analyses raises doubts about the perspective of obtaining genetic progress in the mothering ability of Tabapuã cows by selection.
The antagonism between direct and maternal additive effects was well characterized by the correlations between these effects for the single trait (r = -0.40 and -0.48, respec-tively, for pre-weaning and weaning weights) (Table 3) and multiple trait analyses for the adjusted weights at 120 and 240 days of age (r = -0.40 for both weights) (Table 4). Ac-cording to Robison (1981), the negative correlation be-tween the direct and maternal additive effects and the high magnitude of the values may reduce the efficiency of prog-eny tests.
Specifically for body weight at 240 days of age using single trait analyses (Table 3), the negative correlation indi-cated a higher maternal effect than direct heritability. This result indicates that single trait analysis was able to detect the response of the animals to weaning management, which generally occurs at this age. A similar finding was also re-ported by Sakaguti (2000), who analyzed data for the Tabapuã breed using random regression models.
When single trait analyses were used, the model with-out maternal effect gave higher sire breeding values (mean ± SD) because of the higher estimates of additive direct variances. Again, the presence of maternal effects tended to remove part of the additive direct variance, as indicated by Notter et al. (1992) and Meyer (1992). The higher sire breeding values (mean ± SD) obtained with multiple trait analyses when compared to those obtained by single trait analyses agreed with data reported by Freitas (2000), who observed that the estimation method and the use of single or multiple trait analyses were the main causes of changes in the heritability estimates.
Conclusions
Direct heritability and the response to selection are overestimated in single trait analyses when maternal effects are not considered. The higher heritability estimates ob-tained using multiple trait analyses demonstrated that the additive genetic component was recovered in this type of analysis because of the increase in the amount of informa-tion and inclusion of the genetic correlainforma-tion between traits.
Acknowledgments
We would like to thank the Embrapa Beef Cattle -Brazilian Agricultural Research Corporation for providing the data for this study.
References
Boldman KG, Kriese LA, Van Vleck LD, Van Tassel CP and Kachman SD (1995) A Manual for Use of MTDFREML. A Set of Programs to Obtain Estimates of Variances and Cova-riances (DRAFT). U.S. Department of Agriculture, Agricul-ture Research Service, Lincoln, NE, 120 pp.
Cundiff L (1972) The role of maternal effects in animal breeding: VII - Comparative aspects of maternal effects. J Anim Sci 35:1335-1337.
Ferraz-Filho PB, Ramos AA, Silva LOC, Souza JC, Alencar MM and Diniz FCP (2000) Herdabilidades e correlações genéti-cas para característigenéti-cas de crescimento de animais da raça Tabapuã. Anas da Reunião Anual da Sociedade Brasileira de Zootecnia,Viçosa, Minas Gerais, Brazil, p 232.
Ferreira VCP (1999) Interação genótipo - Ambiente de algumas características produtivas em gado de corte no Brasil. MSc dissertation, Universidade Federal de Minas Gerais, Belo Horizonte.
Freitas AR de (2000) Avaliação de procedimentos na estimação de parâmetros genéticos em bovinos de corte. Rev Bras Zootec 29:94-102.
Mercadante MEZ and Lôbo RB (1997) Estimativas de (co)variân-cias e parâmetros genéticos dos efeitos direto e materno de características de crescimento de fêmeas de um rebanho nelore. Rev Bras Zootec 26:1124-1133.
Mercadante MEZ, Lôbo RB and Oliveira HN (2000) Estimativas de (co)variâncias entre características de reprodução e de crescimento em fêmeas de um rebanho nelore. Rev Bras Zootec 29:997-1004.
Meyer K (1992) Variance components due to direct and maternal effects for growth traits of Australian beef cattle. Livest Prod Sci 31:179-192.
Notter DR, Tier B and Thrift FA (1992) Sire x herd interaction for weaning weight in beef cattle. J Anim Sci 70:2359-2365. Rao CR (1973) Linear Statistical Inference and its Applications.
2nd edition. John Wiley & Sons, New York, 522 pp. Robison OW (1981) The influence of maternal effects on the
effi-ciency of selection: A review. Livest Prod Sci 8:121-137. Sakaguti ES (2000) Funções de covariâncias e modelos de
regres-são aleatória na avaliação genética do crescimento de bovi-nos jovens da raça tabapuã. PhD Thesis, Universidade Federal de Viçosa, Viçosa.
Scarpati MTV and Lôbo RB (1999) Modelos animais alternativos para estimação de componentes de (co)variâncias e de parâ-metros genéticos e fenotípicos do peso aos nascer na raça nelore. Rev Bras Zootec 28:512-518.
Sousa WH, Pereira CS, Bergmann JAG and Silva FLR (1999) Estimativas de componentes de (co)variância e herdabili-dade direta e materna de pesos corporais em ovinos da raça Santa Inês. Rev Bras Zootec 28:1252-1262.
Willham RL (1972) The role of maternal effects in animal breed-ing: III - Biometrical aspects of maternal effects in animals. J Anim Sci 35:1288-1293.