International Journal of Engineering and Technology Innovation, vol. 5, no. 3, 2015, pp. 156-164
Detecting Fraudsters in Online Auction Using Variations of Neighbor
Diversity
Laksamee Khomnotai
1,3,*, Jun-Lin Lin
1,21
Department of Information Management, Yuan Ze University, Taoyuan, Taiwan, ROC.
2
Innovation Center for Big Data and Digital Convergence, Yuan Ze University, Taoyuan, Taiwan, ROC.
3
Faculty of Management Science, Nakhon Ratchasima Rajabhat University, Nakhon Ratchasima, Thailand.
Received 13 March 2015; received in revised form 24 June 2015; accepted 01 July 2015
Abstract
Inflated reputation fraud is a serious problem in online auction. Recent work suggested that neighbor diversity
is an effective feature for discerning fraudsters from normal users. However, there exist many different methods to
quantify diversity in the literature. This raises the problem of finding the most suitable method to calculate neighbor
diversity for detecting fraudsters. We collect four different methods to quantify diversity, and apply them to calculate
neighbor diversity. We then use these various neighbor diversities for fraudster detection. Experimental results on a
real-world dataset demonstrate that, although these diversities were calculated differently, their performances on
fraudster detection are similar. This finding reflects the robustness of neighbor diversity, regardless of how the
diversity is calculated.
Keyword: online auction, fraudster detection, neighbor diversity, entropy
1.
Introduction
Online auction websites have gained increasing popularity for the past few years. This lucrative business opportunity has
drawn both the legitimate sellers to conduct their business online and the deceitful users to engage in fraudulent transactions.
Therefore, online auction websites often provide a recommendation system or a reputation system to assist their users to
distinguish legitimate sellers from fraudsters. The reputation system requests the buyer and the seller of a transaction to give
each other a rating after their transaction is committed. Then, the reputation system calculates a reputation score of each user
based on all the ratings the user received in his/her previous transactions. Intuitively, users with higher reputation scores are
more trustworthy, and consequently are more likely to attract sales [1].
Because the reputation score of a user depends on all the ratings the user received in the past, a legitimate user requires
time and efforts to accumulate good ratings from other users. In contrast, a fraudster often commits the so-called “inflated
reputation fraud” [2] to accumulate good ratings quickly, and cheats the reputation system into giving him/her a high reputation score. The inflated reputation fraud is often achieved by a collusive group of users who conduct fake transactions
within the group and provide good ratings to each other. Since online auction users rely on the reputation score to evaluate the
trustworthiness of other users, detecting the inflated reputation fraud has become a key task for online auction websites.
In the literature, many methods have been proposed to detect fraudsters with inflated reputation in online auctions. Some
of them adopted the concept of network graph to detect fraudsters who rely on their collaborators to boost up their reputations
*Corresponding author. E-mail address: [email protected]
[2-6]. With this concept, social network analysis (SNA) has been found as an effective tool to detect fraudsters and their
cohesive groups [2, 5, 6]. In our recent work [7], we proposed the concept of neighbor diversity to detect inflated reputation
fraud. The neighbor diversity of a user quantifies the diversity of all traders that have transactions with the user. We showed
that the neighbor diversity on the number of received ratings outperformed previous works that use k-core and/or center weight [2, 5, 6].
In [7], Shannon entropy [8] was adopted to quantify the neighbor diversity. However, different ways to define and
calculate diversity exist in the literature. This motivates the idea of using various diversity definitions to calculate neighbor
diversity for fraudster detection. Specifically, we adopt the four different definitions of diversity from [9] to calculate the
neighbor diversity. Our experimental results show, although these diversities are calculated differently, their performances on
fraudster detection are similar. This finding reflects the robustness of neighbor diversity, regardless of how the diversity is
calculated.
The remaining of this paper is as follows. Section 2 reviews previous works on fraudster detection. Section 3 applies
various definitions of diversity to calculate neighbor diversity. Section 4 describes the data collection process. Section 5
presents the experimental settings and discusses the results. Finally, Section 6 concludes this paper.
2.
Related Work
Detecting fraudsters with inflated reputation is a critical issue for online auction websites. Many methods have been
presented in the literature. Some earlier approaches used the properties derived directly from the transaction history. For
example, [10] applied the following user-level features to construct a classifier to detect fraudsters: median and standard
deviation of the prices of items bought/sold within different periods of time, and the ratio between the number of items bought
and the number of transactions. Later, this approach was improved in [3] by incorporating network-level features. The resulted
method constructed a Markov Random Field (MRF) model from past transactions among all users, then applied the results of
the user-level features to instantiate the observed values of the nodes in the MRF model, and finally used the brief propagation
algorithm to compute the probability of being a fraudster for each node. This method was simplified in [4] by initializing the
observed values of the nodes in the MRF model to a constant. Later, the belief propagation algorithm in these approaches [3, 4]
were substituted with the loopy belief propagation algorithm [11].
In [12], both the transaction-related features (i.e., frequency, price, comment and connectedness in the transaction
network) and user-level features (i.e., age and reputation) were applied to investigate the inflated reputation fraud, where a
logistic regression model was built to estimate the likelihood of collusion. Instead of limiting to a small set of features, [13]
used a wrapper approach to select a subset of suitable features from a large candidate feature pool to build a classifier for
fraudster detection.
SNA has gained popularity for developing fraudster detection approaches over the past few years [14-17]. Because the
fraudsters rely on their collusive groups to boost up their reputation by committing fake transactions among themselves, the
cohesive relationship among them must appear in their transaction network, where a node and an edge in the transaction
network represent a user and a transaction, respectively. Common notions of cohesiveness in SNA include component, clique,
k-core, etc. Among them, k-core was found to be the most effective for fraudster detection because fraudsters often occur in
k-core subgroups with k ≥ 2 [2, 6]. Let G = (V, E) denote the graph for the social network, where V is the set of nodes and E is the set of edges. A subgraph H = (W, E/W) induced by the set WV is a k-core if the degree of v is no less than k for every v
The problem of using k-core alone for detecting fraudsters is low precision. Other features such as core/periphery ratio [2], center weight [5, 20], n-clique, k-plex, degree and normalized betweenness [6] were used to resolve this problem. However, they reduce the recall.
The concept of diversity has been widely used in many domains, e.g., ecology [21-24] and portfolio management [9, 25,
26]. Recently, the concept of neighbor diversity was developed to improve both precision and recall for fraudster detection [7].
As previously mentioned, fraudsters mostly do businesses with their collaborators to boost up their reputation. Consequently,
their collaborators may exhibit similar characteristics, and consequently reduce the neighbor diversity of a fraudster’s
neighbors on those characteristics. Experimental results shows that the neighbor diversity on the number of received ratings
and on the number of cancelled transactions are effective on discerning fraudsters from normal users [7].
3.
Variants of Neighbor Diversity
3.1.Original Form
To calculate neighbor diversity, we must first choose an attribute (denoted as attr). In [7], the number of received ratings or the number of cancelled transactions, is suggested to be the selected attribute. Then, the users are divided into multiples
groups based on the selected attribute. Specifically, if the value of the selected attribute of a user is between 0 and 50, then we
place the user in the first group; if the value of the selected attribute of a user is between 5 × �− and 5 × �− , then we
place the user in the i-th group where i >1. Let x denote a user, pi(x) denote the proportion of x’s neighbors in the i-th group, and n denote the total number of classes. Then, the following constraints must hold.
≤ � � ≤ , � � = � (1)
∑ � �
�= = (2)
Finally, the neighbor diversity of a user on the attribute attris calculated as the group distribution of the user’s neighbors
using Shannon entropy [8] as follows:
�� � = − ∑
� � � �
�=
(3)
In the literature, Shannon entropy has been applied to calculate Shannon’s diversity index. Please refer to [27] for how
Shannon’s entropy is used to study diversity theoretically.
3.2.Variants
The notion of diversity is widely used in many different areas. For example, in portfolio management, diversity is used to
avoid overly concentrated portfolios. Various diversity constraints were proposed, such as weight upper/lower bound
constraint [28], Lp-norm constraint [29] and entropy constraint [26]. Lin [9] proposed a canonical form of these diversity constraints such that the value of diversity is restricted to the same range for all these different definitions of diversity. Instead
of using Shannon entropy to quantify diversity as did in Section 3.1, we can also adopt these canonical forms for calculating
neighbor diversity as described next. For problems related to various diversities, please refer to [26, 28-30].
(i.e., � � ) are known. The max weight neighbor diversity on attr of x, denoted as ��� � , is the maximum of all � � for i=1 to n, as shown below.
��� � =�= �� � � (4)
The min weight neighbor diversity on attr of x, denoted as ��� � , is calculated using the minimum of all � � for
i=1 to n, as shown below.
��� � = + − �= � � � (5)
The Canonical Lp-norm neighbor diversity on attr of x, denoted as �� � , is similar to the Lp-norm except the outer exponent is
− instead of , as shown below.
�� � = (∑ |
� � |
�= )
−
(6)
For the value of pow, the cases of pow = 2 and 3 are commonly used [9]. Hence, we consider only �� � and �� � in this study.
The canonical Shannon entropy neighbor diversity on attr of x, denoted as ��� � , is the reciprocal of the natural exponential function of Shannon entropy, as shown below.
��� � = −������ = ∑��= � � � (7)
Notably, as proved in [9], the ranges of the neighbor diversity defined in equations (4) to (6) are all the same, i.e., [ ,1].
In Eq.(7), we use log2 instead of the natural logarithm such that��� (x) can be easily calculated from�� � . For a
theoretical comparison of these diversity equations, please refer to [9].
4.
Data Collection and Dataset Preparation
In the study, we collected a dataset from Ruten (www.ruten.com.tw), which is one of the largest online auction websites
in Taiwan [31]. Similar to previous works [5-7], the dataset is grown from a list of suspended users, and then conducted a
level-wise expansion to include more users. The main reason of choosing Ruten in this study is that Ruten regularly releases a
list of suspended users and their reasons of suspension. Notably, a suspended user is not necessarily a fraudster. For example,
a user who is suspended by Ruten due to selling cigarettes or alcohol, is not considered as a fraudster in this study. We collected
9,168 suspended users from Ruten during July 2013, manually checked their reasons of suspension to look for fraudsters, and
finally, identified 932 out of the 9,168 users as fraudsters. However, the status of one of the 932 users was changed back to
normal during October 2013. Therefore, these 932 users, denoted as L1 users, consist of 931 fraudsters and 1 non-fraudster.
Then, we extended from the L1 users to find more users by collecting all users who have given a rating to or received a
rating from any L1 user. In this step, 3,475 new users, denoted as L2 users, were collected, and among them, 149 accounts were
classified as fraudsters. Similarly, we further extended from L2 users to find more users by collecting all users who have given
while collecting the L1, L2 and L3 users, we also stored the number of received ratings and the number of cancelled transactions
for each user.
In order to calculate the SNA-related features (e.g., k-core and center weight) for all users, a social network of all L1 , L2
and L3 users was built, where each node represents a user and each link represents a rating from one user to another user. To
simplify our social network, duplicate links are removed. The resulting social network contains 237,576 (=932 + 3,475 +
233,169) nodes and 348,259 links. Notably, the ratings that occurred after 31 July 2013 were not included in the social
network.
After the social network was constructed, we calculated k-core and center weight for each node in the social network, as presented in Section 2. Finally, the neighbor diversity for each L1 or L2 user is calculated, as described in Section 3. Notably,
the L3 users are only used to provide a complete view of the L2accounts’ neighbors. Thus, the final dataset contains only the L1
and L2 users, where 1,080 (= 931+149) are fraudsters and 3,327 (= 1 + 3,475 - 149) are non-fraudsters.
For each user in the dataset, the following attributes are available: the number of received ratings, the number of
cancelled transactions, k-core, center weight, neighbor diversity (i.e., �� ) and its variants (i.e., ��� , ��� , �� , �� , and ��� ). The same dataset without the variants of neighbor diversity was also used in [7]. For the selected attribute attr in neighbor diversity and its variants, we use the number of received ratings and the number of cancelled transactions because
they achieved the best performance in [7]. The resulting attributes are denoted as � , � � , � � , � , � and �� for various
types of neighbor diversity on the number of received ratings, and as ��, ��� , ��� , ��, ��, and ��� for various types of
neighbor diversity on the number of cancelled transactions.
5.
Experimental Results
Because previous works suggest using k-core and center weight (CW for short) for fraudster detection [5], in the experimental study, we used k-core, CW and one of the various types of neighbor diversity to build a classifier and compared their performance. Three classification algorithms (J48 decision tree, Neural Networks (NN), and Support Vector Machine
(SVM)) from Weka [32] were used to perform 10-fold cross-validation, and the results are shown in Tables 1 to 6.
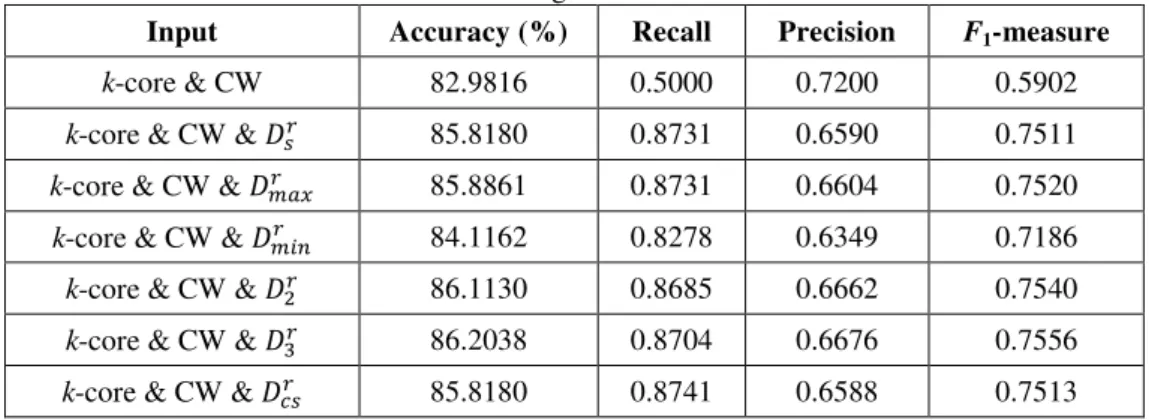
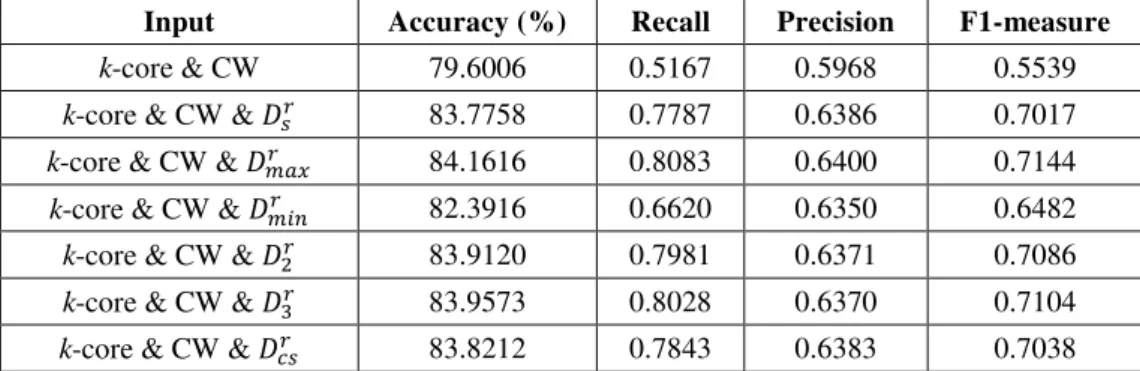
Tables 1, 2 and 3 show the results of using various types of neighbor diversity on the number of received ratings, where
the best result of each classification algorithm is shown in bold. Notably, we also show the results of using only k-core and CW in these tables to reflect the impact of adding neighbor diversity. With the addition of neighbor diversity, accuracy, recall and
F1-measure are all improved, although the precision is reduced. Overall, the performance of adding any neighbor diversity is
similar, although the performance of adding � � or � � sometimes achieves a small recall (shown in italic in Tables 1, 2,
and 3) when using different classification algorithms.
Table 1 J48 Performance of using k-core and CW with or without Dr
Input Accuracy (%) Recall Precision F1-measure
k-core & CW 82.9816 0.5000 0.7200 0.5902
k-core & CW & � 85.8180 0.8731 0.6590 0.7511
k-core & CW & � � 85.8861 0.8731 0.6604 0.7520
k-core & CW & � � 84.1162 0.8278 0.6349 0.7186
k-core & CW & � 86.1130 0.8685 0.6662 0.7540
k-core & CW & � 86.2038 0.8704 0.6676 0.7556
Table 2 Neural Network performance of using k-core and CW with or without Dr
Input Accuracy (%) Recall Precision F1-measure
k-core & CW 79.6006 0.5167 0.5968 0.5539
k-core & CW & � 83.7758 0.7787 0.6386 0.7017
k-core & CW & � � 84.1616 0.8083 0.6400 0.7144
k-core & CW & � � 82.3916 0.6620 0.6350 0.6482
k-core & CW & � 83.9120 0.7981 0.6371 0.7086
k-core & CW & � 83.9573 0.8028 0.6370 0.7104
k-core & CW & �� 83.8212 0.7843 0.6383 0.7038
Table 3 Support Vector Machine performance of using k-core and CW with or without Dr
Input Accuracy (%) Recall Precision F1-measure
k-core & CW 82.9362 0.4917 0.7234 0.5855
k-core & CW & � 84.4112 0.7685 0.6551 0.7073
k-core & CW & � � 83.0043 0.6835 0.6428 0.6625
k-core & CW & � � 83.4581 0.7630 0.6353 0.6933
k-core & CW & � 83.2539 0.7370 0.6368 0.6833
k-core & CW & � 83.2993 0.7398 0.6372 0.6847
k-core & CW & �� 83.0951 0.7426 0.6320 0.6828
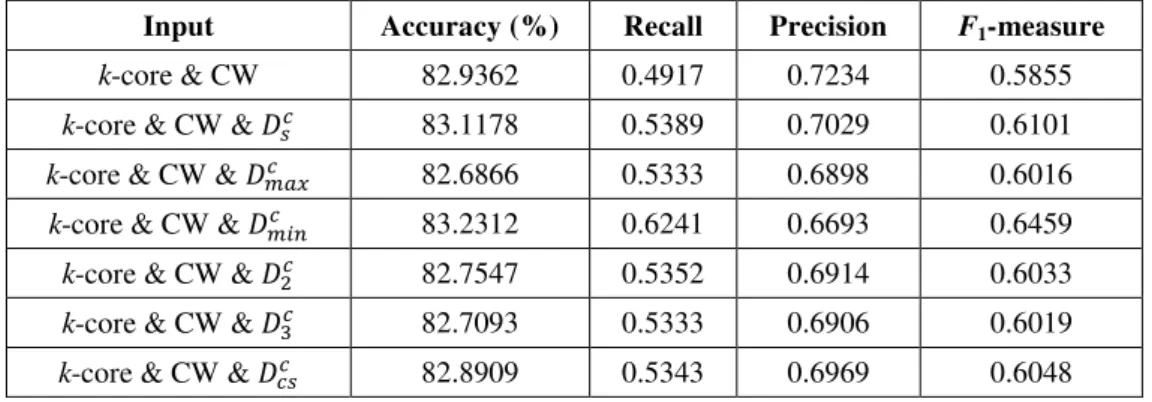
Tables 4, 5 and 6 show the results of using various types of neighbor diversity on the number of cancelled transactions.
All types of neighbor diversity achieved similar results, and the choice of classification algorithms play a crucial role on their
performance. For example, Table 4 shows that the J48 performance is similar in precision with or without using the neighbor
diversity on the number of cancelled transactions, and achieves better recall with any neighbor diversity (i.e., comparing row 1
against rows 2 to 7 in Table 4). SVM also has similar results (see Table 6). With neural network (see Table 5), the addition of
any neighbor diversity greatly improves the recall but only slightly reduces the precision.
Table 4 J48 Performance of using k-core and CW with or without Dc
Input Accuracy (%) Recall Precision F1-measure
k-core & CW 82.9816 0.5000 0.7200 0.5902
k-core & CW & �� 84.0708 0.5870 0.7124 0.6437
k-core & CW & ��� 84.0481 0.5861 0.7120 0.6430
k-core & CW & ��� 84.0254 0.5907 0.7089 0.6444
k-core & CW & �� 84.0481 0.5861 0.7120 0.6430
k-core & CW & �� 84.0481 0.5861 0.7120 0.6430
k-core & CW & ��� 83.9800 0.5861 0.7096 0.6420
Table 5 Neural Network performance of using k-core and CW with or without Dc
Input Accuracy (%) Recall Precision F1-measure
k-core & CW 79.6006 0.5167 0.5968 0.5539
k-core & CW & �� 81.5975 0.8750 0.5830 0.6997
k-core & CW & ��� 81.8698 0.8815 0.5866 0.7044
k-core & CW & ��� 82.1194 0.9130 0.5869 0.7145
k-core & CW & �� 81.8698 0.8833 0.5864 0.7048
k-core & CW & �� 81.8698 0.8815 0.5866 0.7044
Table 6 Support Vector Machine performance of using k-core and CW with or without Dc
Input Accuracy (%) Recall Precision F1-measure
k-core & CW 82.9362 0.4917 0.7234 0.5855
k-core & CW & �� 83.1178 0.5389 0.7029 0.6101
k-core & CW & ��� 82.6866 0.5333 0.6898 0.6016
k-core & CW & ��� 83.2312 0.6241 0.6693 0.6459
k-core & CW & �� 82.7547 0.5352 0.6914 0.6033
k-core & CW & �� 82.7093 0.5333 0.6906 0.6019
k-core & CW & ��� 82.8909 0.5343 0.6969 0.6048
6.
Conclusions
Various ways to quantify diversity exist in the literature [9, 22]. In this work, we apply the diversity of the neighbors of
each trader for detecting fraudsters in online auction. Specifically, we use various methods to calculate diversity, and study
whether these methods cause significant difference on the classification performance of fraudster detection. Our experimental
results show that, using the same classification algorithm, the addition of a neighbor diversity attribute always improves the
recall and F1-measure. The accuracy is almost always improved, except in the case of adding ��� to k-core & CW in Table 6.
Among the various ways to calculate neighbor diversity, they all achieve similar performance, and no one is consistently better
than the others.
The performance results also depend on the classification algorithm used. With J48 and SVM, the recall is better with the
addition of Dr than with the addition of Dc. With neural network, the precision is better with the addition of Dr than with the addition of Dc. However, with each of the three classification algorithms, the accuracy is better with the addition of Dr than with the addition of Dc. Overall, any form of neighbor diversity on the number of received ratings (see Tables 1, 2 and 3) achieves better accuracy than its corresponding neighbor diversity on the number of cancelled transactions (see Tables 4, 5 and
6).
The original definition of neighbor diversity only considers the direct neighbors, but the relationship among a collusive
group may go beyond the direct neighbors. Thus, extending the idea of neighbor diversity to indirect neighbors could be
helpful to spot the intrinsic structure of a collusive group. This is left as a possible direction for future work.
Acknowledgments
This research is supported by the Ministry of Science and Technology, Taiwan, R.O.C. under Grant
102-2221-E-155-034-MY3.
References
[1]D. Houser and J. Wooders, "Reputation in Auctions: Theory, and Evidence from eBay," Journal of Economics & Management Strategy, vol. 15, pp. 353-369, 2006.
[2] J. C. Wang and C. Q. Chiu, "Detecting online auction inflated-reputation behaviors using social network analysis," Proc. North American Association for Computational Social and Organizational Science (NAACSOS 05), June 2005, pp. 26-28
[3]D. Chau, S. Pandit, and C. Faloutsos, Detecting Fraudulent Personalities in Networks of Online Auctioneers, Knowledge Discovery in Databases: PKDD 2006, LNAI 4213, pp. 103-114, 2006.
[5]J. C. Wang and C. C. Chiu, "Recommending trusted online auction sellers using social network analysis," Expert Systems with Applications, vol. 34, pp. 1666-1679, April 2008.
[6]C. C. Chiu, Y. C. Ku, T. Lie, and Y. C. Chen, "Internet Auction Fraud Detection Using Social Network Analysis and Classification Tree Approaches," International Journal of Electronic Commerce, vol. 15, pp. 123-147, Spr. 2011. [7]J. L. Lin and L. Khomnotai, "Using Neighbor Diversity to Detect Fraudsters in Online Auctions," Entropy, vol. 16, pp.
2629-2641, May 2014.
[8]C. E. Shannon, "A Mathematical Theory of Communication," The Bell System Technical Journal, vol. 27, pp. 379-423, 1948.
[9]J. L. Lin, "On the Diversity Constraints for Portfolio Optimization," Entropy, vol. 15, pp. 4607-4621, October 2013. [10] D. H. Chau and C. Faloutsos, "Fraud detection in electronic auction," European Web Mining Forum at ECML/PKDD, pp.
87-97, October 2005.
[11] Z. Bin, Z. Yi, and C. Faloutsos, "Toward a Comprehensive Model in Internet Auction Fraud Detection," Proceedings of the 41st Annual Hawaii International Conference on System Sciences, IEEE Press, Jan. 2008, p. 79.
[12] W. You, L. Liu, M. Xia, and C.Lv, "Reputation Inflation Detection in a Chinese C2C Market," Electronic Commerce Research and Applications, vol. 10, pp. 510-519, September-October 2011.
[13] W. H. Chang and J. S. Chang, "An Effective Early Fraud Detection Method for Online auctions," Electronic Commerce Research and Applications, vol. 11, pp. 346-360, July-August 2012.
[14] M. Morzy, "New Algorithms for Mining the Reputation of Participants of Online Auctions," Algorithmica, vol. 52, pp. 95-112, 2005.
[15] M. Morzy, "Cluster-Based Analysis and Recommendation of Sellers in Online Auction," Computer Systems Science and Engineering, vol. 22, pp. 279-287, 2007.
[16] S. J. Lin, Y. Y. Jheng, and C. H. Yu, "Combining Ranking Concept and Social Network Analysis to Detect Collusive Groups in Online Auctions," Expert Systems with Applications, vol. 39, pp. 9079-9086, 2012.
[17] C. H. Yu and S. J. Lin, "Web Crawling and Filtering for On-line Auctions from a Social Network Perspective," Information Systems and e-Business Management, vol. 10, pp. 201-218, 2012.
[18] V. Batagelj and M. Zaveršnik, "Fast Algorithms for Determining (Generalized) Core Groups in Social Networks," Advances in Data Analysis and Classification, vol. 5, pp. 129-145, July 2011.
[19] V. Batagelj and M. Zaveršnik, "An O(m) Algorithm for Cores Decomposition of Networks," arXiv preprint cs/0310049, pp. 1-10, October 2003.
[20] V. Batagelj and A. Mrvar, "Pajek— Analysis and Visualization of Large Networks," Graph Drawing. vol. 2265, pp. 477-478, 2002.
[21] M. O. Hill, "Diversity and Evenness: A Unifying Notation and Its Consequences," Ecology, vol. 54, pp. 427-432, 1973. [22] H. Tuomisto, "A Consistent Terminology for Quantifying Species Diversity? Yes, It Does Exist," Oecologia, vol. 164, pp.
853-860, December 2010.
[23] L. Jost, "Entropy and Diversity," Oikos, vol. 113, pp. 363-375, 2006.
[24] H. Tuomisto, "A Diversity of Beta Diversities: Straightening Up a Concept Gone Awry. Part 1. Defining Beta Diversity as a Function of Alpha and Gamma Diversity," Ecography, vol. 33, pp. 2-22, 2010.
[25] I. Usta and Y. M. Kantar, "Mean-Variance-Skewness-Entropy Measures: A Multi-Objective Approach for Portfolio Selection," Entropy, vol. 13, pp. 117-133, 2011.
[26] X. X. Huang, "An entropy method for diversified fuzzy portfolio selection," International Journal of Fuzzy Systems, vol. 14, pp. 160-165, March 2012.
[27] A. E. Magurran, Ecological diversity and its measurement, United Kingdom: Croom Helm Ltd, 1988. [28] P. A. Frost and J. E. Savarino, "For better performance: constrain portfolio weights," The Journal of Portfolio
Management, vol. 15, pp. 29-34, 1988.
[29] V. DeMiguel, L. Garlappi, F. J. Nogales, and R. Uppal, "A generalized approach to portfolio optimization: Improving performance by constraining portfolio norms," Management Science, vol. 55, pp. 798-812, May 2009.
[30] R. Jagannathan and T. Ma, "Risk Reduction in Large Portfolios: Why Imposing the Wrong Constraints Helps," The Journal of Finance, vol. 58, pp. 1651-1684, 2003.
[31] C. H. Yu and S. J. Lin, "Fuzzy rule optimization for online auction frauds detection based on genetic algorithm," Electronic Commerce Research, vol. 13, pp. 169-182, May 2013.
List of Symbols and Nomenclature
SNA Social network analysis
J48 Classification tree J48 algorithm
NN Neural network algorithm
SVM Support vector machine
CW Center weight
� The neighbor diversity on the number of received ratings based on Shannon entropy � � The neighbor diversity on the number of received ratings based on max weight diversity
� � The neighbor diversity on the number of received ratings based on min weight diversity
� The neighbor diversity on the number of received ratings based on canonical Lp-norm diversity with the value of
pow=2
� The neighbor diversity on the number of received ratings based on canonical Lp-norm diversity with the value of
pow=3
�� The neighbor diversity on the number of received ratings based on canonical Shannon entropy
�� The neighbor diversity on the number of cancelled transactions based on Shannon entropy
��� The neighbor diversity on the number of cancelled transactions based on max weight diversity
��� The neighbor diversity on the number of cancelled transactions based on min weight diversity
�� The neighbor diversity on the number of cancelled transactions based on canonical Lp
-norm diversity with the value of pow=2
�� The neighbor diversity on the number of cancelled transactions based on canonical Lp
-norm diversity with the value of pow=3