Chronic Asthma: A Relationship with mRNAs Targets
Nancy Garbacki1., Emmanuel Di Valentin2., Vaˆn Anh Huynh-Thu3
, Pierre Geurts3, Alexandre Irrthum3, Ce´line Crahay4, Thierry Arnould5, Christophe Deroanne1, Jacques Piette2, Didier Cataldo4, Alain Colige1*
1GIGA-Research, Laboratory of Connective Tissues Biology, University of Lie`ge, Lie`ge, Belgium,2GIGA-Research, Laboratory of Virology and Immunology, University of Lie`ge, Lie`ge, Belgium,3GIGA-Research, Systems and modeling, University of Lie`ge, Lie`ge, Belgium,4GIGA-Research, Laboratory of Biology of Tumours and Development, University of Lie`ge, Lie`ge, Belgium,5Laboratory of Biochemistry and Cell Biology, University of Namur, Namur, Belgium
Abstract
Background: miRNAs are now recognized as key regulator elements in gene expression. Although they have been associated with a number of human diseases, their implication in acute and chronic asthma and their association with lung remodelling have never been thoroughly investigated.
Methodology/Principal Findings:In order to establish a miRNAs expression profile in lung tissue, mice were sensitized and challenged with ovalbumin mimicking acute, intermediate and chronic human asthma. Levels of lung miRNAs were profiled by microarray andin silicoanalyses were performed to identify potential mRNA targets and to point out signalling pathways and biological processes regulated by miRNA-dependent mechanisms. Fifty-eight, 66 and 75 miRNAs were found to be significantly modulated at short-, intermediate- and long-term challenge, respectively. Inverse correlation with the expression of potential mRNA targets identified mmu-miR-146b, -223, -29b, -29c, -483, -574-5p, -672 and -690 as the best candidates for an active implication in asthma pathogenesis. A functional validation assay was performed by cotransfecting in human lung fibroblasts (WI26) synthetic miRNAs and engineered expression constructs containing the coding sequence of luciferase upstream of the 39UTR of various potential mRNA targets. The bioinformatics analysis identified miRNA-linked regulation of several signalling pathways, as matrix metalloproteinases, inflammatory response and TGF-bsignalling, and biological processes, including apoptosis and inflammation.
Conclusions/Significance:This study highlights that specific miRNAs are likely to be involved in asthma disease and could represent a valuable resource both for biological makers identification and for unveiling mechanisms underlying the pathogenesis of asthma.
Citation:Garbacki N, Di Valentin E, Huynh-Thu VA, Geurts P, Irrthum A, et al. (2011) MicroRNAs Profiling in Murine Models of Acute and Chronic Asthma: A Relationship with mRNAs Targets. PLoS ONE 6(1): e16509. doi:10.1371/journal.pone.0016509
Editor:Chad Creighton, Baylor College of Medicine, United States of America
ReceivedMay 11, 2010;AcceptedJanuary 3, 2011;PublishedJanuary 28, 2011
Copyright:ß2011 Garbacki et al. This is an open-access article distributed under the terms of the Creative Commons Attribution License, which permits unrestricted use, distribution, and reproduction in any medium, provided the original author and source are credited.
Funding:This work was supported by grants of the Walloon Region Government (DGO6), the Fonds National de la Recherche Scientifique (FNRS, Brussels, Belgium), the Fondation Leon Fredericq (University of Lie`ge), the CHU (Lie`ge, Belgium), Action de Recherches Concerte´es, Communaute´ Franc¸aise de Belgique and European Union (FP6 and FP-7), the Interuniversity Attraction Poles Programme- Belgian Science Policy (Brussels, Belgium). Emmanuel Di Valentin is a postdoctoral fellow supported by the IAP6/18 program (Brussels, Belgium). The integrity of RNA extracts was analyzed with the help of Benoıˆt Hennuy (GenoTranscriptomics Platform, GIGA, University of Lie`ge). The funders had no role in study design, data collection and analysis, decision to publish, or preparation of the manuscript.
Competing Interests:The authors have declared that no competing interests exist.
* E-mail: [email protected]
.These authors contributed equally to this work.
Introduction
Asthma is a complex chronic inflammatory disease characterized by eosinophilic airway inflammation, reversible airway obstruction and hyper-responsiveness. Moreover, asthma patients display a faster rate of lung dysfunction than normal individuals related to a progressive remodelling of airway walls [1,2]. Major features of this remodelling process consist of epithelial damages, smooth muscle cell hyperplasia, glandular hyperplasia and airway wall fibrosis including a thin collagen layer deposition in the lamina reticularis of airway epithelium [2,3]. To date, marketed asthma treatments are not sufficient to allow a satisfactory level of control in every patient and are not effective towards airways remodelling processes. For these reasons, identification of new therapeutic targets and new biomarkers relevant for diagnosis and prognosis evaluation are eagerly needed.
the target are also often associated. Most interestingly, this opens the possibility of inferring the existence of potent miRNA-driven translational regulation from powerful and validated whole genome transcriptomic studies. Taking into account that each mammal genome contains several hundreds of miRNA [12], that the complementarities between a miRNA and its target sequence are usually not perfect, that a single miRNA may regulate the translation/degradation of many mRNAs and that a single mRNA can be affected by several different miRNAs, one can consider that this type of investigation requires the use of powerful bioinformatics tools able to analyse such complex pattern of interactions. Although miRNA expression modulations have already been associated with several human diseases [13–30], only few studies have explored the role of miRNAs in non-tumoral lung diseases [31–38] and very little is known about miRNAs expression profiles in the lung during the course of asthma and asthma-induced airway remodelling.
In the present study, microarray analysis has been used to determine miRNAs expression profiles in a mouse model of asthma designed to investigate the development of both acute and chronic responses to allergen. Moreover, in silico analysis and comparison with the expression profile of mRNAs in the same pathological state identified several genes and pathways that are both involved in asthma and post-transcriptionally regulated by miRNA-dependent processes. The best candidates were validated by functional assays in cell culture.
Results and Discussion
Assessment of airway inflammation, sensitization and hyperresponsiveness in mouse model of asthma
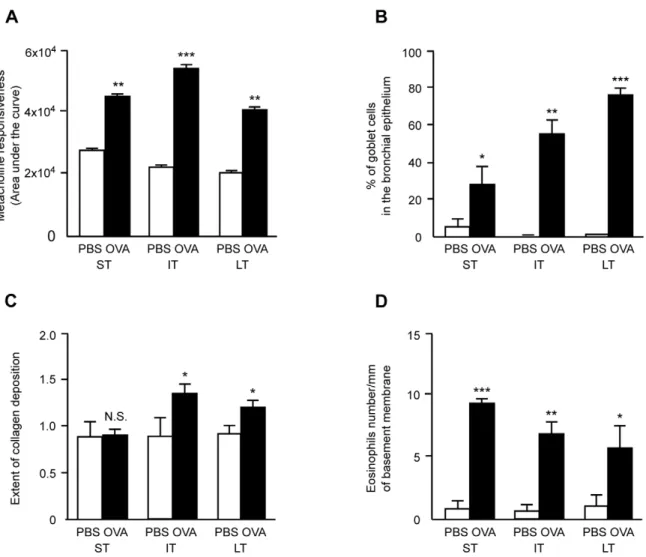
Mouse models of asthma are commonly considered as reliable tools to study pathological mechanisms of the disease since these animals, if adequately sensitized and exposed to allergens, develop measurable airway hyperresponsiveness, airway inflammation, and finally airway remodeling if the exposure to allergens persists [39–41]. The mouse model of asthma used in this study has previously been characterized [4]. In comparison to control mice, animals exposed to allergen showed an enhanced airway resistance after increasing doses of metacholine as compared with the correspond-ing PBS-exposed groups (Figure 1A). Percentages of goblet cells in the bronchial epithelium (Figure 1B) and subepithelial collagen deposition (Figure 1C) did increase over time in allergen-exposed mice. Eosinophilic infiltration measured in bronchial walls was significantly increased in each allergen-exposed group as com-pared to controls while the eosinophils density in the bronchial walls decreased over time (Figure 1D). Exposure to aerosolized OVA induced a slight increase in differential cell numbers present in the BAL fluids when compared to their PBS-exposed counterparts (Table 1) which was expected from previous studies [40,42] and largely resulted from eosinophilic representation.
Reproducibility of our mouse model of asthma induction was further assessed by measuring in each individual mouse of the current study. The relative abundance of 8 transcripts known from a previous study [4] to be regulated at the 3 time-points of allergen exposure (ST, IT and LT). The new data set is fully in agreement with previous quantifications, except for Cdc2a at ST and LT (Figure S1). All together these functional, cellular and transcrip-tomic evaluations demonstrate the reproducibility of our models of asthma from one experiment to another. These data allow us to use the transcriptomic data from our previous study [4] to relate mRNA targets with the miRNAs identified in this study. However, the animal model of asthma used here can also bear per se some limitations. For instance, allergen used in animals (ovalbumin) is not a causative agent of human asthma in physiological conditions.
The animals are also anatomically different from human regarding bronchial architecture since number of bronchial divisions is lower in mice. Nevertheless, this model with its intrinsic limitations allowed the investigators to reproduce all key features of asthmatic airways as found in humans with an allergen-induced airway inflammation and hyperresponsiveness as well as an allergen-induced airway remodeling (figure 1A–D).
MiRNA expression changed in lungs during allergen exposure
Lung total RNA was obtained from groups of mice exposed to allergen (OVA) or control (PBS) for 1 (ST), 5 (IT) and 10 (LT) weeks. Microarray analysis indicated that 58, 66 and 75 mature miRNAs out of 566 were significantly (p-value,0.01) modulated at ST, IT and LT, respectively (Table S1). For many of them, the fold induction or repression in the OVA-treated mice was higher than 1.5 (20 at ST, 26 at IT and 67 at LT) (Table 2). Some miRNAs underwent a significant modulation ($1.5-fold,p-value ,0.01) at two time-points but only one, mmu-miR-146b, was consistently upregulated at the three investigated time-points (Table 3).
Modulated miRNAs after short term (ST) and intermediate term (IT) exposure to allergen. Mmu-miR-690 was downregulated at ST and IT but was no longer modulated at LT. In the literature, this miRNA was only reported to be significantly downregulated in pancreaticb cells after treatment with high glucose [43]. The second miRNA significantly regulated, mmu-miR-223, was previously shown to play a significant role in pulmonary function alteration by exposition to cigarette smoke [31] or to LPS [33]. It is also known to be involved in hematopoietic development [44–47], to be expressed by PBMC [48] and neutrophils [33] and to be implicated in malignancies such as ovarian cancer [49], hepatocellular carcinoma [50] and bladder cancer [51].
Modulated miRNAs after short term (ST) and long term (LT) exposure to allergen. Three miRNAs, mmu-miR-672, -574-5p and -483 were downregulated at ST and upregulated at LT. To our knowledge, only miR-483 has been previously associated to a specific disease or a physiological state and was found to be significantly correlated with cardiac hypertrophy [52].
Modulated miRNAs after intermediate term (IT) and long term (LT) exposure to allergen. Mmu-miR-423-5p, -455, -466f-3p, -466g, -467a* and -467b* were consistently upregulated at IT and LT. Among these miRNAs, miR-455 has been reported to be implicated in brown adipocyte differentiation [53], while the functions or targets of the others are not determined yet. These miRNAs could become interesting markers of late phases of asthma development as they are significantly upregulated. By contrast to these six miRNAs, mmu-miR-29c is downregulated at these two time-points. MiR-29 has been reported to be involved in various human cancers [54-57] and in tumour suppression by targeting the T-cell leukemia/lymphoma 1 (Tcl1) oncogene mRNA [54], by reverting DNA methylation by targeting DNA methyltransferases 3A (Dnmt3a) and 3B (Dnmt3b) mRNA [58] and by regulating p53 pathway through Cdc42 and p85a
[59]. Moreover, its targets mRNAs encoding extracellular matrix proteins have been associated with cell migration and metastasis such as Col3a1, Col4a1, Col15a1, Lamc1 [60]. MiR-29 regulates also muscle cell differentiation probably, in part, under a feed-back control of NF-kB-YY1 pathway [61].
showed that miR-146 regulatory circuit fine-tunes TLR and cytokine signalling, rather than totally abrogating the signal, in response to microbial components and proinflammatory cytokines.
Moreover, this miRNA acts as a negative regulator of NF-kB
activity in a human breast cancer cell line [64].
Microarray validation
Before considering further the potential implication of the regulation affecting the expression of several miRNAs, micro-arrays data, that were obtained by hybridization of RNA pools, were validated by RT-qPCR quantification for each individual
Table 1.Differential cell counts in BAL fluids.
ST IT LT
PBS OVA PBS OVA PBS OVA
Epithelial cells (6104/ml) 4.960.8 4.761.9 1.860.8 3.560.7 1.560.2 3.860.5
Eosinophils (6104/ml) 5.2
61.7 75.0630.7 1.660.4 8.161.5 2.360.4 11.361.8
Lymphocytes (6104/ml) 0.260.1 0.560.1 0.160.0 0.260.1 0.260.1 0.560.1
Macrophages (6104/ml) 36.966.0 22.166.1 17.661.1 22.963.6 26.963.1 21.561.9
Neutrophils (6104/ml) 0.1
60.0 2.160.1 0.160.0 0.660.2 0.260.1 1.160.2
Cellular composition of BAL fluid and absolute cell counts performed 24 hours after the last allergen or PBS exposure. ST, IT, LT: short, intermediate and long-term treatments, respectively.
doi:10.1371/journal.pone.0016509.t001
Figure 1. Assessment of airway inflammation, sensitization and hyperresponsiveness. Assessment of airway responsiveness to metacholine (Panel A), of glandular hyperplasia as percentage of goblet cells per total epithelial cells (Panel B), of peribronchial collagen deposition (Panel C) and of eosinophils accumulation (Panel D) in randomly selected bronchi in PBS and OVA-treated groups of mice at short-term (ST), intermediate-term (IT) and long-term (LT) sensitization and exposure protocols. Mean scores were measured as described in [4]. Results are expressed as means6SE and the comparison between groups was performed using Mann-WhitneyUtest (*p-value,0.05; **p-value,0.005; ***p-value ,0.001; N.S.: not significant).
mouse in the six experimental groups. Primers were designed for several miRNAs undergoing regulation at, at least, two time-points (such as mmu-miR-146b, -29c…) and for miRNAs selected on the basis of their abundancy (such as mmu-let-7b, mmu-miR-21, -145…), the magnitude of the observed regulations (such as mmu-miR-574-5p, -672…) and the potential significance of their mRNA targets (see below). In some cases, PCR amplifications were perturbed by several unspecific products preventing an accurate
Table 2.List of significantly modulated mature miRNAs ($1.5-fold,p-value,0.01) and their respective fold induction at each time-point.
UPREGULATION DOWNREGULATION
MIRNA FI MIRNA FI
ST
mmu-miR-712* 5.24 mmu-miR-187 0.66
mmu-miR-122 5.08 mmu-miR-497 0.49
mmu-miR-181d 2.51 mmu-miR-690 0.49
mmu-miR-106a 2.28 mmu-miR-1 0.46
mmu-miR-223 1.99 mmu-miR-483 0.39
mmu-miR-146b 1.91 mmu-miR-574-5p 0.37
mmu-miR-181b 1.91 mmu-miR-203 0.35
mmu-miR-689 1.90 mmu-miR-672 0.35
mmu-miR-20b 1.88 mmu-miR-805 0.28
mmu-miR-451 1.60
mmu-miR-100 1.52
IT
mmu-miR-155 4.48 mmu-miR-322 0.66
mmu-miR-467b* 2.97 mmu-miR-429 0.66
mmu-miR-467a* 2.79 mmu-miR-199a-3p 0.63
mmu-miR-466g 2.64 mmu-miR-152 0.63
mmu-miR-466f-3p 2.23 mmu-miR-29c 0.62
mmu-miR-455 2.03 mmu-miR-218 0.62
mmu-miR-150 1.80 mmu-miR-200a 0.59
mmu-miR-423-5p 1.69 mmu-miR-10a 0.59
mmu-miR-146b 1.55 mmu-miR-10b 0.53
mmu-miR-375 1.52 mmu-miR-29b 0.52
mmu-miR-101a 0.36
mmu-miR-223 0.32
mmu-miR-19b 0.31
mmu-miR-690 0.24
mmu-miR-450a-5p 0.19
mmu-miR-126-5p 0.14
LT
mmu-miR-705 119.30 mmu-miR-200b 0.61
mmu-miR-188-5p 117.39 mmu-miR-92a 0.60
mmu-miR-483 115.80 mmu-miR-30c 0.59
mmu-miR-669c 115.25 mmu-miR-27a 0.53
mmu-miR-568 96.03 mmu-let-7e 0.50
mmu-miR-467b* 48.35 mmu-miR-21 0.47
mmu-miR-691 42.50 mmu-miR-25 0.46
mmu-miR-671-5p 39.54 mmu-miR-30b 0.44
mmu-miR-467a* 39.02 mmu-miR-23b 0.41
mmu-miR-485* 33.41 mmu-miR-23a 0.38
mmu-miR-744 29.56 mmu-miR-26b 0.31
mmu-miR-466f-3p 22.69 mmu-miR-98 0.20
mmu-miR-685 19.58 mmu-miR-15a 0.19
mmu-miR-709 18.98 mmu-miR-29c 0.11
mmu-miR-467e* 18.51
mmu-miR-466c-5p 17.07
mmu-miR-466g 16.19
Table 2.Cont.
UPREGULATION DOWNREGULATION
MIRNA FI MIRNA FI
mmu-miR-574-3p 15.99
mmu-miR-574-5p 13.18
mmu-miR-667 13.13
mmu-miR-713 11.83
mmu-let-7d* 11.72
mmu-miR-762 11.22
mmu-miR-466d-3p 9.95
mmu-miR-466b-3-3p 9.89
mmu-miR-466f-5p 9.50
mmu-miR-297a* 9.21
mmu-miR-468 8.99
mmu-miR-466a-3p 8.48
mmu-miR-197 8.06
mmu-miR-455 7.51
mmu-miR-877* 6.41
mmu-miR-297a 6.38
mmu-miR-15a* 6.14
mmu-miR-207 6.03
mmu-miR-346 5.84
mmu-miR-466h 5.54
mmu-miR-206 5.48
mmu-miR-328 5.38
mmu-miR-672 5.30
mmu-miR-214 5.29
mmu-miR-320 4.52
mmu-miR-34c* 4.26
mmu-miR-423-5p 4.04
mmu-miR-674 3.84
mmu-miR-151-3p 3.18
mmu-miR-143 2.86
mmu-miR-146b 2.69
mmu-miR-720 2.69
mmu-miR-146a 2.09
mmu-miR-99b 2.03
mmu-miR-125b-5p 1.88
mmu-miR-145 1.75
mmu-miR-30d 1.64
mmu-miR-191 1.59
ST, IT, LT: short, intermediate and long-term treatments, respectively; FI: fold induction.
quantification. This pitfall was found to be related in part to the low level of some miRNAs and strongly related to the short size of mature miRNA preventing the design of highly specific primers. In order to overcome this technical problem, LNA-containing primers were designed to quantify these hard to amplify miRNAs (mmu-miR-146b, -29b and -29c). Quantitative RT-PCR was performed at the three time-points for 14 miRNAs, representing a total of 42 calculations of the OVA/PBS ratios based on individual mice measurements. Among these data, 40 out of 42 (95%) gave results and trends similar to those obtained by microarray profiling, except for mmu-miR-29c at ST and LT (Figure 2), although the magnitude of the observed regulation was not always identical (mmu-miR-455 at LT and mmu-miR-450a at IT). Besides problems related to PCR amplification as experienced with mmu-miR-29c, another potential explanation for the differences observed between the two quantification procedures could be related to the relative abundance of precursor miRNA (pre-miRNA) that are characterized by the persistence of a stem-loop structure. Depending upon their sequence and stability, these stem-loops are indeed expected to affect differently the efficiencies of the RT-PCR amplifications and the hybridization with probes immobilized on microarrays. As a result, differences in micro-arrays and RT-PCR data for a specific miRNA may be related to modifications of the level of its pre-miRNA, thus to the regulation of its transcription.
All together, these data demonstrate that microarray analysis is reliable and allows to detect changes in the level of expression of a large panel of miRNAs, providing a unique opportunity to investigate the role of miRNA-based RNA interference during the course of asthma.
Several miRNAs were expected to participate in the regulation of biological processes during the course of asthma development
Knowing that miRNA can induce a significant degradation of its target and assuming also that evolution progressively selected
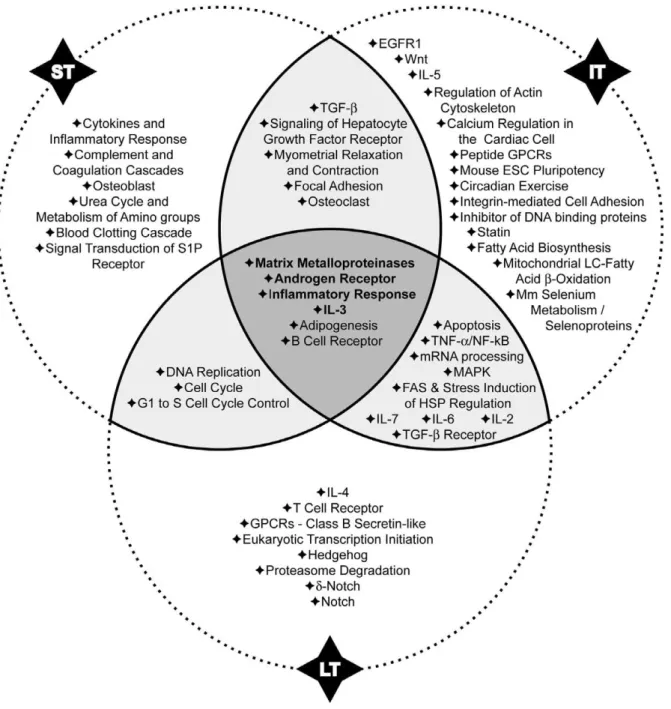
inverse regulation of expression of mRNAs and their specific miRNAs, we determined (MicroCosm Target algorithm) for each miRNA its potential target(s) and the regulatory pathways that are expected to be regulated (Tables S2, S3 and S4). Among these results, we focused on predicted pairs of miRNAs and mRNAs that are inversely regulated at 2 time-points with ap-value ,0.05 (Table 4). The potential targets of mmu-miR-146b, the only miRNA being significantly upregulated throughout the experi-ment, were also identified (Table 5). Collectively, these 7 selected miRNAs are expected to participate in the regulation of several biological processes involved in asthma as illustrated in Figure 3.
Functional correlation between the expression of miRNAs and some of their potential targets. As shown in Tables 4 and 5, modulation of some miRNAs could be involved in the pathogenesis of asthma by regulating genes at acute and/or chronic stages of the disease. We selected 8 miRNAs (those described in Tables 4 and 5 and mmu-miR-29b) and, at least, 2 of their potential targets for functional testingin vitro(Figures 4 and 5). In this assay, cells from lung origin were cotransfected with synthetic miRNA mimic or non-functional small RNA control and expression vectors containing the coding sequence of luciferase
cloned upstream of either an irrelevant control 39UTR or the
39UTR of the respective potential mRNA target. In this
experimental set up, the efficiency of the miRNA-dependent regulation was directly proportional to the decrease in luciferase activity used as a reporter.
For miR-146b, which was up-regulated at the 3 time-points, and for miR-29b and -29c, which are thought to be regulators of extracellular matrix remodelling and are downregulates at IT and LT, increasing concentrations were tested to evaluate the sensitivity and the specificity of the assays (Figure 4).
Despite their close sequence similarity, miR-29 members showed different inhibitory patterns. MiR-29b mimic reduced efficiently and dose-dependently the luciferase activity from
constructs containing the 39UTRs of mouse 15 and
Mmp-24 while miR-29c had only a limited effect at high concentration
on Mmp-24 39UTR (Figure 4A, B). Since the sequence of
miR-29b and -29c are identical in human and mouse, their efficiencies
were also evaluated using the 39UTRs of human Mmp-15 and
Mmp-24. Similar regulations were observed using human and
mouse 39UTRs, which confirm both the specificity of the
inhibitions and the relevance of our findings in the context of human asthma.
Among the 17 others miRNA-mRNA pairs that were evaluated (Figure 4E-H and Figure 5), significant inhibition was observed in 10 experimental conditions (miR-29c and Ctsk; miR-146b and Scube2; 483 and Nola2 or Ube2c; 672 and Phb2; miR-223 and Il6 or Lpin2 or Arid4b; miR-690 Fst or Ctse). All together these validation analyses indicate that 64% (16/25) of thein silico
predicted regulations are effective while inhibitions were also observed in the 9 remaining cases but were too low to reach statistical significance. Although optimization of the experimental design (timing for sample collection, transfection conditions, target concentration…) would have probably led to the confirmation of other miRNA-mRNA regulatory pairs, these experiments were not further continued since the aim of these functional assays was only to validate the in silico predictions before addressing the potential roles of miRNAs during asthma.
Identification of biological processes regulated by miRNAs. Genes involved in transcriptional regulation are modulated at each time-point in our experimental model [4]. Four of selected miRNAs (Tables 4 and 5) displayed a clear correlation with this biological process at 2 or 3 time-points. The expression of mmu-miR-483 and -672 was downregulated at ST
Table 3.miRNAs undergoing a significant modulation ($ 1.5-fold,p-value,0.01) determined by microarray analysis at, at least, 2 time-points.
FOLDINDUCTION
ST IT LT
mmu-miR-690 0.49 0.24 N.C.
mmu-miR-223 1.99 0.32 N.C.
mmu-miR-672 0.35 N.C. 5.31
mmu-miR-574-5p 0.37 N.C. 13.18
mmu-miR-483 0.39 N.C. 116.16
mmu-miR-29c N.C. 0.62 0.11
mmu-miR-423-5p N.C. 1.69 4.03
mmu-miR-455 N.C. 2.03 7.52
mmu-miR-466f-3p N.C. 2.23 22.63
mmu-miR-466g N.C. 2.64 16.22
mmu-miR-467a* N.C. 2.79 39.12
mmu-miR-467b* N.C. 2.97 48.50
mmu-miR-146b 1.91 1.55 2.69
ST, IT, LT: short, intermediate and long-term treatments, respectively; N.C.: no change between PBS and OVA.
as compared to the PBS-treated mice while the levels of mmu-miR-223 and -146b were increased. Their putative targets in this biological process embrace direct transcription initiator (TOP2A, topoisomerase IIa), transcription factors (ZFP451, BTF3, KLF13
and TCFCP2L1), transcription coactivators (LPIN2) or
corepressors (FOXP4, GMNN, PHB2) and proteins playing roles in functional organization of chromosome structure through chromatin remodeling (ARID4B).
We also observed that the mRNA potentially targeted by mmu-miR-223 (Arid4b, Lpin2, see Figure 5) and mmu-miR-146b (Zfp451, Klf13 and Tcfcp2l1) did undergo a downregulation at ST. This effect could be reinforced by the downregulation of mmu-miR-672, which potentially targets PHB2, a factor that restrains estrogen action and its activating pathway [65] and by repression of mmu-miR-483 that could be responsible for the observed upregulation of GMNN, an inhibitor of HOX-dependent transcriptional activity [66]. However, topoisomerase
IIa(Top2a) mRNA, which appears to be inversely correlated to
mmu-miR-672 expression, was significantly upregulated at ST and downregulated at LT. An inversion in the pattern of transcription-related mRNA-miRNA modulations was shown at LT exposure to allergens. From these findings, it can be speculated that the potential role of miRNAs in the modulation of transcription mechanisms would mostly consist in a fine-tuning process rather than striking regulations.
Cell cycle. MiRNA targeting genes regulating cell cycle are clearly downregulated at ST, not affected at IT and upregulated at LT. GMNN, which negatively regulates cell cycle, and MKI67, which is an endogenous marker of proliferative cells, are putative targets of mmu-miR-483. The expression of CCNB1 (cyclin B1) that activates CDK1 driving G2/M-phase progression [67], of CDCA8 (borealin) that is required for the proper segregation of chromosomes during mitosis [68] and of NUSAP1 that is selectively expressed in proliferative cells and is a positive regulator of mitosis by acting on microtubules organization [69] were significantly inversely correlated to mmu-miR-574-5p Figure 2. Validation of microarray data by real-time RT-qPCR. Comparison of miRNA level regulation as determined by microarray hybridization (several probes per target) performed on pooled total RNA and by RT-qPCR performed on total RNA of each individual mice. Results are expressed as means6SD. The value ‘‘1’’ is arbitrarily given when no change is observed. ST, IT, LT: short, intermediate and long-term treatments, respectively. FI: fold induction.
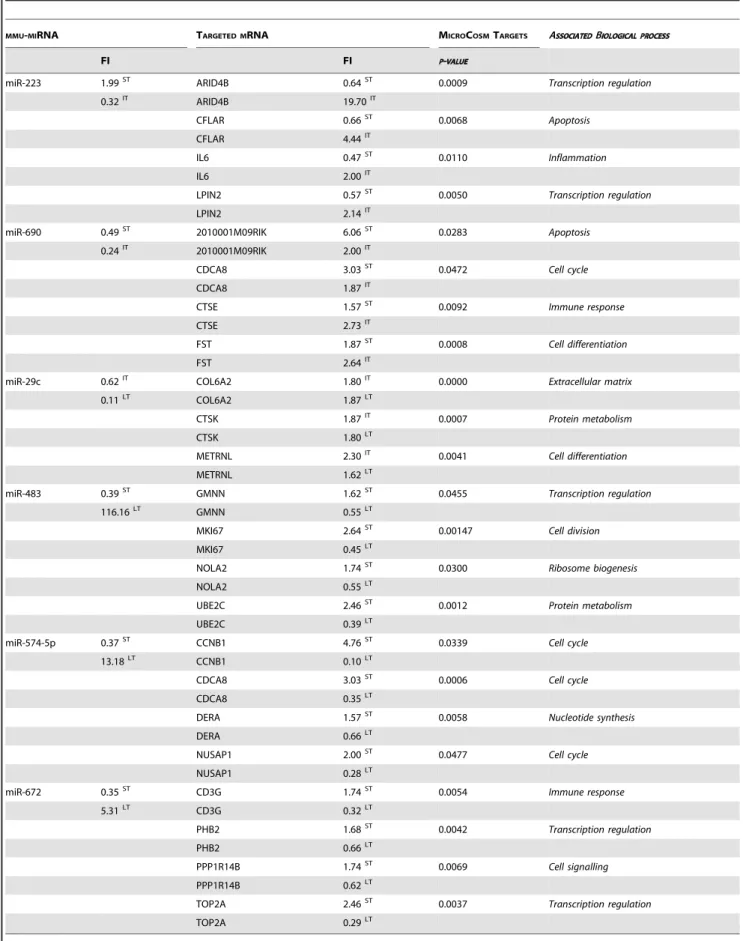
Table 4.Prediction of the mRNA targets for miRNA regulated at 2 time-points in the mouse model of asthma.
MMU-MIRNA TARGETED MRNA MICROCOSMTARGETS ASSOCIATEDBIOLOGICAL PROCESS
FI FI P-VALUE
miR-223 1.99ST ARID4B 0.64ST 0.0009 Transcription regulation
0.32IT ARID4B 19.70IT
CFLAR 0.66ST 0.0068 Apoptosis
CFLAR 4.44IT
IL6 0.47ST 0.0110
Inflammation
IL6 2.00IT
LPIN2 0.57ST 0.0050 Transcription regulation
LPIN2 2.14IT
miR-690 0.49ST 2010001M09RIK 6.06ST 0.0283 Apoptosis
0.24IT 2010001M09RIK 2.00IT
CDCA8 3.03ST 0.0472
Cell cycle
CDCA8 1.87IT
CTSE 1.57ST 0.0092 Immune response
CTSE 2.73IT
FST 1.87ST 0.0008 Cell differentiation
FST 2.64IT
miR-29c 0.62IT COL6A2 1.80IT 0.0000 Extracellular matrix
0.11LT COL6A2 1.87LT
CTSK 1.87IT 0.0007 Protein metabolism
CTSK 1.80LT
METRNL 2.30IT 0.0041
Cell differentiation
METRNL 1.62LT
miR-483 0.39ST GMNN 1.62ST 0.0455 Transcription regulation
116.16LT GMNN 0.55LT
MKI67 2.64ST 0.00147 Cell division
MKI67 0.45LT
NOLA2 1.74ST 0.0300
Ribosome biogenesis
NOLA2 0.55LT
UBE2C 2.46ST 0.0012 Protein metabolism
UBE2C 0.39LT
miR-574-5p 0.37ST CCNB1 4.76ST 0.0339 Cell cycle
13.18LT CCNB1 0.10LT
CDCA8 3.03ST 0.0006
Cell cycle
CDCA8 0.35LT
DERA 1.57ST 0.0058 Nucleotide synthesis
DERA 0.66LT
NUSAP1 2.00ST 0.0477 Cell cycle
NUSAP1 0.28LT
miR-672 0.35ST CD3G 1.74ST 0.0054 Immune response
5.31LT CD3G 0.32LT
PHB2 1.68ST 0.0042 Transcription regulation
PHB2 0.66LT
PPP1R14B 1.74ST 0.0069
Cell signalling
PPP1R14B 0.62LT
TOP2A 2.46ST 0.0037 Transcription regulation
TOP2A 0.29LT
The rationale for calculation (MicroCosm Target algorithm) is based on sequence complementarity between miRNA and the 39UTR of its potential target, and on the inverse correlation of their regulation. The associated biological processes are also indicated.
ST, IT, LT: short, intermediate and long-term treatments, respectively. FI: fold induction.
expression. These correlations reinforce the hypothesis that cell proliferation predominates at the early stages of asthma development rather than in the late stage and might probably partly be under miRNA control, especially through mmu-miR-574-5p regulation.
Protein metabolism. Inverse correlations were also observed between miRNAs and genes involved in protein metabolism. As discussed further in the Inflammatory Response Pathway section, mmu-miR-29 appears to be a miRNA family displaying a protective role against fibrosis. Mmu-miR-29c
decrease could lead to the upregulation of CTSK (cathepsin K, see Figure 4F) at the intermediate and the late stages of asthma progression. CTSK is involved in lung matrix homeostasis by degrading extracellular matrix proteins before their secretion, therefore preventing excessive matrix deposition [70].
Ubiquitination is a step leading to protein degradation by the proteasome. Transcriptional downregulation was observed for some factors contributing to this process (UBE2C, UBE2D2 and UBR1), especially at the LT time-point. A statistically significant inverse correlation has been observed with increased mmu-miR-146b and -483 expressions. According to our data, protein production is repressed during the first phases of asthma development and then increases concomitantly with tissue remodeling at the late stages of the disease. These modulations could result from the simultaneous regulation of the levels mmu-miR-483 (see Figure 5), -672 and -146b.
Apoptosis, immunity, inflammation and cell signall-ing. In silico analysis have also pointed significant correlations
between miRNA (mmu-miR-146b, -223 and -690) and
modulations of mRNAs related to apoptosis processes. Induction of apoptosis in inflammatory cells, including eosinophils, might have a beneficial effect on airway hyperresponsiveness observed at ST [71] while its inhibition at IT might lead to the development of allergic disease [72]. Regulation of apoptosis by miRNAs is expected to occur via NF-kB pathway by inducing the degradation or inhibiting the translation of apoptosis-related mRNA as already described for mmu-miR-146b [63]. In our model, CFLAR, an NF-kB-inducible anti-apoptotic protein which inhibits caspase 8mediated apoptosis, is a putative target of mmumiR146b and -223. The upregulation of these two miRNAs at ST should therefore induce apoptotic mechanisms in inflammatory cells. This hypothesis is further reinforced by the demonstration that mmu-miR-146b inhibits the expression of CARD10 (see Figure 4H), a molecular scaffold for the assembly of a BCL10 signalling complex that activates NF-kB [73].
MiR-146 is also associated with inflammation and innate immune responses where it regulates the response to a variety of microbial components and proinflammatory cytokines [63]. In our ST protocol, upregulation of mmu-miR-146b and -223 is predicted to repress SCUBE2 and IL-6, factors that are under the control of IL-1band TNF-a[74,75], probably through NF-kB activation.
The immune response, clearly stimulated by OVA in the early
phase of asthma development [4], is mediated by CD4+
T helper cells, eosinophils, neutrophils, macrophages, and IgE antibodies. The increased expression of CTSE (cathepsin E) at ST [4] stimulates the generation of antigenic epitopes from OVA (Figure 6) [76]. Similarly, an overexpression of CD3G, a protein forming a complex with TCR, favour the activation process. Signalling upon TCR stimulated by MHC presented antigen induces IL-13 production, antigen-specific Th2 response and expression of anti-apoptotic genes through NF-kB translocation [77]. A co-stimulatory pathway of regulation involves the cross-link of receptors on T cells with their corresponding ligand(s), such as TNFRSF9 with TNFSF9 (Figure 6). These different pathways are under direct control of several miRNAs. Mmu-miR-690 and-672, that were repressed at ST, are potential inhibitors of CTSE and CD3G production meaning that their downregulation could increase the activation of T cells. Similarly, the continuous overexpression of mmu-miR-146b should reduce the synthesis of
CLEC4D and TNFSF9. The stimulation of TNFRSF9in vivohas
been shown to inhibit allergic asthma by decreasing IgE production [78] and regulation of the B cell response [79,80] and to fine-tune the Th1/Th2 balance [77]. The inhibition of
Table 5.Predicted mRNA targets of mmu-miR-146b at the 3 time-points.
TARGET MRNA FI
ASSOCIATED BIOLOGICAL PROCESS
MICROCOSM
TARGETS
P-VALUE
ST (mmu-miR-146b FI = 1.91)
ALS2CL 0.59 GTPase activator activity 0.0035
AP4S1 0.57 Vesicle mediated transport 0.0028
APLP2 0.48 ECM organization 0.0097
CARD10 0.55 Apoptosis/NF-kB activation 0.0003
CFLAR 0.66 Apoptosis/NF-kB activation 0.0371
CLEC4D 0.39 Immune response 0.0016
GPR116 0.57 Cell signalling 0.0038
KLF13 0.66 Transcription regulation 0.0436
NCOA4 0.64 Nuclear receptor activator 0.0191
NUMB 0.62 Cell signalling 0.0089
RASIP1 0.66 Angiogenesis 0.0000
SCUBE2 0.52 Inflammation 0.0002
TCFCP2L1 0.57 Transcription regulation 0.0391
TNFSF9 0.59 Immune response 0.0021
UBR1 0.66 Protein metabolism 0.0001
UTRN 0.64 Cell signalling 0.0095
ZFP451 0.57 Transcription regulation 0.0003
IT (mmu-miR-146b FI = 1.56)
BAIAP2L1 0.66 Cell signalling 0.0004
FOXP4 0.52 Transcription regulation 0.0134
HIST2H3C2 0.52 Nucleosome assembly 0.0371
PKP2 0.62 Cell interaction 0.0010
ZNHIT1 0.64 Unknown 0.0084
LT (mmu-miR-146b FI = 2.69)
BTF3 0.64 Transcription regulation 0.0367
CDCA3 0.44 Cell cycle 0.0300
DTYMK 0.62 Nucleotide biosynthesis 0.0052
HMGCS1 0.66 Lipidic metabolism 0.0069
HORMAD1 0.47 Cell cycle 0.0046
KIF22 0.29 Microtubules 0.0036
MGEA6 0.55 Unknown 0.0230
RPS9 0.62 Protein metabolism 0.0001
UBE2D2 0.62 Protein metabolism 0.0418
WDR12 0.59 Cell signalling 0.0261
Mmu-miR-146b is upregulated and predicted targeted mRNA are
downregulated at each time-point. ST, IT, LT: short, intermediate and long-term treatments, respectively. FI: fold induction.
TNFSF9 by mmu-miR-146b could therefore play a central function in the evolution of the disease.
Another aspect of cell function appeared to be modulated by mmu-miR-146b. NUMB expression is inhibited by miR-146a in various cell lines [81]. NOTCH and NUMB controls the proliferative/differentiation balance in development and homeo-stasis. An increased degradation of NUMB, that antagonizes the cell surface receptor NOTCH, leads to uncontrolled cell proliferation in human mammary gland tumors [82]. Hyperplasia is also a characteristic of remodelling of airway walls and concerns epithelial cells, smooth muscle cells, fibroblasts and goblet cells. A decrease in NUMB at ST should result in substantial increase of cell proliferation. In the LT protocol, a downregulation of WDR12, another putative target of mmu-miR-146b, was also observed. This factor is involved in differentiation processes related to NOTCH signalling [83]. Therefore, mmu-miR-146b probably controls some aspect of cell proliferation and may participate in the development of subepithelial fibrosis in asthma, by regulating NUMB and WDR12 expression in the NOTCH signalling pathway.
MiRNAs modulation in different mice models of asthma was significantly associated with four signalling
pathways
A large scale unbiased approach to determine the significance of the observed regulations of miRNA expression was also used. At each time-point, a set of predicted mRNA targets was identified for each miRNA significantly up- or downregulated above 1.5 fold. The use of a cut-off threshold of 1.5 on the fold-change is not uncommon in the context of miRNA profiling studies [84-86]. Since a single miRNA has several targets, moderate modifications of its expression may have deep impact at a cellular level. Moreover for studies profiling miRNA in complex tissues, such as lung in this study, a cut-off of 1.5 is more appropriate to identify regulations affecting only subpopulation of cells and not the entire organ. Based on the known functions of the protein encoded by these mRNA, pathways of regulation affecting behaviour and partly controlled by miRNAs can be identified. In order to further strengthen the analysis, two different databases were used. Target Figure 3. Potential regulation performed by miRNAs during the development of allergen-induced asthma.Thisin silicoprediction is based on significant inverse correlation between mRNA and miRNA modulation of expression as detailed in tables 4 and 5. ST, IT, LT: short, intermediate and long-term treatments, respectively. The observed up- ( ) and down- ( ) regulations of the expression of the selected miRNAs are reported.
prediction by MicroCosm Targets database is performed on optimal sequence complementarity between a set of mature miRNAs and a given mRNA using an algorithm reflecting the weight of each base position and allowing mismatches at the 59
end of miRNA [87]. Target prediction by TargetScan database is established on sequence complementarity to target sites with emphasis on perfect base-pairing in the seed region and on sequence conservation among species [88].
Sixteen pathways at ST, 25 at IT and 19 at LT were selected
with a combined p-value ,0.05 (Tables S5, S6 and S7) with
MicroCosm Targets database and 16 pathways at ST, 21 at IT and 32 at LT were selected with a combinedp-value,0.05 (Tables S8, S9 and S10) with TargetScan database. The comparison of these data highlighted four common pathways that are modulated at the three time-points (Figures 7 and 8). Matching results from the two algorithms allowed us to select signalling pathways strongly involved in the development of asthma. Some interactions between modulated miRNAs and their potential targets are discussed below.
Matrix Metalloproteinases Pathway. Matrix Metallopro-teinases (MMPs) Pathway (WP441) was the most significantly
modified by the miRNA modulation at the three time-points (
p-value#0.01), which confirms our previous transcriptomic analysis [4]. MMPs and their inhibitors (tissue inhibitors of matrix metalloproteinases, TIMPs) contribute to the pathogenesis of asthma by regulating the cleavage of peptidic mediators that influence the functions and the migration of inflammatory cells and by modifying the extracellular matrix homeostasis. Apart from their role in acute airway inflammation, MMPs may contribute to features of airway remodelling including reorganization of matrix, angiogenesis and smooth muscle hyperplasia.
At ST, a decrease in mmu-miR-203 and -1 expression is expected to induce the upregulation of MMP-24 and TIMP-3 (Figure 9). At IT, repression of mmu-miR-29b and -29c should induce an increase expression of MMP-15 and -24 (Figure 4A-D) but also of MMP-2. Moreover, these miRNAs can prospectively target MMP-2 and MMP-15. Finally, at LT, 2 and TIMP-Figure 4. Dose-response analysis of the effect of miR-29b, -29c and -146b on their predicted target in lung cells.Transient transfection analysis for luciferase reporter expression with mouse Mmp-15 39UTR in the presence of miR-29b and -29c (Panel A); mouse Mmp-24 39UTR in the presence and absence of miR-29b and -29c (Panel B); human Mmp-15 39UTR in the presence of miR-29b and -29c (Panel C); human Mmp-24 39UTR in the presence of miR-29b and -29c (Panel D); mouse Col6a2 39UTR in the presence of miR-29c (Panel E); mouse Ctsk 39UTR in the presence of miR-29c (Panel F); mouse Scube2 39UTR in the presence of miR-146b (Panel G); mouse Card10 39UTR in the presence of miR-146b (Panel H). Universal negative siRNA was used at 20 nM as non-functional small RNA control. For each expression vector, the specific effect of the miRNA on luciferase acti-vity was expressed as compared to the actiacti-vity measured in the control condition, arbitrarily set at ‘‘100’’. Results are expressed as mean6SD. (*p-value,0.05; **p-value,0.001;#p-value,0.005).
doi:10.1371/journal.pone.0016509.g004
Figure 5. Analysis of 13 miRNAs-predicted target murine genesin vitro.Transient transfection analysis for luciferase reporter expression with Arid4b, Il-6 or Lpin2 39UTR in the presence of miR-223; with Gmnn, Nola2 or Ube2c 39UTR in the presence of miR-483; with Dera or Nusap1 39UTR in the presence of miR-574-5p; with Cd3g or Phb2 39UTR in the presence of miR-672; and with Fst, Ctse or Cdca8 39UTR in the presence of miR-690. Universal negative siRNA were used at 20 nM as non-functional small RNA control. For each expression vector, the specific effect of the miRNA on luciferase activity was expressed as compared to the activity measured in the control condition, arbitrarily set at ‘‘100’’. Results are expressed as mean
3 mRNAs are the predicted targets of several modulated miRNAs (mmu-miR-30b, -30c, -30d, -21, -214 and -206).
Deregulation of TIMPs and MMPs activities can lead to an exaggerated matrix turnover and be responsible for subepithelial fibrosis observed in asthma. A common feature of MMP-15 and MMP-24 is that they are membrane-type MMPs sharing an identical substrate, the pro-MMP-2. In lung fibrosis, in the late stages of the disease, MMP-2 may be associated to pathological collagen deposition and interstitial fibrosis [89]. Since no significant modifications in MMP-2, MMP-15 and MMP-24 mRNA levels were observed [4], it strongly suggests that miRNAs regulate the translation of these MMPs [11]. This hypothesis is further reinforced by our functional data showing that 39UTRs of both human and mouse Mmp-15 and -24 are similarly targeted by
miR-29b and -29c. Finally these results are in line with those of Hendersonet al.[90] describing post-transcriptional regulation of MMP-2 and TIMP-2 protein levels and demonstrating a sharp increase in MMP-2 activation during airways remodelling in asthma.
TIMPs are key regulators of the activity of many metallopro-teinases including MMPs, ADAMs and ADAMTS. TIMP-1 mRNA upregulation during lung fibrosis has already been described as TIMP-2 and TIMP-3 mRNA were shown to be constitutively expressed [4,89]. TIMP-2 not only inhibits MMP-2 activity but is also involved in docking pro-MMP-2 to the cell surface where the enzyme is activated [91] by membrane-bound MMPs, including MMP-15 and MMP-24 [92], and by a second molecule of TIMP-2. TIMP-3 binds to the extracellular matrix Figure 6. Potential influence of miRNAs on immune response induced by OVA.In antigen presenting cells, MHC complexes are maturated in endosomes by lysosomal reductases while CTSE processes antigen (Ag), i.e. OVA. Finally, the MHC/antigenic peptide complex translocates to the plasma membrane and is presented to the TCR/CD3 complex on CD4+T helper cell surface. Activation of TCR/CD3 induces the activation of NF-kB through PKC activation and CARD11/BCL10/MALT1 complex recruitment. MiRNA modulation could occur through mmu-miR-690, -672 and -146b. Cross-linking of costimulatory receptors on the T helper cell with corresponding ligands, such as TNFRSF9 with TNFSF9, also induces NF-kB and regulators (MAPKs, JNK) of the activity of multiple transcription factors. Production of TNFSF9 could be under the control of mmu-miR-146b, thus regulating the T helper cells properties. ST, IT, LT: short, intermediate and long-term treatments, respectively. The observed up- ( ) and down- ( ) regulations of the expression of some specific miRNAs are reported.
and may be important in allowing excess matrix accumulation in asthmatic airways [93]. At LT, 6 different miRNAs potentially targeting TIMP-2 and TIMP-3 are significantly up or downreg-ulated which is highly susceptible to affect the complex array of interactions between MMPs and between MMPs and their targets (extracellular matrix macromolecules, cytokines…) and may represent a crucial regulatory switch during asthma disease.
Androgen Receptor Signalling Pathway. Several miRNAs regulated in asthma target mRNAs that are implicated in the Androgen Receptor Signalling Pathway (WP252). Although it could seem surprising, cross-talk between this pathway and regulatory cascades originating from growth factors (IGF1,
FGF2, EGF, TGFb) are well documented. In prostate and lung,
they have been shown to regulate several cell functions with direct implication in chronic asthma (such as apoptosis, survival, proliferation and differentiation [94,95]).
In this study, we also underlined the importance of interactions between modulated miRNAs during mouse model of asthma and transcription factors (SP1, POU2F2, PATZ1…), receptors (NRIP, NR3C1…), nuclear receptor co-factors (NCOR2, NCOA1, NCOA3, PIAS1, PIAS3, NROB1, PNRC1…) or signal transducers (IL6ST, RAN…) participating in the Androgen Receptor Signalling Pathway. These evidences support the hypothesis that, besides transcription factors only, miRNA or miRNA/transcription factors networks participate in the control of this pathway and of the release of IGF1.
Inflammatory Response Pathway. Recent reviews [99,100] have shown evidence that miRNAs play a role in the control of inflammation cascades and particularly in cytokines
regulation. Tumour necrosis factor-alpha (TNFa) promotes
inflammation and airway remodelling. It is intensely released in asthmatic airways by pro-inflammatory cells, including activated macrophages, but also by structural cells [101]. Its elevated levels in asthmatic patients seem mainly due to a massive release of the
preformed cytokine [102] rather than to an increased
transcription. No correlation between miRNA modulation and TNFawas made in this study. By contrast, the expression of its two main receptors, TNFRSF1A (TNF-R1) and TNFRSF1B (TNF-R2), is expected to be upregulated at ST and IT as a result of the downregulation of mmu-miR-690, -805 and -574-5p (at ST) and mmu-miR-29b, -29c, -152, -218 and 690 (at IT). This would Figure 8. Regulatory pathways regulated by miRNAs as determined by the TargetScan algorithm.Fifty-three pathways were identified at one time-point at least. While 30 pathways appeared to be modulated at only one stage of the disease (ST, IT or LT), 18 were regulated at 2 different time-points and 5 during the entire study. Stouffer’s method was used to identify significant enrichment for pathways annotations among predicted targets of modulated miRNA in the model. ST, IT, LT: short, intermediate and long-term treatments, respectively.
induce an enhanced receptor production and accumulation at cell surface, and could contribute to an amplification of this regulatory
cascade, in synergy with the massive release of TNFa. At LT,
mmu-miR-29c and -98 are downregulated but upregulation of mmu-miR-125b-5p and -574-5p, and progressive normalization of the levels of mmu-miR-218, -690 and -805 would then be part of the reduction of the inflammatory process at the late stage of the
asthma model through the modulation of TNFareceptors.
Downregulation of mmu-miR-29 members is strongly correlat-ed with Inflammatory Response Pathway (WP458) especially with the extracellular matrix components directly involved in fibrosing processes. These miRNAs are speculated to regulate the expression of type I and type III collagens but also the lamininc
chain LAMC1. Evidence that miR-29b attenuates expression of collagen genes by blocking their mRNA translation has already been described [103,104] and an inverse correlation between the expression of mmu-miR-29b and -29c and the synthesis of collagen type I and III is further evidenced here. This suggests that downregulation of mmu-miR-29 members coud be one of the causes of the subepithelial fibrosis observed in chronic asthma.
Fibronectin (FN1) is present in large quantities in fibrosing areas [105], precedes collagen type I deposition and is necessary for
pulmonary fibrosis to develop [106]. Surprisingly however, its mRNA is only slightly upregulated at IT and not at ST or LT [4]. This apparent discrepancy can probably be explained by the decrease of the post-transcriptional repression by miRNAs at each step of the progression of the disease [107-109]. Here we showed that several modulated miRNAs could potentially target Fn1 mRNA at the three time-points. All of them were downregulated: mmu-miR-1 and -805 at ST, mmu-miR-199a-3p, -200a and -429 at IT and mmu-miR-27a and -200b at LT, except mmu-miR-206 which was upregulated at LT.
Together with collagens and fibronectin, laminin is another key component of the extracellular matrix that is exceedingly accumulated in airway walls during remodelling processes in patients with severe bronchial asthma [110]. In this mouse model of asthma, various laminin chains (LAMA5, LAMB1, LAMC1 and LAMC2) expressions were predicted to be affected by many miRNAs. However, there is no clear tendency at ST and LT where targeting miRNAs are up- or downregulated in equal proportions. At IT, expressions of mmu-miR-29b, -29c, -152, -200a and -690 that potentially target laminincchain LAMC1 are inhibited.
The miRNAs implication in the regulation of the Inflammatory Response Pathway appears to occur principally through the Figure 9. miRNAs and MMP-2 activation.Panel A represents MMP-14 (MT1-MMP)-dependent activation pathway for MMP-2. TIMP-2 activates pro-MMP-2 by forming a complex that interacts with the MMP-14/TIMP-2 complex at the cell membrane. Activation of pro-MMP-2 occurs in a two step process: cleavage within the MMP-2 prodomain followed by an autocatalytic cleavage which results in the active 62 kD form. Panel B represents the presumed MMP-15 (MT2-MMP) and MMP-24 (MT5-MMP)-dependent activation pathway for MMP-2. Activation of pro-MMP-2 occurs in a two step process: cleavage within the MMP-2 prodomain in the absence of TIMP-2 followed by a second cleavage, enhanced by an unidentified secreted soluble protein which results in the active 62 kD form. The mechanism by which MMP-24 releases active MMP-2 is currently unknown. The intensive activation of MMP-2 contributes to collagen deposition and interstitial fibrosis. An excess of TIMP-2 and the extracellular matrix-anchored TIMP-3 contribute, respectively, to the degradation of pro-MMP-2 and to the inhibition of MMP-2. ST, IT, LT: short, intermediate and long-term treatments, respectively. The observed up- ( ) and down- ( ) regulations of the expression of some specific miRNA are reported.
regulation of extracellular matrix component expression rather than through the modulation of cytokines and their receptors, except for the TNF-areceptors.
IL-3 Signalling Pathway. In silico analysis predicted IL-3 Signalling Pathway (WP373) as regulated by miRNAs. Eosinophils activated by IL-3 contribute to T cell activation in allergic diseases [111] and play a critical role in the induction of airway hyperreactivity and the development of lesions that underpin chronic airway wall remodelling [112].
IL-3 induces transient association between paxillin (PXN) and vinculin (VCL), two cytoskeletal proteins necessary for the contractile response of smooth muscle cells as observed during asthma [113]. During the whole time course of the model, PXN is a potential target of several downregulated (mmu-miR-203, -218, -30b, -30c, -27a and -21) and upregulated (mmu-miR-20b, -466g, -30d and -145) miRNAs. At IT and LT, VCL is a potential target of 5 downregulated miRNAs (mmu-miR-21, -25, -29b, -29c and -92a). Besides VCL binding, PXN interacts with SRC and CRK family members [114], which leads to proliferation and differen-tiation processes in fibroblasts through the MAPK pathway or regulates the formation of physical links between the cytoskeleton and integrin proteins that mediate transmission of contraction forces [115]. It is of interest that a large number of modulated
miRNAs were pointed out to interact with SRC (mmu-miR-197 and -230), CRK and CRKL (mmu-miR-203, -497, -218, -320, -214, -328), and various MAPKs (4 miRNAs for MAPK1, 3, 8 and 14; 7 miRNAs for MAPK9; 13 miRNAs for MAPK7; see Tables S5-S10 for details).
IL-3 induces Toll-like receptors expression in dendritic cells [116] that then initiate the activation of T lymphocytes for specific antigens [117]. Genes implicated in Toll-like receptors signaling such as GSK3B (a glycogen synthase kinase), SOCS3 (a suppressor of cytokine signalling-3) and ATF2 (an activating transcription factor) were defined as targets of modulated miRNAs during all time-course of the mouse model of asthma, respectively miR-23a, -23b, -26b, -29b, -29c, -155 and -214 for Gsk3b; mmu-miR30b, -30c, -30d, -152, -203, -207, -218 and -455 for Atf2; mmu-miR30b, -30c, -30d, -152, -203, -207, -218 and -455 for Socs3.
YWHA proteins (tyrosine 3-monooxygenase/tryptophan 5-monooxygenase activation protein) act as adaptor proteins in cellular signaling and metabolism by regulating and coordinating a diverse array of cellular processes, such as cell cycle progression, apoptosis, protein trafficking, cytoskeleton rearrangements, me-tabolism, and transcriptional regulation of gene expression [118]. They can bind to GSK3 [119], implicated in Toll-like receptors Figure 10. Experimental protocol.Sensitization and short-term (ST), intermediate-term (IT) and long-term (LT) PBS/ovalbumin (OVA) exposure protocols. BALB/c male mice were sensitized on days 1 and 7 (ST) or 11 (IT and LT) by intraperitoneal injection of 10mg OVA. At day 22, mice were
subsequently exposed to PBS or OVA 1% aerosol for 30 min per day. For ST, aerosol challenge was performed for 7 consecutive days (grey box). For IT or LT, aerosol challenges were performed three or five times (black boxes) according to a pattern of 5-day inhalation (black boxes) followed by a 9-day time off (white boxes). Mice were sacrificed the day after last aerosol challenge.
signalling. For the three time-points, 23 modulated miRNAs (see Tables S5-S10 for details) could target mRNAs of three members of YWHA protein family: Ywhab, Ywhaq and Ywhaz. To our knowledge, the role of these proteins in asthma is not known.
The whole analysis for each time-point, including details on number of miRNA and miRNA-mRNA interactions in specific pathways is available in online supplemental data.
In conclusion, this work represents the first large scale study aiming at evaluating the implication of miRNAs during asthma, from early inflammation to chronically remodelled airways. Highly significant correlations between regulation of miRNAs expression and several biological processes or regulatory pathways have been found at each step of the evolution of allergen-induced asthma in mice. Similar results were obtained by comparing our data with two different databases using different computational analyses, further reinforcing the significance of this study. Although direct confirmation of the specific implicationin vivoof the most promising miRNA-mRNA pairs have yet to be performed, the miRNAs profiling data described in the present work are new information allowing a better understanding of molecular mechanisms participating in this complex and progres-sive pathology and might lead to novel therapeutic approaches targeting either some specific miRNAs of the regulatory processes identified here.
Methods
Mouse model of asthma
BALB/c mice were used following ‘‘Principles of Laboratory Animal Care’’ formulated by the National Society for Medical Research, and the experimental protocols were approved by the local animal ethical committee (University of Lie`ge) under the no. 03/158. Six- to 8-week old BALB/c male mice were sensitized on days 1 and 7 or 11 (see below) by intraperitoneal injection of 10mg of ovalbumin (OVA Grade III; Sigma-Aldrich, Schnelldorf, Germany) emulsified in aluminum hydroxide (AlumInject; Perbio, Erembodegem, Belgium). Animals were subsequently divided into 2 groups of six animals: 1 group of control mice was exposed to phosphate buffer saline (PBS) aerosol and the other experimental group was subjected to ovalbumin (OVA) aerosol 1% aerosol for 30 min. A three time-points, named ‘‘short-term’’ (ST), ‘‘interme-diate-term’’ (IT) and ‘‘long-term’’ (LT), exposure protocol was designed to reproduce the airway hyperresponsiveness, the inflammation phase and the remodelling process observed during the course of asthma development. At day 21, aerosols were generated daily by ultrasonic nebulizer (DeVilbiss 2000) and performed for 7 consecutive days (ST protocol). For IT or LT protocols, aerosols were performed three (IT) or five (LT) times according to a pattern of 5-day inhalation followed by a 9-day time off. After determination of airway reactivity, mice were sacrificed by cervical dislocation the day after last aerosol challenge. The experimental protocols are illustrated in Figure 10.
Lung tissue processing and RNA extraction
For each time-point experiment (ST, IT or LT), PBS-treated (n = 6) and OVA-treated (n = 6) mice were killed by cervical dislocation. Further to lung eosinophilia, differential cell counts were performed in bronchoalveolar lavages (BAL) in PBS- and OVA-treated mice. After sacrifice of mice, a cannula was placed in the trachea and a BAL was performed by gentle manual instillation and aspiration using 461 ml of 0.05 mM cold PBS-EDTA (Calbiochem, Germany). The BAL was centrifuged (250 g, 10 min, 4uC). The cell pellet was resuspended in 1 ml of PBS-EDTA. Total cells counts were obtained using a hemocytometer.
The differential cell counts were performed using morphological criteria on cytocentrifuged preparations (Cytospin) after staining with Diff-Quick (Dade, Belgium). Differential cell counts were performed by one observer unaware of the various experimental conditions.
Immediately after BAL, the right lobe of the lung was stored in liquid nitrogen. The left lobe was used for histological assessment of airway remodeling histology as previously described [4].
Tissue disruption was performed with a Mikro-Dismembrator in liquid nitrogen and tissue powder (50 to 100 mg) was directly homogeneized in 1 ml of Trizol reagent. Phase separation was performed according to reagent protocol. Total RNA was precipitated by an overnight incubation in 0.5 ml of isopropanol
at 280uC. Centrifugation (12,000 g, 10 min, 4uC) was then
performed and RNA pellet was washed twice by ethanol 75% and centrifugation (7,500 g, 5 min, 4uC). Total RNA pellet was briefly air-dried in a sterile hood, finally dissolved in RNase free water (50 to 100ml) and stored at280uC.
RNA quality control
Each total RNA sample concentration was determined using a NanoDrop ND-1000 spectrophotometer. The integrity of each total RNA extract was assessed with an Agilent 2100 Bioanalyzer and degraded samples were rejected. The passing criteria for use in miRNA microarray and quantitative real-time PCR was a 28S/ 18S rRNA ratio between 0.90 and 1.80 (maximum obtained). The presence of small RNA was evidenced by a clear peak at about 25 seconds.
miRNA microarray analysis
Microarray assay was performed using a service provider (LC Sciences, Houston, Texas). The assay started with 5mg total RNA
pools containing equal amount of RNA from individual lung (n = 6 per pool), which was size-fractionated using a YM-100 Microcon centrifugal filter (Millipore, Billerica, MA), and the isolated small RNAs (,300 nt) were 39-extended with a poly(A) tail using poly(A) polymerase. An oligonucleotide tag was then ligated to the poly(A) tail for later fluorescent dye staining (Cy3 and Cy5 were used for the two RNA pools, OVA versus PBS for each time-point, in a duplicate experiment). Hybridization was performed overnight on
a mParaflo microfluidic chip using a microcirculation pump
(Atactic Technologies, Houston, TX) [120]. On the microfluidic chip, each detection probe consisted of a chemically modified nucleotide coding a segment complementary to target microRNA (with mice probe content from miRBase, version 10.0, http:// microrna.sanger.ac.uk/sequences/) or other control RNA, and a spacer segment of polyethylene glycol to extend the coding segment away from the substrate. The detection probes were made byin situsynthesis using photogenerated reagent chemistry.
Hybridization used 100ml 66 SSPE buffer (0.90 M NaCl,
60 mM Na2HPO4, 6 mM EDTA, pH 6.8) containing 25%
formamide at 34uC. After RNA hybridization, tag-conjugating
Cy3 or Cy5 dyes were circulated through the microfluidic chip for dye staining. Fluorescence images were collected using a laser scanner (GenePix 4000B, Molecular Devices, Sunnyvale, CA) and digitized using Array-Pro image analysis software (Media Cyber-netics, Bethesda, MD). Data were analyzed by first substracting the background and then normalizing with a cyclic LOWESS filter (Locally-weighted Regression) [121]. For two color experi-ments (OVAversusPBS pools for each time-point), the ratio (log transformed) of the two sets of detected signals, andp-valuesof the
Real-time quantitative RT-PCR validation
In order to reassess the reproducibility of our mouse model asthma and to use in this study the previously described transcriptomic data [4], the expression of 8 genes regulated at least at one time-point was measured for each individual mouse.
Total RNA (1mg) was reverse transcribed using random primers
(Eurogentec, Belgium) and SuperScript III Reverse Transcriptase (Invitrogen) according to manufacturer’s protocol. cDNAs were then subjected to real time PCR using SYBR Green qPCR Mastermix buffer (Eurogentec, Belgium). Primers used to amplify Ccl8, Fcgr2b, Chia, Birc5, Cdc2a, Pon1, Arg1 and Mmp-12 have been previously described [4]. Expression levels of each mRNA were evaluated using comparative threshold cycle
(Ct) method, normalized to those of b2-microglobulin and
hypoxanthine guanine phosphoribosyl transferase 1 (house-keeping genes) for each condition (delta Ct). Experiments were done at least in duplicate. The fold change of each mRNA was calculated as a difference between mean values obtained for OVA- and PBS-treated mice at each time-point (delta delta Ct). The fold difference in expression was calculated using the 2-delta delta Ctmethod. Mean values of fold difference for each cohort used here were compared to those obtained previously [4] (Figure S1).
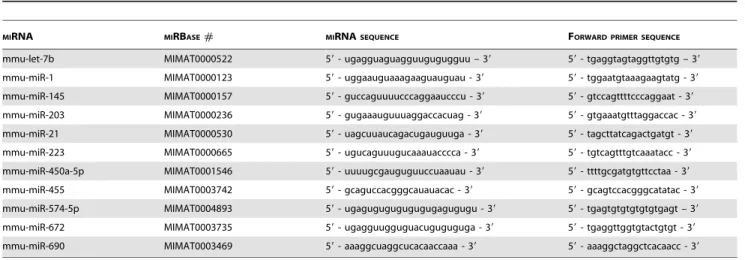
In order to validate miRNA microarray analysis and to evaluate inter-individual variation in each group of mice, real-time quantitative RT-PCR assays (QuantiMir RT Kit Small RNA Quantitation System, SBI System Biosciences, USA) were on individual lung RNA sample to confirm the differential expression of 14 miRNAs. The selection of the miRNAs is based on their potential role in the pathology of the lung (mmumiR1, 146b, -203, -21, -223, -29b, -29c) or on their high and significant differential expression in the model (mmumiR455, 5745p, -672, -690) or for their high (mmu-let-7b a, mmu-miR-145) or low (mmu-miR-450a-5p) signal intensity in microarray analysis. The protocol is based on poly(A) tailing and reverse transcription of small non-coding RNAs to provide cDNA synthesis of miRNA. A universal 39-tag sequence is incorporated during reverse transcrip-tion to enable miRNA expression analysis by quantitative PCR. The reverse sense primer is universal and provided by the kit. The forward sense primer is designed by using the sequence of the
mature miRNA (59-19 nucleotides) converted in DNA sequence
(Table 6). Forward LNA primers (Exiqon, Denmark) were used to amplify mmu-miR-146b, -29b and 29c in order to increase
specificity and discrimination that were not obtained with native DNA primers. Reactions are performed following manufacturer’s
protocol with 2mg of total RNA and SYBR Green qPCR
Mastermix buffer (Eurogentec, Belgium). Expression levels of each mature miRNA were evaluated using comparative threshold cycle (Ct) method, normalized to those of U6 small nuclear RNA (house-keeping gene) for each condition (delta Ct). The fold change (OVA-PBS means) of each miRNA was calculated and expressed as 22delta delta Ct. Mean values of fold difference for each cohort were compared to mean values obtained for pools analyzed by microarray hybridization.
mRNA microarray analysis
Microarray raw mRNA expression data were from [4] and are in full agreement with RT-qPCR data obtained in this study for new cohort of mice. Probe-level data was background-adjusted and normalized, and gene expression measurements were obtained with the robust multi-array average (RMA) method [122], as imple-mented in the Affy package of Bioconductor. For each of the three time points, the gene expression log ratios were computed between the PBS control and from two different OVA-treated pools. Genes
with a mean OVA/PBS log ratio more than 0.6 or less than20.6
were selected as up-regulated or down-regulated, respectively. These values correspond to genes regulated 1.52-fold up or down. When more than one expression value was present for a gene (multiple probe sets per gene), the gene was considered up- or down-regulated if the direction of change (up/down) was consistent between all probe sets, and at least one of the probe sets satisfied the -0.6/0.6 threshold on log ratios.
miRNA-mRNA correlation analysis
Potential correlations between miRNAs and mRNAs regulated at each time-point were determined by crossing the lists of modulated mRNAs and miRNAs with a database of miRNA target predictions. The list of candidates mRNA targets for each miRNA was retrieved from the MicroCosm Targets database Version 5 (http://www.ebi.ac.uk/enright-srv/microcosm), for-mely known as mirBase::Targets [12], that uses the miRanda algorithm [123] to identify potential binding sites for a given miRNA in gene sequences. All modulated miRNAs were represented in this database.
Fifteen modulated genes (among 1955 in total) were not predicted as targets of any miRNAs.
Table 6.Mature miRNA sequences and forward primers sequences for real-time quantitative PCR.
MIRNA MIRBASE# MIRNASEQUENCE FORWARD PRIMER SEQUENCE
mmu-let-7b MIMAT0000522 59- ugagguaguagguugugugguu – 39 59- tgaggtagtaggttgtgtg – 39
mmu-miR-1 MIMAT0000123 59- uggaauguaaagaaguauguau - 39 59- tggaatgtaaagaagtatg - 39
mmu-miR-145 MIMAT0000157 59- guccaguuuucccaggaaucccu - 39 59- gtccagttttcccaggaat - 39
mmu-miR-203 MIMAT0000236 59- gugaaauguuuaggaccacuag - 39 59- gtgaaatgtttaggaccac - 39
mmu-miR-21 MIMAT0000530 59- uagcuuaucagacugauguuga - 39 59- tagcttatcagactgatgt - 39
mmu-miR-223 MIMAT0000665 59- ugucaguuugucaaauacccca - 39 59- tgtcagtttgtcaaatacc - 39
mmu-miR-450a-5p MIMAT0001546 59- uuuugcgauguguuccuaauau - 39 59- ttttgcgatgtgttcctaa - 39
mmu-miR-455 MIMAT0003742 59- gcaguccacgggcauauacac - 39 59- gcagtccacgggcatatac - 39
mmu-miR-574-5p MIMAT0004893 59- ugagugugugugugugagugugu - 39 59- tgagtgtgtgtgtgtgagt – 39
mmu-miR-672 MIMAT0003735 59- ugagguugguguacuguguguga - 39 59- tgaggttggtgtactgtgt - 39
mmu-miR-690 MIMAT0003469 59- aaaggcuaggcucacaaccaaa - 39 59- aaaggctaggctcacaacc - 39
At each time-point, we determined all the miRNA-mRNA pairs such that the mRNA is predicted as a potential target of the miRNA and the miRNA and the mRNA are differentially expressed in opposite direction, i.e. the miRNA is down-regulated and the mRNA is up-regulated, or the opposite. Tables S2, S3, and S4 list all these pairs respectively at ST, IT and LT. The
p-valuesin these tables are thep-valuesassociated with the target prediction as described in [124] (only targets with ap-valuelower than 0.05 are included in the MicroCosm Targets database).
Pathway analysis
A pathway enrichment analysis was carried out taking into account both modulated miRNAs and mRNAs. A list of 117 pathways was downloaded from WikiPathways (http://www.
wikipathways.org, [125]). Predicted candidates mRNA targets for each differentially expressed miRNA were identified using two databases: MicroCosm Targets Version 5 (http://www.ebi.ac.uk/ enright-srv/microcosm) and TargetScan Version 4.2 (http:// www.targetscan.org).
For each pathway and each time-point, ap-value reflecting the enrichment of the pathway in modulated miRNA targets (with at least 1.5-fold, up or down) was computed as follows: we counted the total number of miRNA-gene pairs such that the miRNA is modulated, the gene belongs to the pathway and is a potential target of the miRNA. Ap-valuewas then associated to this number by computing the proportion of times (estimated from 1000 trials) a purely random selection of the modulated miRNAs (among the 566 miRNAs on the chip) gives a number of pairs as high as the
Table 7.Genes, species and their amplified 39UTRs with corresponding primers.
Gene Species 3’UTR size* Forward Primer Reverse Primer
Arid4b M. musculus 2385
GCCGTGTAATTCTAGA-acaacaaaaagaagggaaaagg
GTCTGCTCGAAGCGG-gaatttacggtttgatttggtg
Card10 M. musculus 1727
GCCGTGTAATTCTAGA-ggaggtgactgagaagaatgtcc
GTCTGCTCGAAGCGG-tctatgacaaactttaatgactcattg
Cd3g M. musculus 603
GCCGTGTAATTCTAGA-tgtgaaaactgcattgagctaaa
GTCTGCTCGAAGCGG-taggttatacttgatcttttaattttgtca
Cdca8 M. musculus 786
GCCGTGTAATTCTAGA-ctcccgggtcttcaagact
GTCTGCTCGAAGCGG-gacttaaaaccatggcaaactaaga
Col6a2 M. musculus 849
GCCGTGTAATTCTAGA-tggccttcccactgaccta
GTCTGCTCGAAGCGG-aacagggaggctcaaaacct
Ctse M. musculus 980
GCCGTGTAATTCTAGA-tgccctggatggaatcc
GTCTGCTCGAAGCGG-gatatttaaaatcaaatcagtttatgggtt
Ctsk M. musculus 759
GCCGTGTAATTCTAGA-agaggttctaggggcagcc
GTCTGCTCGAAGCGG-ttgtaaatgagatactttatttcaaataca
Dera M. musculus 848
GCCGTGTAATTCTAGA-cctggtcaaggaggaactagg
GTCTGCTCGAAGCGG-atttaaaaattcagcgatatccaca
Fst M. musculus 1410
GCCGTGTAATTCTAGA-aaaaaatgcctatgggattcc
GTCTGCTCGAAGCGG-tcactcatcatttatctacaaatacacatt
Gmnn M. musculus 980
GCCGTGTAATTCTAGA-gcgcgtcagctaccg
GTCTGCTCGAAGCGG-ttttacaatgttcaacaggaaattg
Il6 M. musculus 1090
GCCGTGTAATTCTAGA-ccaagaacgatagtcaattccag
GTCTGCTCGAAGCGG-aaatataatataatttatttgtttgaagacagtctaa
Lpin2 M. musculus 3069
GCCGTGTAATTCTAGA-cagactgtaggatatttactgtgaatcc
GTCTGCTCGAAGCGG-ttatcagtttatgttagtttattattgtaacattt
Mmp-15 M. musculus 1772
GCCGTGTAATTCTAGA-gcagcccagaaccctctc
GTCTGCTCGAAGCGG-aacactgtatttctgttttatttagaaatgat
Mmp-15 H. sapiens 1439
GCCGTGTAATTCTAGA-taacggtgctcaggggg
GTCTGCTCGAAGCGG-tttgccggctgtacaattta
Mmp-24 H. sapiens 2353
GCCGTGTAATTCTAGA-caggcccttcctcacca
GTCTGCTCGAAGCGG-cactctgtatttctgttttatttagaaa
Mmp-24 M. musculus 2318
GCCGTGTAATTCTAGA-caggtagcacccgcagc
GTCTGCTCGAAGCGG-gcaggttccagtgcattttatt
Nola2 M. musculus 1004
GCCGTGTAATTCTAGA-ggccgcgtggttcct
GTCTGCTCGAAGCGG-gttttataactttgagcaaatatattcatag
Nusap1 M. musculus 1400
GCCGTGTAATTCTAGA-cctcaactacaagccacacaaa
GTCTGCTCGAAGCGG-gctaccacattcagcttagcttt
Phb2 M. musculus 640
GCCGTGTAATTCTAGA-agagtacacagctgctgtagaagc
GTCTGCTCGAAGCGG-ggctttaagtaataaaaattttattgagaa
Scube2 M. musculus 836
GCCGTGTAATTCTAGA-attcagttcaagtccaatgaagg
GTCTGCTCGAAGCGG-tttaatcatcactgtttagaactcacac
Ube2c M. musculus 931
GCCGTGTAATTCTAGA-gcagttgccctttcctctc
GTCTGCTCGAAGCGG-acaaaacaatcaatgtgtatttatttaat