Instituto de Psiquiatria do Hospital das Clínicas da FMUSP - Instituto do Coração do Hospital das Clínicas da FMUSP. Funded by Fundação de Amparo à Pesquisa do Estado de São Paulo - FAPESP - E-mail: [email protected] Mailing address: Demétrio Ortega Rumi - Rua Cláudio, 213/61 - 05043-000 São Paulo, SP, Brazil - E-mail:
English version by Stela Maris C. e Gandour
Objective - To study cardiovascular alterations in young patients with no apparent organic disease who un-derwent electroconvulsive therapy.
Methods - The study comprised 47 healthy patients (22 males and 25 females) with a mean age of 30.3 years, who underwent electroconvulsive therapy. Ambulatory blood pressure monitoring and continuous electrocardio-graphic monitoring (Holter monitor) were performed du-ring 24 hours. Blood pressure and heart rate were asses-sed 4 hours prior to electric shock administration, during electric shock administration, and 3 hours after electric shock administration. Arrhythmias and alterations in the ST segment in 24 hours were recorded.
Results - On electroconvulsive therapy, a significant increase in blood pressure and heart rate was observed and the measurements returned to basal values after 25 minutes. Three females had tracings with depression of the ST seg-ment suggesting myocardial ischemia prior to and after elec-troconvulsive therapy. Coronary angiography was normal. No severe cardiac arrhythmias were diagnosed.
Conclusion - 1) Electroconvulsive therapy is a safe therapeutic modality in psychiatry; 2) it causes a signifi-cant increase in blood pressure and heart rate; 3) it may be associated with myocardial ischemia in the absence of coronary obstructive disease; 4) electroconvulsive thera-py was not associated with the occurrence of severe car-diac arrhythmias.
Key words: electroconvulsive therapy, blood pressure,
heart rate, arrhythmias, myocardial ischemia
Arq Bras Cardiol, volume 79 (nº 2), 155-60, 2002
Demetrio Ortega Rumi, Maria Cecília Solimene, Júlio Yoshio Takada, César José Grupi, Dante Marcelo Giorgi, Sérgio Paulo Rigonatti, Protásio Lemos da Luz,
José Antonio Franchini Ramires
São Paulo, SP - Brazil
Electrocardiographic and Blood Pressure Alterations During
Electroconvulsive Therapy in Young Adults
Electroconvulsive therapy is a modality of treatment that consists of inducing controlled convulsive crises through electric stimulation of the brain. In the past decade, its use has increased due to the failure of several medications to control refractory cases, due to contraindications to medi-cations, and due to the need to rapidly improve symptoms, such as when facing the imminent risk of suicide. The major indications for electroconvulsive therapy are the depres-sive disorders, the bipolar affective disorders (manic and de-pressive symptoms), and schizophrenia. Electroconvulsive therapy may also be indicated in anorexia nervosa, bulimia, epilepsy associated with a psychotic scenario, and in some cases of Parkinson’s disease to improve mood and extrapy-ramidal symptoms. In the cardiovascular system, electro-convulsive therapy causes a significant increase in blood pressure and heart rate. Even though these effects have been known since the 1950s, studies about its duration and intensity and also about the possible occurrence of episodes of arrhythmia and myocardial ischemia are very scarce.
The aim of this study was to assess the alterations re-sulting from electroconvulsive therapy in the cardiovascu-lar system of young adults (age range from 18 to 40 years) with no apparent systemic or cardiovascular disease. We assessed the behavior of blood pressure and heart rate, and also the possibility of triggering arrhythmias and myocardial ischemia in these patients.
Instituto do Coração of the Hospital das Clínicas of the Medical School of the University of São Paulo (InCOR-HC-FMUSP). The following procedures were performed: a detai-led anamnesis and physical examination, resting electrocar-diography, chest X-rays, and biochemical examinations. The biochemical examinations were as follows: fasting glycemia; serum measurements of sodium, potassium, urea, creatinine, and transaminases; complete hemogram; and coagulation study. In specific cases, other examinations were performed, such as Doppler-echocardiography, an exercise test, and cardiac catheterization. In addition, the patients underwent dental assessment, ophthalmoscopy, and neurological evaluation with computed tomography, when necessary.
The most common indications for electroconvulsive therapy were depression (50%) and schizophrenia (30%), bipolar disorders (10%), and others being less frequent.
The following patients were excluded from the study: patients with cardiac diseases (coronary artery disease, valvular heart diseases, cardiomyopathies, congenital heart diseases, pulmonary hypertension, arterial hypertension, and pacemaker implantation), and patients with noncardiac diseases associated with cardiovascular alterations (chro-nic pulmonary disease, diabetes, stroke, thyroid diseases, expansive cerebral processes, recent cerebral hemorrhage, glaucoma, retinal detachment, pheochromocytoma, and li-ver diseases). We also excluded from the study patients with persistent electrocardiographic alterations that could hinder the analysis of ventricular repolarization, such as al-terations of the ST segment during respiratory and postural maneuvers, marked left ventricular overload, intraventricular and atrioventricular conduction disorders, and the constant use of medications, such as beta-blockers, calcium channel antagonists, and psychotropics (benzodiazepines, tricyclic and tetracyclic antidepressants, antipsychotic agents of the class of the phenothiazines and butyrophenones). Me-dications were suspended 3 to 7 days prior to electrocon-vulsive therapy.
Methods
Electroconvulsive therapy was performed at the IPq-HC-FMUSP. All patients had been fasting for at least 8 hours, were not using a dental prosthesis, contact lenses, or any ornament, and were wearing proper clothing. The procedu-re room was provided with defibrillator and drugs necessa-ry for cardiopulmonanecessa-ry resuscitation. Electrodes were pla-ced in the patients’ temporal region and a peripheral vein was punctured for administration of anesthetics.
The patients underwent short-lasting general anes-thesia. Atropine was not used for preanesthesia induction to avoid bradycardia caused by atropine, which could inter-fere with the results, masking possible bradyarrhythmias during the procedure. Then, etomidate was administered as an anesthetic (0.2 to 0.3 mg/kg), because this drug does not cause electrocardiographic alterations or arterial hypotensi-on. Then, curarization with succinylcholine (0.5 mg/kg) was performed. The Guedel airway was used to optimize oxygen ventilation with a mask and Ambu bag during the convulsi-ve crisis; a protecticonvulsi-ve device was placed between the dental
arches. The mean duration of the convulsive crises was 38±5 seconds. Blood pressure, the electrocardiographic tra-cing, and the index of oxygen saturation were monitored before and during each convulsive crisis, because ventilati-on was not interrupted during cventilati-onvulsiventilati-on. After the crisis, the patients remained in a contiguous room to [OK? See change] recover from the anesthesia while under medical and nursing supervision.
Mectra and Thyratron devices were used to trigger the convulsive crises. The Mectra device (US household ver-sion) had waves of the fixed, biphasic, and short-pulse ty-pe, with 17 to 576 mC capacity, a constant current of 550-800 mA, 6 phases, and frequency of 0.5 to 2.0 seconds. The DGx model of the Thyratron had a basic exit mode of 25 to 504 mQ, an operational exit mode of 50 to 1,000 mQ, and load control calibrated in percentages.
All patients received food prior to being discharged from the hospital.
The patients were referred to the electrocardiology service, the ambulatory monitoring unit, and to the ambula-tory blood pressure monitoring service of InCor-HC/ FMUSP, at previously scheduled fixed hours to have their electrocardiology and blood pressure monitoring devices placed for measurements. The tape recorders were placed between 2 and 3 PM and remained with the patients for 24 hours, a period of time comprising the moment of the stimu-lus (electric shock), which usually occurred around 9 AM of the following day. The recordings of both methods were si-multaneous, so that the recording hours of the electrocar-diography and blood pressure measurement coincided. All patients and their family members were advised in regard to the procedure, and they filled out a report with information about behavior, meal and resting hours, and this report was delivered to the researcher on the following day.
Ambulatory blood pressure monitoring was program-med to take measurements every 10 minutes during 24 con-secutive hours, simultaneously with those of the electrocar-diographic recording period, using the Spacelabs 90207 de-vice (Spacelabs, Redmont, Washington, USA) programmed to obtain 6 blood pressure measurements per hour in mm Hg. To assess blood pressure behavior during administration of electroconvulsive therapy, the recording hours of Holter and ambulatory blood pressure monitoring were coupled. Once the recording was finished, the values obtained were analyzed with Spacelabs software, and the means and res-pective standard deviations of the measurements of systo-lic, diastosysto-lic, and mean blood pressures were obtained.
The moments chosen were 4 hours before and 3 hours after the administration of electric shock, zero (0) time being the moment the electric stimulus was triggered, ie, the mo-ment when the event buttons for ambulatory blood pres-sure monitoring and Holter monitoring were pressed. The measurements recorded every hour were analyzed and the arithmetic mean calculated; 6 measurements were taken every hour, and the means for systolic, diastolic, and mean blood pressure were calculated.
measure-ments were taken every 5 minutes during the half hour prior to and after electric shock administration, aiming at increa-sing the accuracy of the measurements taken close to elec-tric stimulus administration. For this purpose, the Dixtal device was used, and, of the noninvasive methods, it was considered more precise and less subjective than manual measurement with the ordinary sphygmomanometer. Two measurements were concomitantly taken in the half hour preceding and following the administration of electric shock - ambulatory blood pressure monitoring, and Dixtal - becau-se the ubecau-se of ambulatory blood pressure monitoring at 5-mi-nute intervals was not possible due to the calibration of the device. In addition, some patients became extremely agita-ted after the electric stimulus was triggered, hindering the regulation of the device for the moments very close to elec-tric shock administration.
Patients were monitored with a Marquette 8000 portable monitor with 2 channels and wave recording in modulated amplitude (Marquette, Milwaukee, WI, USA), which had a cassette tape for 24-hour continuous recording. On the day prior to the procedure, the monitor was turned on. Patients were advised to report the occurrence of episodes of pain, chest discomfort, or any other symptoms. Through a device of the tape recorder (the event button), the moment when the electric stimulus was triggered (moment zero, simultaneous with that of ambulatory blood pressure monitoring) could be determined. Two bipolar leads, CM5 and CM1, were used as follows: 1) CM5 lead – a positive electrode was placed on the 5th rib, exactly in the left anterior axillary line, and a negative electrode was placed on the right clavicle, right beside the sternum; 2) CM1 lead – a positive electrode was placed on the 4th right sternum-costal joint, and a negative electrode was placed on the left clavicle, right beside the sternum.
To obtain the neutral, an electrode was placed close to the last right costal arches next to the midclavicular line.
After the monitor was withdrawn, the tapes were ana-lyzed with a Marquette Laser SXP (1988) processor (Mar-quette, Milwaukee, WI, USA). The beats were classified and manually assessed.
In all patients, electrocardiographic tracings were ob-tained during postural changes and respiratory maneu-vers. Elevations of the ST segment = 1 mm and depres-sions of the ST segment with horizontal or descending morphology = 1 mm in relation to the basal line, measured 60 to 80 ms after the J point and during 1 minute or more, were considered ischemic alterations 2. The minimum inter-val admitted for the occurrence of 2 consecutive ischemic episodes was = 1 minute 2. Isolated alterations of the T wave were not considered 2.
Arrhythmias occurring during the 24-hour recording were diagnosed and manually analyzed.
In regard to heart rate, the values of maximum, medium, and minimum intensity were obtained from the recording tape of the Holter, and the mean values of those measure-ments were calculated using the reading program exactly at the same moments considered for blood pressure.
The quantitative variables were represented by mean and standard deviation. Different moments in each variable
were compared using the analysis of variance with repeated measurements (ANOVA) 3. When the result of the test showed a statistically significant difference between the ti-mes, the Newman-Keuls test, a type of multiple comparison procedure, was applied to identify those differences 3. The significance level of 0.05 (alpha = 5%) was adopted, and the descriptive levels (P) below that value were considered significant.
Results
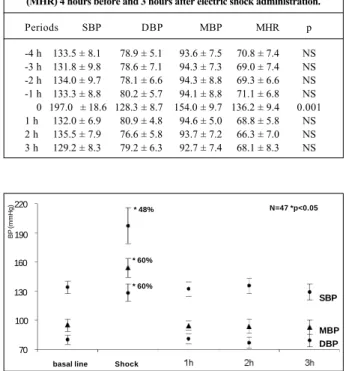
The hourly means of systolic, mean, and diastolic blood pressures from 4 hours prior to the procedure to 3 hours after electric shock administration are shown in table I and figure 1. The systolic and diastolic blood pressure va-lues measured every 5 minutes and 30 minutes before and after electric shock are shown in table II and figure 2.
The behavior of systolic, mean, and diastolic blood pressures was similar; a significant increase (p<0.001) oc-curred during the electric shock with return to basal levels 25 minutes after the electric shock (fig. 2).
In regard to the hourly means, the basal systolic blood pressure was 133 mm Hg; it increased to 197 mm Hg during convulsion and returned to 132 mm Hg in the hour following electric shock administration. The basal mean blood pressure was 94.1 mm Hg; it increased to 154 mm Hg during convulsion and returned to 94.6 mm Hg in the hour following electric shock administration. The basal diastolic blood pressure was 78.9 mm Hg; it increased to 128.3 mm Hg
Table I - Means and standard deviations of systolic (SBP), diastolic (DBP), and mean (MBP) blood pressures, and of mean heart rate (MHR) 4 hours before and 3 hours after electric shock administration.
Periods SBP DBP MBP MHR p
-4 h 133.5 ± 8.1 78.9 ± 5.1 93.6 ± 7.5 70.8 ± 7.4 NS -3 h 131.8 ± 9.8 78.6 ± 7.1 94.3 ± 7.3 69.0 ± 7.4 NS -2 h 134.0 ± 9.7 78.1 ± 6.6 94.3 ± 8.8 69.3 ± 6.6 NS -1 h 133.3 ± 8.8 80.2 ± 5.7 94.1 ± 8.8 71.1 ± 6.8 NS 0 197.0 ± 18.6 128.3 ± 8.7 154.0 ± 9.7 136.2 ± 9.4 0.001 1 h 132.0 ± 6.9 80.9 ± 4.8 94.6 ± 5.0 68.8 ± 5.8 NS 2 h 135.5 ± 7.9 76.6 ± 5.8 93.7 ± 7.2 66.3 ± 7.0 NS 3 h 129.2 ± 8.3 79.2 ± 6.3 92.7 ± 7.4 68.1 ± 8.3 NS
SBP
MBP DBP
* 48%
* 60%
* 60%
N=47 *p<0.05
BP (mmHg)
Fig. 1 - Means of the systolic (SBP), mean (MBP), and diastolic (DBP) blood pressu-res before (basal line), during, and after electric shock administration. During elec-tric shock administration, a significant increase in BP as compared with that of other moments was observed.
basal line Shock 220
190
130
100
during electric shock and returned to 80.9 mm Hg in the hour following electric shock administration. In the 3 hours follo-wing electric shock administration, blood pressure levels did not change.
In the period between the 30 minutes preceding and the 30 minutes following the electric shock, systolic, mean, and diastolic blood pressures also behaved similarly: sys-tolic blood pressure increased from 135.9 mm Hg (5 minutes before) to 197 mm Hg during the electric shock (a 48% increa-se) and gradually returned to 137.3 mm Hg (25 minutes after); and diastolic blood pressure increased from 80.6 mm Hg (5 minutes before) to 128.3 mm Hg during the electric shock (a 60% increase) and returned to 80.0 mm Hg (25 minutes after). The heart rate also showed a significant increase during electric shock administration (p<0.001): basal mean heart rate increased from 70.0 bpm to 136.2 bpm during electric shock, and returned to 68.8 bpm in the following hour. The 5-minute means increased from 73 bpm (5 minutes before the shock) to 136 bpm during electric shock, and returned to 73.2 bpm (25 minutes after). In the 3 hours following the electric shock, the mean heart rate was equal to the basal one. Data about heart rate are shown in tables I and II, and figures 3 and 4.
Analyzing the electrocardiographic tracing, 3 females
aged 23, 33, and 36 years had diagnostic alterations of myo-cardial ischemia, characterized by depression of the ST seg-ment between 1.5 and 3 mm, of horizontal or descending morphology, occurring before, during, and after electrocon-vulsive therapy (fig. 5). On coronary angiography, the 3 pa-tients had no obstructive lesions or anomalies of origin or trajectory in their coronary arteries.
Of the patients studied, 9 (19%) had isolated and sporadic supraventricular or ventricular extrasystoles. During electro-convulsive therapy, no other arrhythmias were observed. - 30min-25min-20min-15min-10min-5minShock+5min+10min+15min+20min+25min+ 30min
60% *46%
SBP
DBP
N=47 *p<0.05
BP (mmHg)
Fig. 2 - Systolic and diastolic blood pressures 30 minutes prior to electric shock administration. Note the significant increase during electric shock administration and the progressive return to basal line values after 25 minutes.
Table II - Means of the systolic (SBP) and diastolic (DBP) blood pressures, and mean heart rate (MHR) 30 minutes before, during,
and 30 minutes after the electric shock administration.
SBP DBP MHR p
Time Mean ± SD Mean ± SD Mean ± SD -30 min 129.0 ± 7.4 78.5 ± 4.8 70.7 ± 6.2 NS -25 min 131.8 ± 6.2 78.7 ± 5.0 70.3 ± 6.0 NS -20 min 134.2 ± 9.6 80.8 ± 4.8 74.3 ± 7.3 NS -15 min 132.7 ± 7.0 80.6 ± 6.4 72.1 ± 6.5 NS -10 min 133.6 ± 8.3 79.5 ± 6.2 68.9 ± 5.5 NS -5 min 135.9 ± 6.7 80.6 ± 5.7 73.0 ± 8.2 NS 0 min 197.0 ± 18.6 128.3 ± 8.7 136.2 ± 9.4 0.001 5 min 185.7 ± 15.8 110.4 ± 12.4 113.2 ± 17.2 0.001 10 min 169.3 ± 19.1 99.9 ± 12.9 96.7 ± 16.6 0.001 15 min 153.4 ± 18.5 93.2 ± 11.7 87.3 ± 12.6 0.001 20 min 143.4 ± 16.2 84.5 ± 9.2 79.2 ± 11.9 0.001 25 min 137.3 ± 11.2 80.0 ± 8.2 73.2 ± 9.1 NS 30 min 133.6 ± 8.3 80.6 ± 5.5 70.4 ± 7.3 NS
- 30min-25min-20min-15min-10min-5minShock+5min+10min+15min+20min+25min+ 30min
* 86%
N=47 *p<0.05
BP (mmHg)
Mean HR
Fig. 4 - Mean heart rate (HR) 30 minutes before electric shock administration. Note the peak of 136 bpm (an 86% increase) during shock administration and the progressive return to basal line values after 25 minutes.
* 91%
N=47 *p<0.05
BP (mmHg)
Fig. 3 - Evolution of the mean heart rate (HR) prior to, during, and after electric shock administration. Note the significant increase (86%) in HR during shock administra-tion (136 bpm) in regard to that of other moments (mean of 77 bpm).
basal line Shock
Fig. 5 - Graphs depicting the tendency of the ST segment during the 24-hour Holter monitoring of a 23-year-old female patient. Episodes of ST segment changes prior to (A), during (B), and after (C) electric shock administration are observed. The arrows indicate the moment of electric shock administration with sinus tachycardia (180 bpm) and a 1.8-mm depression of the ST segment (B). CM5 and CMf- Holter leads; HR- heart rate; BPM- beats per minute.
HR
160
140
100
80
Discussion
In the present study, we chose ambulatory monitoring to assess blood pressure, because this method has been definitively incorporated into clinical practice, and a large number of publications exist about this subject. Standardi-zation and validation of the method are well established 4-7. Its application is justified, especially because it enhances the understanding of the variations experienced by blood pressure during 24 hours, because of the several possibili-ties of studying and understanding the mechanisms of blood pressure control, mainly in stressful situations. It also allows assessing the efficacy of the antihypertensive therapy being used.
It is worth pointing out that the recorder used for am-bulatory blood pressure monitoring takes approximately 20 to 30 seconds to measure blood pressure; therefore, the values obtained may not reflect the actual value of blood pressure during electric shock. Perhaps the most accurate procedure for that moment would be the invasive measure-ment of blood pressure. However, for the other momeasure-ments, that procedure would be unfeasible, because it does not allow the patient to follow his daily routine. To minimize this problem, we took measurements every 5 minutes with the Dixtal device. On the other hand, the results of ambulatory blood pressure monitoring are largely accepted to assess the impact of certain events, such as ischemic episodes, on blood pressure 7.
Considering the assessment of the electrocardiogra-phic tracing, we chose to perform long-lasting electrocardio-graphy (Holter monitoring), which is useful in analyzing heart rate, arrhythmias, and myocardial ischemia for prolon-ged periods. This method allows the correlation of clinical events with electrocardiographic alterations during wakeful-ness and sleep; its use has been largely accepted in the lite-rature 2. A modulate amplitude device with direct recording and no phase distortion was used, with a frequency response of 0.5 Hz, adequate for reproducing the ST segment 2,8.
In the present study, we observed that our patients’ variables behaved homogeneously, ie, with no important variation in the measurements of blood pressure and heart rate in the period of time preceding the electric shock, in all intervals considered, but with a significant increase at the moment the stimulus was triggered.
Petrides and Fink 9 championed the theory that in-creases in blood pressure values occur due to myotonic re-flexes, to release of epinephrine from the adrenal medullae, and to direct stimulation of the sympathetic nervous system with release of norepinephrine. Values of circulating cate-cholamines of up to 15 times the basal level right after trig-gering the electric stimulus have been reported. Our study did not aim at analyzing the mechanisms of cardiovascular alterations during electroconvulsive therapy; however, the increase found in blood pressure and heart rate during elec-tric shock administration are in accordance with those re-ported in the literature, and may be due, at least partially, to sympathetic hyperactivity.
In our case series, we observed individual values of around 250 mm Hg for systolic blood pressure, 162 mm Hg for diastolic blood pressure, and heart rate of 172 bpm during the electric shock administration. Other patients showed smaller values, such as 150 mm Hg, 110 mm Hg, and 123 bpm, for the systolic and diastolic blood pressures, and heart rate, respectively. These variations show how the res-ponse to acute stress may vary from one patient to another, but all variations are statistically significant when the va-lues of the pre- and postshock periods of time are compared with those of the moment of triggering the stimulus for each patient. Recently, Maneksha and Zervas 10 obtained values of up to 310 mm Hg for systolic blood pressure in previously normotensive patients undergoing electroconvulsive therapy. Rasmussen 11 reported variations of approximately 155±3% and 164±9% for systolic blood pressure and heart rate, respectively.
Cochkey and Conti 12 reported that, after spontaneous convulsions (not triggered by an electric stimulus), the patients did not behave the same way in regard to variation in blood pressure and heart rate as compared with patients with crises induced by electroconvulsive therapy; after spontaneous convulsions, the values were lower. Another interesting fact, considering the study of these authors, was that patients undergoing electroconvulsive therapy and not experiencing convulsion (frustrated crisis) showed cardio-vascular responses with an important increase in blood pressure and heart rate levels. These findings stress the controversial question in the literature, which is defining whether the cardiovascular alterations result from the electric stimulus or from the convulsion itself.
In addition to the alterations in blood pressure and heart rate due to the mechanisms cited, electroconvulsive therapy could have the potential of triggering arrhythmias, such as ventricular and supraventricular extrasystoles, atrioventricular and intraventricular conduction disorders, and myocardial ischemia.
In the present study, electroconvulsive therapy did not trigger arrhythmias, probably because the individuals were young and healthy.
redu-1. CID 10, décima revisão (1993), tradução Centro colaborador da OMS para classificação das doenças em Português, 2 ed –São Paulo, EDUSP,1997. 2. Solimene MC. Isquemia silenciosa após infarto do miocárdio não complicado.
Estudo em indivíduos assintomáticos. São Paulo, 1990. Tese de Livre Docência Faculdade de Medicina da Universidade de São Paulo.
3. Winer BJ. Statistical Principles in Experimental Design. New York, NY: Mc Graw-Hill Book, 1971: 261-308.
4. Consensus document on non-invasive ambulatory blood pressure monitoring J. Hypertension 1990; 19: S1-S4.
5. II Consenso Brasileiro para o uso da Monitorização Ambulatorial da Pressão Arterial. J Bras Nefrol 1997; 3: 237-49.
6. O’Brien, Atkins N, Staessen J. State of the marketing. A review of ambulatory blood pressure monitoring devices. Hypertension 1995; 26: 835-42. 7. Cesar LAM. Estudo da isquemia miocárdica através da eletrocardiograma de
longa duração em pacientes com angina instável. avaliação do comportamento da pressão arterial durante os episódios isquêmicos. Tese de Livre-Docência. Faculdade de Medicina da Universidade de São Paulo. São Paulo,1996. 8. Schulter P. Magnetic tape recording and playback for ST segment analysis. J
Electrocardiol 1988(suppl): S20-S6.
9. Petrides G, Fink M. Choosing a dosing strategy for electrical stimulation in ECT. J Clinical Psychiatry 1996; 57: 487-8.
10. Maneksha F, Zervas I. Trimethaphan (Arfonad) control of hypertension and tachycardia during electroconvulsive therapy: a double-blind study. J Clin Anesth, 1996; 8: 104-9.
11. Rasmussen KG. Electroconvulsive therapy in patients with aortic stenosis. Convuls Ther 1997; 13: 196-9.
12. Cochkey GH, Conti CR. Electroconvulsive therapy-induced transient T-wave invesions on ECG. Clin Cardiol 1995; 18: 418-20.
13. Gardner MW, Kellner CH. Safe administration of ECT in a patient with a cardiac aneurysm and multiple cardiac risk factors. Convuls Ther 1997; 13: 200-3.
References
14. Stern L, Dannon PN, Hirschmann S, et al. Aminophilline increases seasure lengh during electroconvulsive therapy. J ECT 1999; 15: 252-7.
15. Tanaka, N, SaitoY. Effects of thiopental and sevoflurane on hemodynamics during anesthetic management of electroconvulsive therapy. Masui 1997; 46: 1575-9.
16. Swartz CM. Disconnection of eletroencefalographic motor and cardiac evidences of ECT seizure. Convuls Therapy 1996; 12: 25-30.
17. Solimene MC, Lage SG, Ramires JAF. Insuficiência coronariana em pacientes com coronárias normais. A persistência de um desafio. Arq Bras Cardiol 1993; 60: 265-8.
18. Welch CA, Drop LJ. Cardiovascular effects of ECT. Convuls Therapy 1989; 5: 35-43. 19. Partridge. Is the cardiovascular response to electroconvulsive therapy due to the electricity or the subsequent convulsion? Anesthesia Analg 1991; 75: 706-9. 20. Kovac AL, Goto H. Evaluation of esmolol infusion in controlling increases of
heart rate and blood pressure during electroconvulsive therapy. Anesthesio-logy 1988; 69: A895.
21. Zvara DA, Brooker RF, McCall WV, et al. The effect of esmolol on ST-segment de-pression and arrhythmias after electroconvulsive therapy. Convuls Ther 1997; 13: 165-74.
22. Rumi DO, Takada JY, Solimene MC. Efeitos sobre os sistemas orgânicos, avaliação clínica e contra-indicações. In: Rigonatti SP, Rosa MA - Indicação e prática da eletroconvulsoterapia. São Paulo: Lemos Editorial & Gráficos Ltda, 2000.cap.II: .37-52.
23. Gomez J, Dally P. Intravenous tranquillisation with ECT. Br J Psychiatry 1975; 127: 609-11.
24. Kovac AL, Goto H. Pardo MP, Arakawa K. Esmolol bolus and infusion attenua-tes increases in blood pressure and heart rate during electroconvulsive therapy. Can J Anaesth 1990; 37: 58-62.
25. Devanand DP, Fitzsimons L, Prudic J, Sackeim HA. Subjective side effects du-ring electroconvulsive therapy. Convuls Ther 1995; 11: 232-40.
cing the sympathetic overload on the cardiovascular sys-tem, did not reduce the incidence of alterations in the ST segment. In the present study, we observed the occurrence of depression of the ST segment indicating myocardial is-chemia prior to, during, and after the electric shock in 3 patients. These patients were asymptomatic females of childbearing age with no antecedents of coronary disease, and with normal electrocardiographic and echocardiogra-phic findings at rest. We chose to perform coronary angio-graphy for anatomical diagnosis, due to the possibility of congenital anomaly of the coronary arteries and also be-cause the patients required more sessions of electroconvul-sive therapy. Coronary angiography revealed normal coro-nary arteries. As the diagnostic recordings of probable is-chemia occurred prior to, during, and after electroconvulsi-ve therapy, we formulated the hypothesis that they might not represent actual ischemia or might represent cases in which the clinical evidence of ischemia was not confirmed by the angiographic findings 17. In any case, the prognosis of these individuals is good 17, and no contraindication to the continuation of electroconvulsive therapy exists.
In regard to heart rate, some authors reported a signifi-cant reduction in the values right after electric shock. This reduction was attributed to vagal action immediately after the sympathetic discharge triggered by the electric stimulus of electroconvulsive therapy 18. Therefore, those authors recommended the use of atropine prior to the procedure. In the present study, atropine was not used, and no bradyar-rhythmias were observed.
Considering the possible initial parasympathetic sti-mulus, other authors disagree with the use of beta-blo-ckers to attenuate the hypertensive peak of electrocon-vulsive therapy, because the action of those medications indirectly potentiates the vagal effect and can increase the probability of asystolia 19. The use of drugs that attenuate the hypertensive peak and tachycardia occurring during the electroconvulsive-therapy sessions is still very con-troversial 20,21.
Clinical and psychiatric follow-up is essential for the safety of the procedure 22. Lack of adequate control of blo-od pressure and heart rate during electroconvulsive thera-py may lead to important consequences, such as an increa-se in the risks of sudden death, acute myocardial infarction, meningeal hemorrhage, and strokes. The excessive increase in blood pressure may prolong the period of cognitive disorders in some patients, mainly the elderly, due to the increase in cerebral edema and the passage of neurotoxic macromolecules through the blood-brain barrier during ce-rebral hyperperfusion 23-25.