INTRODUCTION
Obesity is a life-threatening accumulation of abnormal or exces-sive amounts of fat in the body. Individuals with a body mass index (BMI) over 30 kg/m2 are classiied as obese(1). Epidemiological studies
have shown that 10% of the adult population of the world is obese(2).
Obesity is a systemic pathology that afects many organs, and various chronic diseases (cardiovascular diseases, diabetes mellitus, and mus-culoskeletal disorders) are associated with obesity(3,4).
Few studies have focused on the ophthalmic efects of obesity. Many previous studies have investigated the correlation between obesity and diabetic retinopathy, cataract, age-related maculopathy,
and glaucoma(5-8). However, the efects of obesity on retrobulbar
blood low have not been investigated by color Doppler ultrasound (CDU) to date.
ABSTRACT
Purpose: To evaluate intraocular pressure (IOP) and extraocular orbital vessels with color Doppler ultrasound (CDU) and investigate the effects of obesity on retrobulbar blood flow.
Methods: Fifty-nine patients were included in this prospective study. Patients were divided into two groups according to body mass index: Group 1 (31 obese patients) and Group 2 (28 non-obese patients). IOP was measured with a Goldmann applanation tonometer, and CDU was used to evaluate the retrobulbar vessels. Results: The meanIOP was 18 ± 6.68 mmHg in the obese group and 13.71 ± 1.60 mmHg in the control group (p<0.001). When the CDU values for the central retinal artery were compared between the groups, the pulsatility index was found to be significantly lower in the obese group than in the control group (p<0.001). When the CDU values for the ophthalmic artery (OA) were compared between the groups, the peak systolic velocity (p<0.001) and end-diastolic velocity (p=0.002) values were found to be significantly lower in the obese group than in the control group. Conclusions: Obese patients have a higher mean IOP and lower flow velocity than non-obese patients. Increased IOP together with decreased retrobulbar blood flow, particularly in obese individuals, may increase the risk of glaucoma development.
Keywords: Ultrasonography, Doppler, color; Intraocular pressure; Obesity/com-plications; Hemodynamics; Blood low velocity; Blood vessels/diagnostic imaging; Ophthalmic artery/diagnostic imaging; Eye/blood supply; Ultrasonogra phy/ me thods
RESUMO
Objetivo: Avaliar a pressão intraocular (PIO) e vasos orbitários extraoculares com ultrassom Doppler colorido (UDC) e investigar os efeitos da obesidade sobre o fluxo sanguíneo retrobulbar.
Métodos: Cinquenta e nove pacientes foram incluídos neste estudo prospectivo. Os pacientes foram divididos em dois grupos de acordo com o índice de massa corpo ral (IMC): Grupo 1 (31 pacientes obesos) e Grupo 2 (28 não obesos). As pressões intraocu-lares (PIOs) foram medidas com tonômetro de aplanação de Goldmann e o UDC foi utilizada para a avaliação de vasos retrobulbar.
Resultados: As PIOs foram 18 ± 6,68 mmHg nos pacientes obesos e 13,71 ± 1,60 mmHg nos grupos controle (p<00,001). Quando os valores da artéria central da retina (ACR) foram comparados entre os grupos controle e obeso. O índice pulsátil (PI) foi marcadamente menor no grupo obeso (p<00,001). Quando os valores da artéria oftálmica (AO) dos grupos obesos e de controle foram comparados. Os valores de Velocidade do pico sistólico (PSV) (p<00,001) e velocidade diastólica final (EDV) (p=00,002) foram significativamente mais baixos no grupo obeso.
Conclusão: Pacientes obesos têm maior PIO do que os pacientes não obesos. Os pacientes obesos têm diminuição nas velocidades de fluxo da AO. O aumento da PIO. Juntamente com a diminuição do fluxo sanguíneo retrobulbar, especialmente em indivíduos obesos, pode aumentar o risco de desenvolvimento de glaucoma.
Descritores: Ultrassonografia doppler em cores; Pressão intraocular; Obesidade/ com plicações; Hemodinâmica; Velocidade do fluxo sanguíneo; Vasos sanguíneos/ diagnóstico por imagem; Artéria oftálmica/diagnóstico por imagem; Olho/irrigação sanguínea; Ultrassonografia/métodos
Nowadays, CDU is an important method for evaluating hemo-dynamic alterations in retrobulbar vascular structures because it is non-invasive, quick, does not require drug therapy, and has reliable and reproducible outcomes(9,10).
Our aim was to evaluate intraocular pressure (IOP) using a tono-metry device and study the extraocular orbital vessels with CDU to investigate the efects of obesity on retrobulbar blood low.
METHODS
S
TUDYDESIGNFrom September 2014 to September 2015, 31 obese patients
with a mean BMI of 50.39 kg/m2 admitted to general surgery clinic to
undergo bariatric surgery were recruited into the study. Twenty-eight
Effects of obesity on retrobulbar flow hemodynamics:
color Doppler ultrasound evaluation
Efeitos da obesidade na hemodinâmica do luxo retrobulbar: avaliação por ultrassom doppler colorido
Bülent ÇekiÇ1, İclal ErdEm Toslak1,2, BErna doğan3, Tuğrul Çakır4, muhammEd kazım Erol3, nurullah BülBüllEr4
Submitted for publication: August 2, 2016 Accepted for publication: January 16, 2017
1 Department of Radiology, Antalya Training and Research Hospital, Antalya, Turkey. 2 Department of Radiology, Loyola University Medical Center, Chicago, IL, USA. 3 Department of Ophthalmology, Antalya Training and Research Hospital, Antalya, Turkey. 4 Department of General Surgery, Antalya Training and Research Hospital, Antalya, Turkey.
Funding: No specific financial support was available for this study.
Disclosure of potential conflicts of interest: None of the authors have any potential conflict of interest to disclose.
Corresponding author: Bülent Çekiç. Department of Radiology. Antalya Training and Research Hospital - Antalya. 071000 - Turkey - E-mail: [email protected]
healthy controls with a BMI of 18.5 kg/m2 to 24.9 kg/m2 were included in the study. Those with known retinal vascular diseases, a history of macular degeneration, or prior ophthalmologic surgery were exclu-ded from the study. We only incluexclu-ded white individuals in the present
study because retrobulbar low is likely inluenced by ethnicity(11).
B
ODYMASSINDEXCALCULATIONTo determine the BMI of the obese patients and control subjects, each individual’s body mass (kg) was divided by the square of their
height (m2). According to the World Health Organization
Classii-cation, BMI values between 18.5 kg/m2 and 24.9 kg/m2 indicate a
normal weight, whereas BMI values above 30 kg/m2 are considered
as obesity.
O
PHTHALMOLOGICIMAGINGAll individuals underwent visual acuity tests using a Snellen chart, biomicroscopic examination of the anterior segment, and in direct biomicroscopic examination to evaluate the posterior segment following pupil dilation. IOP was measured with a Goldmann appla-nation tonometer (Nikon, Tokyo, Japan). All measurements were performed between 09:00 AM and 12:00 AM by the same ophthal-mologist, and the mean of three successive measurements was cal-culated. Ocular blood flow and IOP measurements were performed on the same day.
Optical coherence tomography (OCT) imaging was performed on all individuals by spectral domain OCT (SD-OCT) imaging using
a Cirrus HD-OCT (Carl Zeiss Meditec, Inc., Dublin, CA, USA)(11). On
SD-OCT examination, the optic disc area, optic rim area, cupping area, and vertical and horizontal cup/disc (C/D) ratio were measu-red, and both disc symmetries were evaluated. Those with a C/D ratio over 0.5 and significant loss in visual field were excluded from the study.
S
YSTEMICDISEASESObese individuals are predisposed to comorbidities that can in-terfere with retrobulbar hemodynamics, such as diabetes mellitus with
or without diabetic eye complications and arterial hypertension(12-14).
Therefore, from those co-morbidities, all individuals were screened for abnormal values of glycated hemoglobin (Hba1c) and blood pressure (brachial arterial pressure or BAP). HbA1c levels relect the mean glucose concentration over the previous 8-12 weeks. The cutof level for Hba1c was 42 mmol/mol (6%), and individuals with a higher Hba1c than 6% were considered to have impaired glucose regula-tion (tolerance or diabetes mellitus) and therefore excluded from the study (n=2). Since intergroup diferences in blood pressure may afect ocular blood low, we tried to keep the systolic and diastolic blood pressures of the obese and control groups within the same range. The blood pressure measurements were taken at the primary care center where their family physicians work. They were followed up for 1 week, and their blood pressure was measured twice daily at 9 am and 6 pm. Those with a higher systolic pressure than 140 mmHg and a higher diastolic pressure than 90 mmHg were considered hypertensive, and thus excluded from the study (n=3). Two partici-pants had both elevated blood pressure and Hba1c levels. A total of 10 patients with possible diabetes, hypertension, and elevated cup/disk ratio were thus excluded from the study, and consequently, 59 of 69 patients were included in the study.
O
CULARCOLORDOPPLERULTRASONOGRAPHYAll cases were examined in our Radiology Department using a HI VISION Preirus (Hitachi, Tokyo, Japan) CDU device. CDU examina-tion was performed with the patients lying in the supine posiexamina-tion and their eyes closed; the paraocular technique was used. All radiological examinations were performed by the same radiologist (B.C.). With the eyes closed, methyl cellulose was applied on the eyelids, and B-mode
ultrasonography was performed using a (5-13 MHz) linear probe without compressing the eyelids. Following the gray-scale examina-tion, CDU was performed. We took special care not to exert pressure on the eye globe with the ultrasound probe.
The eye was examined in transaxial, sagittal, and oblique sections. Intraocular, retrobulbar, and intraorbital anatomical structures were assessed by gray-scale ultrasonography, and the retrobulbar vessels were then examined using CDU. The patient was asked to look in the contralateral direction to allow the ophthalmologist to trace the retrobulbar course of the ophthalmic artery (OA). The OA is located approximately 20 mm posterior to the globe, below or above the optic nerve, and the central retinal artery (CRA) is found approxima-tely 10 mm from the optic nerve in the retrolaminar region. The scan-ning angle is easily corrected in this region because the vein follows a straight course. The angle of the cursor was kept parallel to the blood low at all times, at between 30° and 60°. The Doppler sample volume was 1.5 mm for the OA and 1 mm for the CRA depending on the diameter of the examined artery.
We did not perform CDU evaluation of the short posterior ciliary arteries (SPCAs) in this study because of the small size and extreme tortuousness of these vessels, which result in low reliability of any angle correction. Further, SPCAs cannot be measured individually by CDU. The anatomy of these vessels is highly variable between diferent individuals and both anastomoses and narrowing are
com-mon(15,16); therefore, we did not include CDU evaluation of SPCAs. We
standardized the Doppler parameters for all individuals as follows: Doppler wall ilter=150 Hz; Doppler gain=400; pulse repetition frequency=7k/6.5 MHz.
Peak systolic velocity (PSV), end-diastolic velocity (EDV), pul-satility index (PI=[PSV-EDV]/mean velocity), and resistive index (RI=[PSV-EDV]/PSV) were measured in all studied arteries.
Time-ve-locity waveforms of the OA and CRA are shown in figure 1 Aand 1 B,
respectively.
S
TATISTICALANALYSISData were analyzed using the Statistical Package for the Social Sciences (version 18.0 for Windows; SPSS Inc., Chicago, IL, USA). Con-tinuous variables are presented as the mean and standard deviation, and categorical variables as percentages and frequency distribution. Normality testing was performed using the Kolmogorov-Smirnov and Shapiro-Wilk tests. Comparison of continuous variables between
independent groups was performed using Student’s t-test and the
Mann-Whitney U test, and comparison of categorical data was
per-formed using the chi-square test. Correlation coeicients (Pearson’s r)
and stepwise multiple linear regression were used to determine the relationships between variables. A P value of p<0.05 was considered statistically signiicant.
RESULTS
Our study included 31 obese patients (23 female, 8 male) and 28 controls (17 female, 11 male). The mean ages were 33.46 ± 7.83 years for the control group and 37.80 ± 10.0 years for the obese group.
The mean BMI values were 23.33 ± 1.66 kg/m2 in the control group
and 50.39 ± 8.3 kg/m2 in the obese group. The mean IOPs were 18 ±
6.68 mmHg in the obese group and 13.71 ± 1.60 mmHg in the con-trol group. Therefore, the mean IOP was significantly higher in the obese group than in the control group (p<0.001) (Table 1).
Figure 2 shows a correlation between BMI and IOP (Pearson
correlation test: p<0.001, r=0.658). When the CRA values were
com-pared between the groups, PI was found to be signiicantly lower in the obese group than in the control group (p<0.001). Signiicant diferences were not found between the obese and control groups
regarding the CRA, RI, PSV, or EDV values (Table 1). Figure 3shows
a negative correlation between BMI and CRA PI (Pearson
between the two groups, the PSV (p<0.001) and EDV (p=0.002) values were found to be signiicantly lower in the obese group than in the control group, whereas the RI and PI values of the obese and control
groups were not signiicantly diferent (Table 1). Figure 4shows a
ne-gative correlation between BMI and OA PSV (Pearson correlation test:
p<0.001, r=-0.484), and igure 5shows a negative correlation between
BMI and OA EDV (Pearson correlation test: p=0.005, r=-0.385).
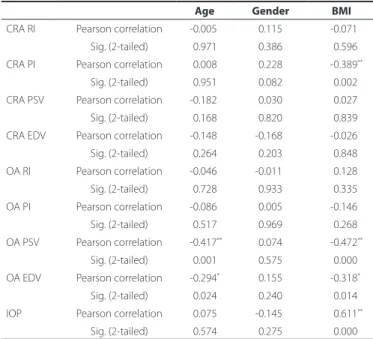
The OA and CRA parameters, IOP with the age, sex, and BMI were correlated by Pearson correlation analysis. BMI alone was signiicantly correlated with the IOP and PI of the CRA. The PSV and EDV of the OA
were signiicantly correlated with BMI and age (Table 2).The outcome
of the overall analysis revealed that BMI is the only predictive para-meter over IOP, the PI of the CRA, and the EDV of the OA; conversely, both BMI and age were predictive parameters for the PSV of the OA (Table 3).
DISCUSSION
In the present study, signiicantly higher IOPs were found in the obese group than in the control group. The PI values of the CRA and the PSV and EDV values of the OA were found to be signiicantly lower in the obese group than in the control group. Our study has revealed that obesity signiicantly afects retrobulbar hemodynamics. Whilst undertaking the background research, we did not ind any studies on the impact of obesity on retrobulbar blood low.
Obesity is a major health problem nowadays, with high rates in
many countries(17). Although obesity is deined as a high proportion
of adipose tissue, focal accumulations of fat tissue in certain
anato-mical locations can cause morphological and functional changes(18).
In a large-scale study, Klein et al.(19) found that IOP values increased as BMI values increased. Similarly, Akinci et al.(20) found that obesity is an independent factor for increased IOP in the early adolescent period. In the present study, we found higher IOP values in obese individuals than in non-obese individuals. This inding is similar to those of pre-vious studies that revealed obesity as an independent risk factor for increases in IOP(19,20).
In the English literature, many investigators have tried to ex-plain the mechanism of the increase in IOP. Recently, Stojanov et al. measured the volume of retrobulbar adipose tissue using magnetic resonance imaging in obese patients, and reported that increased
retrobulbar adipose tissue also increased IOP by its mass efect(18).
Causes related to obesity that increase IOP include its harmful efects on episcleral venous pressure and aqueous humor outlow, increased blood viscosity, and enhanced IOP secondary to oxidative stress cau-sed by hyperleptinemia in obesity(18,21,22). Similar to our study, Karadag Figure 1. A) Time-velocity waveforms of the ophthalmic artery. B) Time-velocity waveforms of the central retinal artery.
A B
Figure 2. Positive correlation between body mass index and intraocular pressure (Pearson correlation test: p<0.001, r=0.658).
Table 1. Comparison of all variables between the obese and normal groups
Variable Normal group (n=28) Obese group (n=31) P value
Age (years ± SD) 33.46 ± 07.80 37.80 ± 10.00 0.0780*
Gender (M/F) 11/17 8/23 0.2040**
et al.(23) investigated the impact of BMI on IOP and the ocular pulse am plitude, and detected increases in IOP in parallel with increases in BMI and an indirect decrease in the ocular pulse amplitude, which shows choroidal perfusion and ocular blood low. In the present study, IOP values were found to increase with increasing BMI, even though the IOP values were still within the normal limits for both groups.
Obesity induces vascular endothelial and autonomic dysfunc-tion, thus resulting in impaired blood flow and unstable
perfu-sion(24). Obesity increases the risk of development of impaired IOP,
as well as systemic abnormalities such as hypertension and
atheros-clerosis(19,25). Therefore, because of increased IOP and vascular
irre-gularity, obesity may play a role in the development of glaucoma. Among the few studies on this topic that have demonstrated a correlation between obesity and glaucoma is a large population-ba-sed study performed by Leske et al., who reported that increapopulation-ba-sed
BMI also increases the risk of open-angle glaucoma(8). In their ocular
CDU examinations, Jimenez-Aragon et al.(26) noted that a decrease in
the low rates through the retrobulbar arteries led to marked disease
progression in patients with glaucoma. Suprasanna et al..(27) detected
decreases in ocular blood low velocities, especially in patients with open-angle glaucoma. In light of this information and our results, it appears that both the decrease in retrobulbar blood low and the increase in the IOP contribute to the risk of glaucoma development in obese patients.
Table 3. Regression analysis
R2 P value Predictors
CRA RI 0.005 0.864
-CRA PI 0.165 0.006* BMI
CRA PSV 0.039 0.325
-CRA EDV 0.022 0.536
-OA RI 0.023 0.516
-OA PI 0.024 0.510
-OA PSV 0.313 0.001* BMI, age
OA EDV 0.148 0.011* BMI
IOP 0.348 0.001* BMI
Table 2. Correlation analysis
Age Gender BMI
CRA RI Pearson correlation -0.005 -0.115 -0.071 Sig. (2-tailed) -0.971 -0.386 -0.596 CRA PI Pearson correlation -0.008 -0.228 -0.389**
Sig. (2-tailed) -0.951 -0.082 -0.002 CRA PSV Pearson correlation -0.182 -0.030 -0.027 Sig. (2-tailed) -0.168 -0.820 -0.839 CRA EDV Pearson correlation -0.148 -0.168 -0.026 Sig. (2-tailed) -0.264 -0.203 -0.848 OA RI Pearson correlation -0.046 -0.011 -0.128 Sig. (2-tailed) -0.728 -0.933 -0.335 OA PI Pearson correlation -0.086 -0.005 -0.146 Sig. (2-tailed) -0.517 -0.969 -0.268 OA PSV Pearson correlation -0.417** -0.074 -0.472**
Sig. (2-tailed) -0.001 -0.575 -0.000 OA EDV Pearson correlation -0.294* -0.155 -0.318*
Sig. (2-tailed) -0.024 -0.240 -0.014 IOP Pearson correlation -0.075 -0.145 -0.611**
Sig. (2-tailed) -0.574 -0.275 -0.000
Figure 5. Negative correlation between body mass index and OA EDV (Pearson correla-tion test: p=0.005, r=-0.385).
Figure 4. Negative correlation between body mass index and OA PSV (Pearson corre-lation test: p<0.001, r=-0.484).
Autoregulation is deined as the ability of an organ to stabilize blood low velocity despite alterations in the perfusion pressure of that organ. Ocular blood low is afected by systemic and local cau ses. An increase in IOP causes decreases in uveal, choroidal, and
retinal blood low(28). The retina has an autoregulatory response to
alterations in blood pressure to allow blood low to remain constant. However, the autoregulatory function of the retina is impaired when IOP is above 30 mmHg(29-31).
Our results showed no statistically signiicant diference in the RI values of the CRA between the obese and healthy groups. On the contrary, we found a signiicant decrease in the PI values of the CRA. RI relects vascular resistance. However, because the diameters of the retrobulbar vessels are extremely small, they are not only afected by distal vascular resistance but also proximal vascular resistance(32).
Moreover, a study using hyperoxia (breathing 100% O2) to detect
changes in vascular resistance in the CRA did not support RI as a good measure of vascular resistance(33).
PI is a variable that also relects vascular resistance. However, be cause PI is not associated with the vascular PSV value, but is de-pendent on the mean low velocity, it is associated with the mean vascular resistance and compliance. PI can be afected by local and regional hemodynamic, respiratory, neurohormonal, and hemato-logical parameters. Previous studies have demonstrated increased arterial resistance and decreased compliance in large and mode ra-te-sized arteries in obese patients, and these indings are reportedly the result of the increased cardiac output related to obesity(34,35). In the present study, the PI of the CRA was signiicantly lower in the obese group than in the control group. We believe that this is related to the decreased reactive vascular compliance from the increased cardiac output in obese patients, which is a similar conclusion to that of previous studies.
In the present study, the IOP values were found to increase with increasing BMI, even though the IOP values were still within the nor mal limits for both groups. In the obese group, we found a signi-icant decrease in the PSV and EDV of the OA and the PI of the CRA as assessed by CDU. We hypothesized that the alterations in the low parameters of the OA results, increase in episcleral venous pressure secondary to the increased amount of retro-orbital fat, and secon-dary increase in the blood viscosity were due to the obesity and the associated oxidative stresses such as hyperleptinemia.
One of the main limitations of our study was the small sample sizes of both the obese and healthy volunteer groups. Further inves-tigation with larger study populations would allow a more accurate relection of the results in the population. Another limitation of our study was the information bias. We included morbidly obese patients
in our study, with a median BMI of 50 kg/m2 in the obese group.More
knowledge about the role of obesity on BMI in a larger study popula-tion and in patients with various stages of obesity (mildly, moderately, and morbidly obese groups) and duration of obesity could provide more detailed data on the efect of obesity on the parameters of the retrobulbar vascular structures. Additionally, CDU, which we used to evaluate the ocular hemodynamics, does not provide information on ocular blood low. However, it provides data on retrobulbar blood low, which can easily be inluenced by local and regional alterations, predominantly in the OA and CRA.
In conclusion, we found that obese individuals have markedly higher IOPs than non-obese individuals. We also found a decrease in the PI of the CRA, which aims to compensate for decreased ocular blood low secondary to the decreased blood low through the OA among the retrobulbar arteries and increases the IOP in the CRA via an autoregulation mechanism. Our indings have also demonstrated increased IOP in obese individuals and related decreases in the blood low velocities of the OA. Increased IOP, together with decreased retrobulbar blood low, especially in obese individuals, may increase the risk of developing glaucoma. Therefore, it is important to measure the IOP and retrobulbar blood low in obese patients to ensure early detection of glaucoma, thus allowing prompt management of this disease.
REFERENCES
1. Friedman N, Fanning EL. Overweight and obesity: an overview of prevalence0. clinical impact and economic impact. Dis Manag. 2004;7 Suppl 1:S1-6.
2. James PT, Leach R, Kalamara E, Shayeghi M. The worldwide obesity epidemic. Obes Res. 2001; 9 Suppl 4:228S-233S.
3. Grundy SM. Metabolic complications of obesity. Endocrine. 2000;13(2):155-65. 4. Haslam DW, James WP. Obesity. Lancet. 2005;366(9492):1197-209.
5. Van Leiden HA, Dekker JM, Moll AC, Nijpels G, Heine RJ, Bouter LM, et al. Blood pres-sure, lipids, and obesity are associated with retinopathy: The hoorn study. Diabetes Care. 2002;25(8):1320-5.
6. Glynn RJ, Christen WG, Manson JE, Bernheimer J, Hennekens CH. Body mass index an independent predictor of cataract. Arch Ophthalmol. 1995;113(9):1131-7. 7. Seddon JM, Cote J, Davis N, Rosner B. Progression of age-related macular
degenera-tion: association with body mass index, waist circumference and waist-hip ratio. Arch Ophthalmol. 2003;121(6):785-92.
8. Leske MC, Connell AM, Wu SY, Hyman LG, Schachat AP. Risk factors for open-angle glaucoma. The Barbados Eye Study. Arch Ophthalmol. 1995;113(7):918-24. 9. Mohammadi A, Khorasani N, Moloudi F, Ghasemi-Rad M. Evaluation of retrobulbar
blood low in patients with age-related cataract; color Doppler ultrasonographic in-dings. Clin Ophthalmol. 2011;5:1521-4.
10. Giovagnorio F, Quaranta L, Bucci MG. Color Doppler assessment of normal ocular bloodlow. J Ultrasound Med. 1993;12(8):473-7.
11. Kaskan B, Ramazani K, Harris A, Siesky B, Olinde C, WuDunn D, et al. Diferences in ocular blood low between people of African and European descent with healthy eyes. J Glaucoma. 2016;25(9):709-15.
12. Baydar S, Adapinar B, Bal C, Topbas S. Colour Doppler ultrasound evaluation of orbital vessels in diabetic retinopathy. Australas Radiol. 2007;51(3):230-5.
13. Krasnicki P, Dmuchowska DA, Proniewska-Skretek E, Dobrzycki S, Mariak Z. Ocular haemodynamics in patients with type 2 diabetes and coronary artery disease. Br J Ophthalmol. 2014;98(5):675-8.
14. Ahmetoğlu A, Erdol H, Simsek A, Gökçe M, Dinç H, Gümele HR. Efect of hypertension and candesartan on the blood low velocity of the extraocular vessels in hypertensive patients. Eur J Ultrasound. 2003;16(3):177-82.
15. Stalmans I, Vandewalle E, Anderson DR, Costa VP, Frenkel RE, Garhofer G, et al. Use of colour Doppler imaging in ocular blood low research. Acta Ophthalmol. 2011;89(8): e609-30.
16. Taylor KJ, Holland S. Doppler US. Part I. Basic principles, instrumentation, and pitfalls. Radiology. 1990;174(2):297-307.
17. Flegal KM, Carroll MD, Ogden CL, Johnson CL. Prevalence and trends in obesity among US adults, 1999-2000. JAMA. 2002;288(14):1723-7.
18. Stojanov O, Stokić E, Sveljo O, Naumović N. The inluence of retrobulbar adipose tissue volume upon intraocular pressure in obesity. Vojnosanit Pregl. 2013;70(5):469-76. 19. Klein BE, Klein R, Linton KL. Intraocular pressure in an American community. The
Beaver Dam Eye Study. Invest Ophthalmol Vis Sci. 1992;33(7):2224-8.
20. Akinci A, Cetinkaya E, Aycan Z, Aycan Z, Oner O. Relationship between intraocular pressure and obesity in children. J Glaucoma. 2007;16(7):627-30.
21. Nassr MA0. Lorris CL0. Netland PA0. Karcioglu ZA. Intraocular pressure change in orbital disease. Surv Ophthalmol. 2009; 54(5):519-44.
22. Bouloumie A, Marumo T, Lafontan M, Busse R. Leptin induces oxidative stress in human endothelial cells. FASEB J. 1999;13(10):1231-8.
23. Karadag R, Arslanyilmaz Z, Aydin B, Hepsen IF. Efects of body mass index on intrao-cular pressure and ointrao-cular pulse amplitude. Int J Ophthalmol. 2012;5(5):605-8. 24. Cheung N, Wong TY. Obesity and eye diseases. Surv Ophthalmol. 2007;52(2):180-95.
Review.
25. Aslam DW, James WP. Obesity. Lancet. 2005;366(9492):1197-209.
26. Jimenez-Aragon F, Garcia-Martin E, Larrosa-Lopez R, Artigas-Martín JM, Seral-Moral P, Pablo LE. Role of color Doppler imaging in early diagnosis and prediction of progres-sion in glaucoma. Biomed Res Int. 2013;2013:871689. doi: 10.1155/2013/871689. 27. Suprasanna K, Shetty CM, Charudutt S, Kadavigere R. Doppler evaluation of ocular vessels
in patients with primary open angle glaucoma. J Clin Ultrasound. 2014;42(8):486-91. 28. Willamson TH, Haris A. Color Doppler ultrasound imaging of the eye and orbit. Surv
Ophthalmol. 1996;40(4):255-67.
29. Russel RW. Evidence for autoregulation in human retinal circulation. Lancet. 1973; 2(7837):1048-50.
30. Riva CE, Loebl M. Autoregulation of blood low in the capillaries of the human macula. Invest Ophthalmol Vis Sci. 1977;16(6):568-71.
31. Grunwald JE, Riva CE, Stone RA, Keates EU, Petrig BL. Retinal autoregulation in open-angle glaucoma. Ophthalmology. 1984;91(12):1690-4.
32. Flaharty PM, Sergott RC, Lieb W, Bosley TM, Savino PJ. Optic nerve sheath decompres-sion may improve blood low in anterior ischemic optic neuropathy. Ophthalmology 1993;100(3):297-302; discussion 303-5.
33. Polska E, Kircher K, Ehrlich P, Vecsei PV, Schmetterer L. RI in central retinal artery as assesed by CDİ does not correspond to retinal vascular resistance. Am J Physiol Heart Circ Physiol. 2001;280(4):H1442-7.
34. Ozari HO, Oktenli C, Celik S, Tangi F, Ipcioglu O, Terekeci HM, et al. Are increased carotid artery pulsatility and resistance indexes early signs of vascular abnormalities in young obese males. J Clin Ultrasound. 2012;40(6):335-40.