1. Laboratory of Sportive Performance – School of Physical Education and Sports – São Paulo University – São Paulo (SP).
2. Laboratory of M orpho-Functional Researches – Center of Physical Ed-ucation, Physiotherapy and Sports – Santa Catarina State University – Florianópolis (SC).
Received in 24/11/04. Final version received in 30/7/05. Approved in 3/11/05.
Correspondence to: Flávio de Oliveira Pires, Rua Acalanto de Bartira, 166, Jd. Bonfiglioli, Butantã – 05358160 – São Paulo, SP. Phone: (11) 3731-3071, fax: (11) 3763-2588. E-mail: [email protected]
Characterization of the blood lactate curve and applicability
of the Dmax model in a progressive protocol on treadmill
Flávio de Oliveira Pires¹, Adriano Eduardo Lima Silva², João Fernando Laurito Gagliardi¹, Ronaldo Vilela Barros¹ and M aria Augusta Peduti Dal’ M olin Kiss¹
O
RIGINALA
RTICLEKeyw ords: Curve adjustments. Progressive protocol. Lactate threshold.
ENGLISH VERSION
ABSTRACT
Purpose: To characterize the blood lactate ([La]) behavior along a progressive protocol on treadmill, and to investigate the applica-bility of the Dmax model in detecting the lactate threshold (LT) and the sportive performance. M ethods: Tw enty-seven male ath-letes of regional level performed the Heck et al. protocol (1985) incremented every 3 minutes. The sportive output w as attained by the mean velocity of the 10 km-test. The first and second LT w ere determined through visual analysis of the [La] (LTv1 and LTv2) curve, and by interpolation of the velocity related to the 2.0 and 3.5 mmol.l-1 concentrations (LT
2.0 and LT3.5). The Dmax model has identified the LT in measured values (DmaxM ED), and w as
predict-ed by the polynomial functions (DmaxPOL), the 2-segment linear
(DmaxSEG) and the continuous exponential (DmaxEXP). The charac-teristic of the blood lactate along the incremental test w as checked through 2-segment linear adjustments and continuous exponen-tial. Results: There w as no significant difference betw een the sums of the square residues of the curve adjustments, but there w as a trend for a better continuous exponential adjustment at 70.4% of the sampling. Although there w as no significant difference betw een the DmaxM ED, DmaxPOL, DmaxSEG, and DmaxEXP, the Dmax meth-ods w ere higher than the LTv1, low er than the LT3.5, and w ere not different of the LT2.0. Every Dmax criteria w ere significantly low er
than the mean velocity of the 10 km-test. Conclusions: While the
[La] trended to an exponential increase along the progressive pro-tocols on treadmill, the Dmax model presented evidences of its applicability to detect the LT, but not for the sportive output.
INTRODUCTION
The analysis of the blood lactate concentrations ([La]) curve has supplied important subsidies to provide an understanding on the phenomena related to the sportive output(1). Along the 80’s, Hugh-son et al. (1987)(2) and Campbell et al. (1989)(3), show ed an expo-nential increase in that variable along progressive protocols em-ploying mathematical curve adjustments, differently from prior studies that checked a 3 or 4-segment curvilinear characteristic(4,5).
Nevertheless, Hughson and co-w orkers(2) and Campbell and
co-w orkers(3) used ergometric bike protocols, restricting the extrapo-lation of those results w hen a treadmill w as employed, as the be-havior of that variable depends on the motor pattern and the size of the recruited muscular mass(6,7).
Still, the analysis of the blood lactate concentrations enables the identification of one or tw o metabolic transition zones that are dependant on the terminology and methodology adopted, and w hich is commonly denominated lactate threshold (LT)(5). This point has been investigated due to its properties in detecting the level of the aerobic capability and to predict the sportive output, since it theoretically represents a maximal balance status in the [La] along constant exercising(8,9). In fact, w henever methodologies to identi-fy the tw o metabolic transition zones are used, the second point is frequently taken as reference for such intensity(10). In this sense, several methods to allow an objective(11,12) and practice(13,14) deter-mination of that spot w ere proposed, but the major part of them has limitations and methodological implications.
In the 90’s, Cheng et al. (1992)(15) suggested the Dmax model to determine the LT (figure 1), under the supposition it w ould allow more individualized identifications instead of using fixed and less subjective concentrations, and less subjectives than visual analy-sis, since it makes objective calculations of the intensity that
con-siders every value contained in the curve(15). Consequently, the
point identified by the Dmax is directly connected to the behavior of every curve of the blood lactate along the incremental test.
Figure 1 – Velocity of the LT (solid arrow ) identified by the Dmax model km.h-1
Despite the evidences of the validity of this model(16-18), w hen-ever is admitted the existence of tw o metabolic transition zones, there are gaps related to w hich of both transition zone is marked by such method.
be-havior of every [La] curve, it appears some doubts as to its appli-cability to determine the LT and the sportive performance, because although some studies applied that method to adjusted data w ith
polynomial regression(19), others employed the continuous
expo-nential function(20), suggesting that the use of different mathemat-ical functions can generate distortions in the intensity determined through that model.
Thus, the purpose of this paper w as to characterize the blood lactate behavior along the progressive period on treadmill, and to check the applicability and consistency of the Dmax model in de-tecting the LT and the sportive output from measured and adjust-ed values by different mathematical functions.
M ETHODS
Sampling: Tw enty-seven male athletes of regional level (triath-letes and marathon runners) participated in this study (29.1 ± 5.4 years; 172.3 ± 8.1 cm; 67.2 ± 9.3 kg; 58.5 ± 10.8 ml.kg-1.min-1) after signing an informed consent term. This study w as approved by the ethics committee for studies in humans (EEFE-USP).
Progressive protocol: All subjects performed incremental test on a Quinton® model 2472 treadmill w ith initial velocity of 6.0 km.h
-1 and 1.2 km.h-1 increments in each of the 3 minutes phase and
w ith 30 second pause to the blood collection(13).
Data collection and analysis: During the 30 final seconds of each stage, 25 µl of arterialized blood w ere collected from the ear lob-ule (previously prepared w ith Finalgon®), w hich w as stored in
mi-crotubes containing 50 µl of sodium fluoride and stored at 10oC
for later analysis in a Yellow Springs® M odel 2000 lactate analyzer.
The attained [La] had the velocity plotted to identify the LT (ex-pressed in km.h-1).
Identification of the lactate threshold: The 1st and 2nd lactate thresholds (LT1 and LT2) w ere identified through visual analysis of the blood lactate curve from a mean observation performed by three researchers. While the LT1 w as determined at the increase point of the [La] related to the resting values (1st interruption of the curve’s linearity), the LT2 w as determined by the intensity
w here the [La] presented a sudden and continuing increase (2nd
interruption of the curve’s linearity). Whenever necessary, LT1 or LT2 w ere approximated according to other criteria(21).
The LT1 and LT2 w ere also identified by interpolation(6) of the velocity corresponding to the fixed lactate concentrations of 2.0 and 3.5 mmol.l-1, and they are representatives of the LT1 and LT2, respectively(10,13). For a better understanding on the terms, the vi-sually attained LT1 and LT2 w ill be called LTv1 and LTv2, and the LT1 and LT2 attained by the use of fixed concentrations w ill be called LT2.0 and LT3.5.
The LT w as also determined at the point w here the [La] pre-sented an increase ≥ at 1.0 mmol.l-1(19). Such criterion w as treated herein as L1.0, and it w as used because it allow s the identification of only one metabolic transition zone.
At last, the Dmax(15) model has identified the LT at the most
distant perpendicular point betw een the [La] values contained in the curve, and a regression line w as traced betw een the first and the last value of that curve.
Adjustments in the blood lactate curve: The characterization of the blood lactate curve in function of the velocity w as verified fol-low ing the 2-segment linear mathematical functions, and the con-tinuous exponential variating betw een 7 and 11 points. Later, the
Dmax model w as calculated in measured data (DmaxM ED), and in
adjusted data using the 2-segment linear (DmaxSEG), the
continu-ous exponential (DmaxEXP), and the 3rd order polynomial (Dmax POL) functions.
The 2-segment linear adjustment(22) w as attained by linear re-gression equation w ith an initially unknow n intercept calculated from every possible visual intersection points betw een segments. The intercept that better divided the curve in tw o theoretically
lin-ear segments w as assumed as the higher R2 value and the low er
sum of the square residues (SRQ). Thus, the curve segments w ere predicted by the follow ing equations:
Y = a + b1 (x1); for the 1st segment
Y = a + b2 (x2) + c; for the 2nd segment
w here y is the predicted value for the [La], a is the intercept for both segments, b1 and b2 are respectively, the inclination of the 1st and 2nd segments, and c is the tangent betw een both segments. The exponential characteristic of the [La] along the progressive tests w as tested by the continuous exponential function(2), through the follow ing equation:
Y = a + b exp(cx) + e
w here y is the predicted value for [La], x is the velocity, e is the residual error, a, b, and c are minimized estimates of the SRQ betw een measured and predicted values for the [La], and exp(x) is the maximized estimate of the correlation coefficient betw een variables x and y.
The 3rd order polynomial function w as used to attenuate the
noises contained in the rough values of the [La], w ithout changing the initial characteristics of the curve, allow ing one of the
varia-tions for the Dmax model (DmaxPOL). The equation generated w as
the follow ing:
Y = b1(x³) + b2(x²) + b3(x) + a
w here y is the predicted value for the [La], b1, b2, and b3 are the inclination’s constants of the curve; x is the velocity, and a is the intercept.
Sportive output: After a low er than 30 days interval from the progressive protocol, the sampling performed a 10 km-test on a 400-meter race track. The mean time and velocity of the 10 km-test (VM10km) w ere recorded.
Statistical analysis: After verifying the data distribution (Shapiro-Wilk’s) it w as attained the significance of the differences betw een the assessed variables using the Friedman’s Anova along w ith the Wilcoxon (post hoc) signalization test for matched pairs. The asso-ciation betw een variables w as attained using the Spearman Rank test. In every analysis (SPSS version 1.0) it w as adopted 5% sig-nificance level (p < 0.05).
RESULTS
Every calculation used the mean and standard deviation as cen-tral trend and dispersion measurements, respectively. For eventu-al comparisons, a few data related to the 10 km-test and the SRQ betw een the mathematical functions of adjustment are also pre-sented as mean and standard deviation.
Quality of the curve adjustments
The 3rd order polynomial adjustment w as not included in the
residual analysis, once it does not have a theoretical basis that justifies its application in the attempt to describe the assessed phenomenon. As to the 2-segment linear adjustment, eight
indi-viduals presented the 2nd segment adjusted in only tw o points.
Dmax and different methods to identify the LT
Four individuals did not attain the 2.0 and/or 3.5 mmol.l-1 con-centration values along the incremental test. There w ere no sig-nificant differences betw een variations in the Dmax model, w heth-er applied on measured and/or adjusted values by three diffheth-erent mathematical functions (table 1).
The major contribution this paper supplied w as the trend for an exponential increase in the [La] related to the w orkload observed in 70.4% of the assessed sampling. In that case, the absence of a significant difference betw een the SRQ of the mathematical func-tions may be conditioned to some factors.
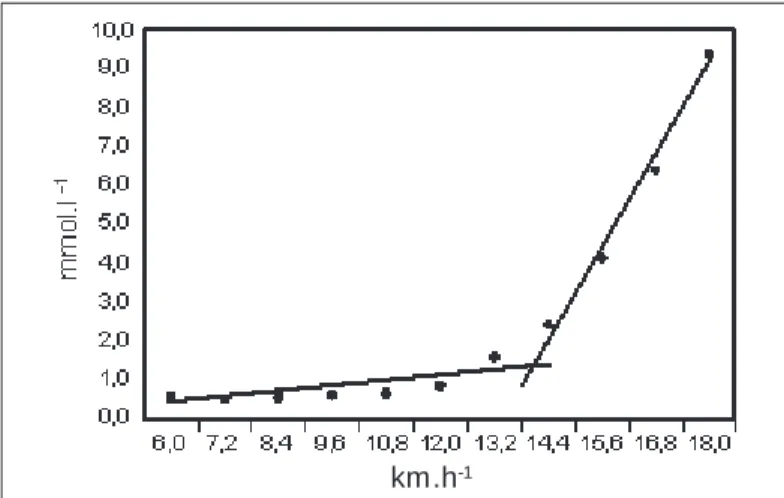
First, differently from studies verifying a better exponential ad-justment in the [La](2,3), the protocol employed here has generated a low er amount of points per curve. As the continuous exponen-tial function (figure 2) predicts the blood lactate values w ith pro-gressive correction minimizing the SRQ maximizing the correla-tion coefficient betw een the x and y(2) values, such low er amount of points could be one of the reasons for the absence of differenc-es betw een the mathematical functions.
TABLE 1
Velocity of the LT identified by the method of visual analysis [La], fixed [La], ≥≥≥≥≥ 1,0 mmol.l-1, and by the Dmax model applied on real and adjusted data.
The values are presented in mean and standard deviation
LTv1 LTv2 LT2,0 LT3,5 L1,0
km.h-1 km.h-1 km.h-1 km.h-1 km.h-1
11.1 ± 1.3†‡ 13.2 ± 1.0‡ 13.2 ± 2.0 14.4 ± 1.3†‡ 14.4 ± 1.6
DmaxM ED DmaxPOL DmaxSEG DmaxEXP
km.h-1 km.h-1 km.h-1 km.h-1
13.2 ± 1.0 13.2 ± 0.9 13.2 ± 0.9 13.2 ± 1.0
† Different from DmaxPOL and DmaxSEG; ‡ different from DmaxM ED and DmaxEXP (p < 0,05); visual
analysis (LTv1 e LTv2); [fixed La] (LL2,0 and LL3,5); ≥ 1,0 mmol.l-1 (L1,0); Dmax in measured values
(DmaxM ED) and in adjusted values (DmaxPOL, DmaxSEG, DmaxEXP).
Related to the other methods, it w as found no significant differ-ences betw een any Dmax criterion and the LT2.0 and LT1.0 (p be-tw een 0.06 and 0.09). How ever, w hile DmaxM ED and DmaxEXP w ere
different from LTv2, the same w as not observed in the DmaxPOL
and DmaxSEG. Every Dmax criterion w as higher than LTv1 and low -er than LT3.5 (table 1). Interestingly, LT1 and LT2 attained through fixed concentrations w ere higher than LT1 and LT2 attained through visual analysis (LT2.0 > LTv1 and LT3.5 > LTv2).
DmaxM ED, DmaxSEG, DmaxEXP, and DmaxPOL presented a correla-tion coefficient that varied betw een 0.57 and 0.80 (p < 0.01). Ta-ble 2 show s the association level betw een the Dmax criteria and other methods.
Dmax and sportive output
The time of the test and the VM10km w ere 37.8 ± 3.2 minutes, and 16.0 ± 1.3 km.h-1, respectively.
Every Dmax variation, as w ell as other identification methods for the LT w as significantly low er than the VM10km. On the other hand, only the DmaxEXP w ere significantly correlated to the VM10km (r = 0.68) (table 2).
TABLE 2
Correlation coefficient betw een the Dmax model and other different methods to identify the LT, the mean velocity
of the 10 km, and the peak velocity on treadmill
LTv1 LTv2 LT2,0 LT3,5 L1,0 Vel10km PVE
DmaxM ED 0.58* * 0.69* * 0.40** 0.41** 0.39* * 0.34* * 0.48**
DmaxPOL 0.57* * 0.60* * 0.32* * 0.38* * 0.58* * 0.41* * 0.64* * DmaxSEG 0.55* * 0.66* * 0.45** 0.61* * 0.65* * 0.37* * 0.64* *
DmaxEXP 0.67* * 0.77* * 0.68* * 0.65* * 0.72* * 0.68* * 0.88* *
* * significant for p < 0,01; * significant for p < 0,05; Dmax in measured values (DmaxM ED) and adjusted values (DmaxPOL, DmaxSEG, DmaxEXP); visual visual (LLv1 and LLv2); fixed [La] (LL2,0 e
LL3,5); ≥ 1,0 mmol.l
-1 (L1,0); mean v10 km-velocity mean of the 10 km, peak velocity on a treadmill
(Vel10km).
DISCUSSION
Historically, conceptual and methodological problems limitate a broadest definition to the phenomena related to the lactate me-tabolism w hile exercising. That approach is expressly linked to the different models used to investigate them, and our paper rein-forces such premise.
Figure 2 – Blood lactate curve in function of the velocity in an individual
w ith values adjusted according to the continuous exponential function (com-pact line)
km.h-1
In fact, the duration of the protocol can influence the curve be-havior of the [La] in the incremental test(23).
Second, the 2-segment linear adjustment (figure 3) w as calcu-lated using four to nine points in the first segment, and tw o to four points in the second segment. As it is demanded at least seven points to achieve a successful curve adjustment(24), this w ould be a limitation to the present investigation, as that mathematical func-tion splits the curve in tw o theoretically linear and partially inde-pendent segments. Thus, even observing betw een 7 and 11 points to analyze each total curve, it could there have been a “ best” ad-equation of the data to the segmented linear function by the sim-ple division of the curve in tw o segments. The difficulties in using
such mathematical adjustment w ere previously mentioned(25).
Figure 3 – Blood lactate curve in function of the velocity in an individual
w ith values adjusted according to the 2-segment linear function (compact line)
A descriptive approach helps to understand our results. The fea-tures of the blood lactate increase along the progressive protocol must pursue associations w ith the sportive output, since the best places in a 10 km-test trended to present an exponential increase in the [La].
Such behavior w as also observed as to the PVE, w ith the high-est values generated by the majority of individuals w ith trend for a better continuous exponential adjustment (12 individuals). Although w e must be careful, it is reasonable to expect that individuals w ith a higher aerobic fitness level, also present a higher trend for an exponential increase of the [La] due to the w orkload(26).
The main justification for this suggestion is the changes in the blood lactate accumulation features after a physical training(23). Along w ith the incremental test, individuals presenting a better aerobic conditioning are successful in keeping themselves during a prolonged period of low [La], thus delaying the beginning of the progressive increase of that variable(1,8,14,27), and this could gener-ate an exponential increase in the blood lactgener-ate curve. This behav-ior seems to be connected to the higher capability of the tampon-age system(28), to the better removal(28,29), and/or a low er lactate production rate(30) in individuals performing exercises.
Another important contribution granted by this investigation w as the confirmation of the applicability and consistency of the Dmax model in determining the LT both in measured and in adjusted values. On the other hand, even w ith no significant differences, the points attained by the variations in the Dmax model w ere not kept aw ay in the same w ay compared to other methods used.
How ever, some divergences betw een methods to identify the LT w ere previously observed(16,17,19,20), and these can be related to different methodologies adopted to obtain such intensity(31).
Unlike prior studies(19,20), it w as observed that the Dmax model w as unable to detect the sportive output, because besides the significant difference betw een the velocities attained through that
method and the VM10km, w e have noticed low correlation levels
betw een these variables. Our results confirm the supposition that the LT has a higher predictive pow er in long endurance tests(8,19,32,33), suggesting that the PVE and the blood lactate peak attained in incremental tests is a more sensitive variable to detect the sport-ive output in short term tests, w ith low er or equal to 10 km dis-tances(34). Thus, the lack of capability in detecting the sportive output in such type of test should not be conditioned to that spe-cific model, but instead to the physiological phenomenon it repre-sents.
This and other investigations(15-17) allow us to suppose that the
Dmax is closest to the L1.0 and aw ay from LT3.5 and/or the 4.0
mmol.l-1 threshold. This supposition is justified by the trend to the overestimation of the LT w hen the fixed [La] is used mainly in
individuals w ith higher aerobic fitness levels(12,13), as the individu-als assessed in this and other investigations(16,17) w ere recreation-al and/or competitive aerobic athletes.
Additionally, w hen it is assumed that there is a curvilinear rela-tionship betw een the [La] and the w orkload(4,22), this criterion can be arbitrary and less sensitive to identify such intensity(25).
How ever, considering the existence of tw o metabolic transition zones(5,10), it is not possible to conclude to w hich one the Dmax model is the marker. For instance, although it w as noted no differ-ence betw een any Dmax criterion and the LT2.0, the DmaxM ED and the DmaxEXP w ere significantly different from LTv2 (p = 0.03), al-though the same behavior as to the DmaxPOL and DmaxSEG w as not observed. This makes difficult to interpret our findings, since the-oretically, the LT2.0 and the LTv2 are considered markers for differ-ent metabolic transition zones(5,10).
In fact, the theoretical model suggesting tw o metabolic transi-tion zones is based on classic studies using visual analysis of the lactate curve(25,35-37) and/or fixed [La](13,25,26,35) in order to obtain the LT. Thus, the identification for tw o distinct intensities is allow ed by the arbitrarity of the fixed [La] method or by the high level of subjectivity and dependence w hen the researcher is interpreting using the visual method(11,12). Considering the limitations of these classic methods, it could be suggested the existence of a contin-uously manifested sole metabolic transition zone(21).
In fact, a better exponential adjustment in the blood lactate curve observed in prior studies(2,3), and the trend for a better continuous exponential adjustment observed here w ould be the evidence for the presence of only one metabolic transition zone.
Despite the limitations of the present study, it w as observed trends for an exponential behavior in the blood lactate curve along the progressive protocol on treadmill. On the other hand, it w as noted evidences on the applicability and consistency of the Dmax model in determining the LT intensity both in measured and in adjusted values. Nevertheless, this method w as not effective in detecting the sportive output on a 10 km-test, suggesting that the exponential characteristic of the [La] curve in that case can be a phenomenon that may help to understand the performance in those tests. Further studies must confirm this suggestion.
THANKFULNESS
We w ish to thank to Prof. Doctor Fernando Roberto de Oliveira and Professor Cláudio Romero M arinho for their contributions along the elab-oration of the study.
All the authors declared there is not any potential conflict of inter-ests regarding this article.
REFERENCES
1. M ader A. Evaluation of the endurance performance of marathon runners and the-oretical analysis of test results. J Sports M ed Phys Fitness 1991;31:1-19. 2. Hughson R L, Weisiger KH, Sw ason GD. Blood lactate concentration increases
as a continuous function in progressive exercise. J Appl Physiol 1987;62:1975-81.
3. Campbell M E, Hughson RL, Green HJ. Continuous increase in blood lactate con-centration during different ramp exercise protocols. J Appl Physiol 1989;66:1104-7.
4. Kiss M APDM , Fleishmann E, Cordani LK, Kalinovsk F, Costa R, Oliveira FR, et al. Validade da velocidade do limiar de lactato de 3,5mmol x L–1 identificada através
de teste em pista de atletismo. Rev Paul Educ Fís 1995;9:16-25.
5. Ribeiro JP. Limiares metabólicos e ventilatórios durante o exercício. Arq Bras Cardiol 1995;64:171-81.
6. Beneke R, Von Duvillard PS. Determination of maximal lactate steady state re-sponse in selected sports events. M ed Sci Sports Exerc 1996;28:241-6. 7. Beneke R, Leithäuser RM , Hütler M . Dependence of maximal lactate steady state
on the motor pattern of exercise. Br J Sports M ed 2001;35:192-6.
8. Billat LV. Use of blood lactate measurements for prediction of exercise perfor-mance and for control of training. Sports M ed 1996;22:157-75.
9. Simões HG, Campbell CSG, Kokubun E, Denadai BS, Baldissera V. Determination of maximal lactate steady state velocity coincidence w ith low er blood glucose. M ed Sci Sports Exerc 1996;28:S68.
10. Ribeiro JP, Hughes V, Fielding RA, Holden W, Evans W, Knuttgen HG. M etabolic and ventilatory responses to steady state exercise relative to lactate thresholds. Eur J Appl Physiol 1986;55:215-21.
11. Beaver WL, Wasserman K, Whipp BJ. A new method for detecting anaerobic threshold by gas exchange. J Appl Physiol 1986;60:2020-7.
12. Stegmann H, Kindermann W, Shnabel A. Lactate kinetics and individual anaero-bic threshold. Int J Sports M ed 1981;2:160-5.
13. Heck H, M ader A, Hess G, M üke S, M üller R, Hollmann W. Justification of the 4-mmol/l lactate threshold. Int J Sports M ed 1985;6:117-30.
15. Cheng B, Kuipers H, Snyder AC, Jeukendrup A, Hesselink M . A new approach for the determination of ventilatory and lactate thresholds. Int J Sports M ed 1992; 13:518-22.
16. Baptista RR, Oliveira LG, Figueiredo JB, Oliveira AR. Comparação entre a deter-minação do limiar de lactato em remadores pelos métodos Dmáx e limiar de 4,0mmol.l-1. Rev Bras M ed Esporte 2003;9(Supl 1);S57.
17. Pires FO, Lima Silva AE, Barros RV, Gagliardi JFL, Degaki E, Kiss M APDM . Esti-mativa do 2º limiar de lactato pelo modelo Dmáx. Rev Bras M ed Esporte 2003;9 (Supl 1):S56.
18. Kara M , Gökbel H, Bediz CS. A combined method for estimating ventilatory thresh-old. J Sports M ed Phys Fitness 1999;39:16-9.
19. Bishop D, Jenkins DG, M ackinnon LT. The relationship betw een plasma lactate parameters, Wpeak and 1-h cycling performance in w omen. M ed Sci Sports Ex-erc 1998;30:1270-5.
20. Nicholson RM , Sleivert GG. Indices of lactate threshold and their relationship w ith 10-km running velocity. M ed Sci Sports Exerc 2001;33:339-42.
21. Pires FO, Lima Silva AE, Barros RV, Gagliardi JFL, Degaki E, Kiss M APDM . Possi-bilidade da ocorrência dos 1º e 2º limiares ventilatórios em cargas de trabalho coincidentes, durante protocolos progressivos com incrementos de longa dura-ção. Rev Bras Ciênc M ov 2005;13:61-9.
22. Orr GW, Green HJ, Hughson RL, Bennett GW. A computer linear regression model to determine ventilatory anaerobic threshold. J Appl Physiol Respirat Environ Exerc Physiol 1982;52:1349-52.
23. M aassen N, Busse M W. The relationship betw een lactic acid and w ork load: a measure for endurance capacity or an indicator of carbohydrate deficiency? Eur J Appl Physiol 1989;58:728-37.
24. Lima Silva AE, Gagliardi JFL, Lotufo RF, Kiss M APDM . Ajustes lineares vs qua-dráticos da curva de consumo de oxigênio durante teste progressivo. Rev Bras Ciênc M ov 2003;11:13-8.
25. Gladden LB, Yates JW, Stremel RW, Stamford BA. Gas exchange and lactate anaerobic thresholds: inter- and intraevaluator agreement. J Appl Physiol 1985;58: 2082-9.
26. Föhrenbach R, M ader A, Hollmann W. Determination of endurance capacity and prediction of exercise intensities for training and competition in marathon run-ners. Int J Sports M ed 1987;8:11- 8.
27. Costill DL, Thomason H, Roberts E. Fractional utilization of the aerobic capacity during distance running. M ed Sci Sports 1973;5:248-52.
28. M onodero J, Donne B. Effect of recovery interventions on lactate removal and subsequent performance. Int J Sports M ed 2000;21:593-7.
29. Green H, Halestrap A, M ockett C. Increases in muscle M CT are associated w ith reductions in muscle lactate after a single exercise session in humans. Am J Physiol 2002;282:E154-60.
30. M acRae HSH, Dennis SC, Bosch AN, Noakes TD. Effects of training on lactate production and removal during progressive exercise in humans. J Appl Physiol 1992;72:1649-56.
31. M eyer K, Hajric R, Westbrook S, Samek L, Lehmann M , Schw aibold M , et al. Ventilatory and lactate threshold determinations in healthy normals and cardiac patients: methodological problems. Eur J Appl Physiol Occup Physiol 1996;72:387-93.
32. Kuipers H, Reitjens G, Verstappen F, Shoenmakers H, Hofman G. Effects of stage duration in incremental running tests on physiological variables. Int J Sports M ed 2003;24:486-91.
33. Fernhall B, Kohrt W, Burkett LN, Walters S. Relationship betw een the lactate threshold and cross-country run performance in high school male and female runners. Pediatric Exerc Sci 1996;8:37-47.
34. Roecker K, Schotte O, Niess AM , Horstmann T, Dickhuth HH. Predicting compe-tition performance in long-distance running by means of a treadmill test. M ed Sci Sports Exerc 1998;30:1552-7.
35. M oneta JC, Robergs RA, Costill DL, Fink WJ. Threshold for muscle lactate accu-mulation during progressive exercise. J Appl Physiol 1989;66:2710-6.
36. Simon J, Young JL, Gutin B, Blood DK, Case RB. Lactate accumulation relative to the anaerobic and respiratory compensation thresholds. J Appl Physiol Respirat Environ Exerc Physiol 1983;54:13-7.