ORIGINAL ARTICLE
Relationship between inflammatory biomarkers and
depressive symptoms during late pregnancy and the
early postpartum period: a longitudinal study
William Simpson,
1,2Meir Steiner,
1,2,3,4Marg Coote,
2Benicio N. Frey
1,2,31McMaster Integrated Neuroscience Discovery and Study (MiNDS), McMaster University, Hamilton, ON, Canada.2Women’s Health Concerns
Clinic, St. Joseph’s Healthcare Hamilton, Hamilton, ON, Canada.3Department of Psychiatry and Behavioural Neuroscience, McMaster
University, Hamilton, ON, Canada.4Institute for Medical Sciences, University of Toronto, Toronto, ON, Canada.
Objective:Perinatal depressive symptoms often co-occur with other inflammatory morbidities of pregnancy. The goals of our study were 1) to examine whether changes in inflammatory markers from the third trimester of pregnancy to 12 weeks postpartum were associated with changes in depressive symptoms; 2) to examine whether third trimester inflammatory markers alone were predictive of postpartum depressive symptoms; and 3) to examine the relationship between inflammatory markers and depressive symptoms during the third trimester of pregnancy and at 12 weeks postpartum.
Methods:Thirty-three healthy pregnant women were recruited from the Women’s Health Concerns Clinic at St. Joseph’s Healthcare in Hamilton, Canada. The impact of depressive symptoms on the levels of interleukin (IL)-6, IL-10, tumor necrosis factor alpha (TNF-a), and C-reactive protein (CRP) at the third trimester of pregnancy, at 12 weeks postpartum, and across time was assessed using linear and mixed-model regression.
Results:Regression analysis revealed no significant association between depressive symptoms and any of the candidate biomarkers during pregnancy, at 12 weeks postpartum, or over time. Pregnancy depressive symptoms (p40.001), IL-6 (p = 0.025), and IL-10 (p = 0.006) were significant predictors of postpartum Edinburgh Perinatal Depression Scale (EPDS) score.
Conclusions: Our study supports previous reports from the literature showing no relationship between inflammatory biomarkers and depressive symptoms during late pregnancy, early postpartum, or across time. Our study is the first to observe an association between late pregnancy levels of IL-6 and IL-10 and postpartum depressive symptoms. Further studies with larger samples are required to confirm these findings.
Keywords: Perinatal; depression; cytokines; inflammation
Introduction
Between 7.4 and 12.8% of women suffer from depression during pregnancy, while 5.5 to 19.2% develop depression during the postpartum period.1,2Recent research exam-ining the biological basis of major depressive disorder (MDD) has focused on a potential inflammatory origin.3 Though it is generally accepted that this etiological path-way is applicable to only a sub-population of depressed patients,4 it may be particularly relevant for perinatal depression. The perinatal period involves a unique hormo-nal and immunological milieu, and perinatal depressive symptoms often co-occur with inflammatory morbidities of pregnancy, including preeclampsia, gestational diabetes, and preterm birth.5To date, many studies have examined this phenomenon by assessing differences in the levels cytokines and other inflammatory biomarkers during the perinatal period.
Cross-sectional studies conducted during pregnancy have differed considerably regarding the trimester of pre-gnancy, measure of depression severity, and inflamma-tory markers investigated. Some studies show positive associations between prenatal depressive symptoms and interleukin-6 (IL-6), tumor necrosis factor alpha (TNF-a), or C-reactive protein (CRP),6-8while others show a
nega-tive association9 (IL-6 and TNF-a) or no association at all.10,11 Studies of inflammatory markers during the
postpartum period have also produced mixed results. Two studies have shown a positive relationship between depressive symptoms and IL-6,12,13 and one has shown a negative association between depressive symptoms, interferon-gamma (IFN-g), and IFN-g/interleukin-10 (IL-10) ratio.13 One study has shown a positive relationship between depressive symptoms and transforming growth factor beta (TGF-b),14 while two others have failed to observe any association between postpartum depressive symptoms and markers of inflammation.15,16
Prospective studies examining depressive symptoms and inflammatory markers from pregnancy to postpartum are also inconclusive. Maes et al. have published three studies examining postpartum blues (symptoms of depression which occur between 24-48 hours after birth Correspondence: Benicio N. Frey, MD, MSc, PhD, Women’s Health
Concerns Clinic, St. Joseph’s Healthcare Hamilton, 100 West 5th Street, Suite C124, L8N 3K7, Hamilton.
E-mail: [email protected]
Submitted Dec 24 2015, accepted Feb 18 2016.
and 2 weeks postpartum). These studies suggest some association between symptoms of depression and anxi-ety, diagnostic history of MDD, and levels of IL-6 and IL-1ra. However, these studies compared ‘‘depression reactors’’ to ‘‘nonreactors’’ – which the authors defined by ranking participants based on q25, median, and q75 values of residualized scores of two symptom severity scales.17-19 This unconventional analysis limits the generalizability of these results. A small study including 27 women with a history of mood or anxiety issues (and therefore at high risk for developing postpartum depres-sion) by Scrandis et al. found a significant association between prenatal CRP levels and prenatal depressive symptoms. No relationship was observed between CRP and depressive symptoms at 5-6 weeks postpartum.20
Together, these studies suggest a relationship between perinatal depressive symptoms and inflammatory status. The purpose of our longitudinal study was to explore this relationship during a period of high risk for developing perinatal depressive symptoms. The specific aims of our study were to: 1) examine whether changes in inflamma-tory markers from pregnancy to postpartum were asso-ciated with changes in depressive symptoms; 2) examine whether third trimester inflammatory markers were predic-tive of postpartum depressive symptoms; and 3) examine the relationship between inflammatory markers and depres-sive symptoms during the third trimester of pregnancy and at 3 months postpartum.
Method
Participants and design
Participants were selected from a larger sample enrolled in a longitudinal study examining sleep quality, circadian rhythms, and depressive symptoms across the peri-natal period. Women were recruited for the larger study from the Women’s Health Concerns Clinic (WHCC) at St. Joseph’s Healthcare in Hamilton, Ontario, Canada, between February 2013 and October 2014. The WHCC is an outpatient clinical specializing in mood disruptions during the perinatal period that receives referrals mostly from family doctors in the community, but also from obstetric and midwifery clinics. Women referred to the WHCC are often experiencing a mood issue or have a past history of perinatal mood disturbances (and are therefore at risk for subsequent mood disruptions). Women were also recruited through community advertis-ing in midwifery and ultrasound clinics. Women were included if they were aged 18-45 years, in their third trimester of pregnancy (X26 weeks’ gestation), free of major medical comorbidities (e.g., diabetes, hypertension, or other inflammatory conditions), and if they were non-smokers. This study was reviewed and approved by the Hamilton Integrated Research Ethics Board and all participants provided written informed consent.
The longitudinal study involved two study visits to the WHCC, one during the third trimester of pregnancy (X26 weeks’ gestation) and one 12 weeks postpartum, as the prevalence of perinatal depressive symptoms is greatest between these two time points.1 During the first visit,
demographic information was collected and current and past psychiatric diagnoses were assessed. Women then completed a series of questionnaires examining current symptoms of depression, anxiety, and history of childhood trauma. A blood sample was also drawn. At 12 weeks postpartum, the women returned for a second study visit. On that occasion, they repeated the depression and anxiety symptom questionnaires from visit 1 and had another blood sample collected.
Data from participants who were free of psychotropic medication and provided blood samples at both time points were used for this study, resulting in a sample size of 33. Blood samples from these individuals were analyzed to determine levels of IL-6, IL-10, TNF-a, and CRP. With the exception of CRP, serum levels of these makers are known to follow a circadian rhythm,21 and while we attempted to collect blood samples at similar times at each visit, differences in availability made intra-individual variation in sampling time unavoidable. We therefore added time of blood sampling as a covariate to control for this variation in our analyses.
Clinical assessments
Psychiatric status was assessed using the MINI Neurop-sychiatric Interview22 version 6.0. Current symptoms of depression were assessed using the Edinburgh Perinatal Depression Scale (EDPS). The EPDS has good specifi-city and is sensitive to changes in depressive symptoms over time.23 To assess anxiety symptoms, participants completed the State Trait Anxiety Inventory (forms X and Y).24 To account for the potential interaction between inflammatory factors and prior trauma,10participants also completed the Childhood Trauma Questionnaire (CTQ).25
Biological samples and immunoassays
Blood was sampled from each participant between 8:15 a.m. and 3:30 p.m. For each participant, blood was drawn into a sterile 10 mL serum separator tube and left to clot at room temperature for 30 minutes. Samples were cen-trifuged at 20o
C for 15 minutes at 3,000 rpm. Serum was removed, aliquoted, and stored at -80 o
C. Commercial enzyme-linked immunosorbent assay (ELISA) kits for IL-6, IL-10, TNF-a, and CRP were purchased from R&D Systems (Minneapolis, MN). The published limit of detection and intra/interassay coefficients of variation for these assays are as follows: IL-6, 0.7 pg/mL, o 7%;
IL-10, 3.9 pg/mL,o7.5%; TNF-a, 0.19 pg/mL,o10.4%; CRP, 0.022 ng/mL, o 8.3%. On the day of the assay,
single aliquots of serum were thawed. All samples were assayed in duplicate and all analyses were performed according to the manufactures’ protocols by an experi-enced technician (MC) at St. Joseph’s Healthcare Research Laboratory in Hamilton, ON, Canada.
Statistical analysis
sample of 31. For each cytokine (IL-6, IL-10, TNF-a), sampling time and pre-pregnancy body mass index (BMI) were used as covariates. Because CRP levels are more stable and do not exhibit 24-hour variation, only pre-pregnancy BMI was used as a covariate. While we collected information regarding childhood trauma (CTQ) and anxiety symptoms (State-Trait Anxiety Inventory [STAI]), we observed very low variability in these scores across the sample. Therefore, to conserve power and in accordance with our modest sample size, we chose not to include these variables in the analyses.
To examine changes in inflammatory markers and depressive symptoms over time, we applied a mixed-model regression analysis, using each biomarker as the dependent variable. The use of each biomarker as the dependent variable (rather than EPDS score) has been used previously to assess the relationship between prenatal depressive symptoms and IL-6.6 The mixed-model method of regression does not require adjustments for normality and homogeneity of variance. Main effects for each regression model were evaluated using Wald’s chi-square test. To assess the explanatory power of each model, the difference in deviance between the test model and the null model (containing only the dependent variable and within subjects factor) was divided by the deviance of the null model (delta deviance). This results in a proportion that can be considered a pseudo adjusted R2value for mixed-model regression analyses.
To determine whether levels of each biomarker during pregnancy were predictive of postpartum depressive sym-ptoms, we computed linear regressions using postpartum EPDS scores as the dependent variable. Postpartum EPDS scores were skewed and required a log transforma-tion to meet regression assumptransforma-tions. Pregnancy EPDS score was strongly correlated with postpartum EPDS (rho = 0.72), and was included as a covariate in each model. Goodness of fit comparisons between linear models were assessed using anF-test.
To assess the impact of depressive symptoms on levels of each biomarker at each time point, we computed linear regressions using the candidate biomarker as the dependent variable. For each model, regression assump-tions were evaluated using a global validation procedure.26 To meet regression assumptions, pregnancy values of IL-10, TNF-a, and CRP required a log transformation. Pregnancy values of IL-6 satisfied all regression assump-tions. For postpartum regression models, values of IL-6, TNF-a, and CRP required log transformation. Postpartum IL-10 values satisfied all regression assumptions.
All analyses were completed using the statistical package R (version 3.1.3, http://R-project.org).
Results
Demographic and clinical characteristics are summarized in Table 1. Mean age was 30.764.0 years, and mean duration of gestation was 30.164.1 weeks. All partici-pants were married (100%); most were working full time (80.6%), were multiparous (61.3%), and had college or university education (87.1%). Third trimester mean scores on the EPDS were 5.264.1. About one-third (35.5%) had
experienced at least 1 major depressive episode in their lifetime, though none met current diagnostic criteria for a major depressive episode. EPDS scores did not differ significantly between pregnancy and postpartum visits. At the postpartum visit, two individuals (6.4%) met screening criteria for postpartum depression (EPDSX13).
Changes in inflammatory status and depressive symptoms from third trimester to 12 weeks postpartum
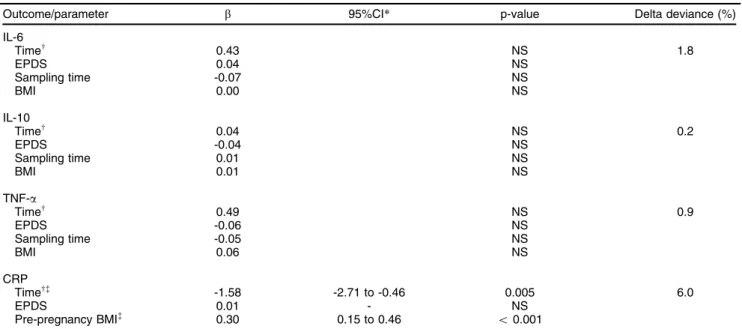
Results of our mixed-model regression analyses are summarized in Table 2. Levels of IL-6, IL-10, and TNF-a
did not change significantly from third trimester to 12 week postpartum (all p 4 0.05). CRP concentration decreased significantly over time (b= -1.58, 95%CI -2.71 to -0.46, p = 0.005). Higher pre-pregnancy BMI was associated with higher CRP concentration over time (b = 0.30, 95%CI 0.15-0.46, p o 0.001). EPDS score
did not emerge as a significant predictor of any bio-marker (all p 4 0.05). Delta deviance values were low (0.2-6.0%), suggesting a small to negligible con-tribution of parameters of time, EPDS, sampling time,
Table 1 Demographic characteristics of the study sample (n=31)
Pregnancy Postpartum
Age 30.7 (4.0)
-Gestational/postpartum week 30.1 (4.1) 13.5 (1.9) Pre-pregnancy BMI 24.6 (5.3) -Sampling time 10.6 (2.0) 12.3 (1.8) EPDS 5.2 (4.1) 4.5 (5.1) STAI 31.8 (8.3) 32.8 (11.1)
CTQ 30.0 (5.3)
-IL-6 (pg/mL) 1.5 (1.2) 1.8 (1.4) IL-10 (pg/mL) 11.7 (2.9) 11.8 (2.2) TNF-a(pg/mL) 1.2 (0.9) 1.6 (3.2) CRP (ng/mL) 4.8 (3.4) 3.2 (3.2) Primiparous 12 (38.7)
Multiparous 19 (61.3)
Marital status
Married/common law 31 (100)
Work status
Full-time 25 (80.7) Maternity leave 3 (9.7) Part-time 2 (6.4)
Student 1 (3.2)
Education
Less than high school 2 (6.4) High school 2 (6.4) College degree 11 (35.5) University degree 16 (51.7)
MDE status
Current 0 (0.0)
Past 11 (35.5)
Never 20 (64.5)
Data presented as mean (standard deviation) or n (%). Sampling time is represented as a decimal of the 24-hour clock (e.g., 00:00 = 0.0; 00:30 = 0.5; 24:00 = 24.0).
and pre-pregnancy BMI to the longitudinal trajectory of biomarker concentrations.
Pregnancy inflammatory markers and postpartum depressive symptoms
We examined whether third trimester inflammatory markers were predictive of depressive scores at 12 weeks post-partum. Results of these regression analyses are sum-marized in Table 3. Pregnancy EPDS (b= 0.14-0.16, 95%CI 0.08-0.19, p o 0.001), IL-6 (b = -0.22, 95%CI -0.42 to
-0.03, p = 0.025), and IL-10 (b = -1.28, 95%CI -2.17 to -0.39, p = 0.006) emerged as significant predictors of
postpartum EPDS score. No relationship was observed between postpartum EPDS score and TNF-a or CRP (p40.05). Regression coefficients were negative for both IL-6 and IL-10, indicating that a lower level of both of these cytokines during the third trimester of pregnancy was predictive of a higher postpartum EPDS score. To assess the strength of these effects we compared each model to a model containing pregnancy EPDS alone. Addition of either IL-6 or IL-10 resulted in a model with greater predictive power than that of the model containing pregnancy EPDS alone (IL-6:F= 5.62, p = 0.025, Adj-R2
+ 0.08; IL-10: F = 8.61, p = 0.006, Adj-R2+0.12).
Table 2 Mixed-model regression analysis examining changes in inflammatory markers and depressive symptoms over time Outcome/parameter b 95%CI* p-value Delta deviance (%)
IL-6
Timew 0.43 NS 1.8
EPDS 0.04 NS
Sampling time -0.07 NS
BMI 0.00 NS
IL-10
Timew 0.04 NS 0.2
EPDS -0.04 NS
Sampling time 0.01 NS
BMI 0.01 NS
TNF-a
Timew 0.49 NS 0.9
EPDS -0.06 NS
Sampling time -0.05 NS
BMI 0.06 NS
CRP
Timew= -1.58 -2.71 to -0.46 0.005 6.0
EPDS 0.01 - NS
Pre-pregnancy BMI= 0.30 0.15 to 0.46
o0.001
95%CI = 95% confidence interval; BMI = body mass index; CRP = C-reactive protein; EPDS = Edinburgh Perinatal Depression Scale; IL-6 = interleukin-6; IL-10 = interleukin-10; NS = non-significant; TNF-a= tumor necrosis factor alpha.
*95%CI values are reported only for significant effects.
wTime refers to the difference between visits (third trimester vs. 12 weeks postpartum). =
Significant main effect for predictor/covariate (po0.05).
Table 3 Summary of regression models examining pregnancy inflammatory markers and postpartum EPDS Score
Model/covariate bvalue 95%CI Predictor p Model F Model p Adjusted R2
1
IL-6* -0.22 -0.42 to -0.03 0.025 17.02 o0.001 0.52 Pregnancy EPDS* 0.16 0.10 to 0.22 o0.001
2
IL-10* -1.28 -2.17 to -0.39 0.006 19.78 o0.001 0.56
Pregnancy EPDS* 0.14 0.08 to 0.19 o0.001
3
TNF-a -0.13 NS 12.12 o0.001 0.42
Pregnancy EPDS* 0.14 0.08 to 0.20 o0.001
4
CRP -0.14 NS 12.81 o0.001 0.44
Pregnancy EPDS* 0.14 0.08 to 0.20 o0.001
95%CI = 95% confidence interval; CRP = C-reactive protein; EPDS = Edinburgh Perinatal Depression Scale; IL-6 = interleukin-6; IL-10 = interleukin-10; NS = non-significant; TNF-a= tumor necrosis factor alpha.
Inflammatory markers during pregnancy and postpartum period
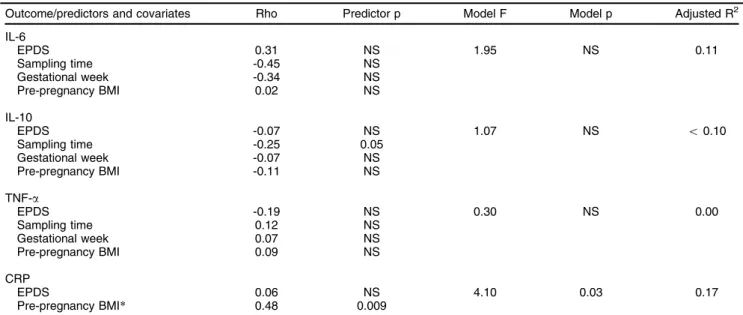
Regression analysis revealed no significant associa-tion between EPDS scores and any of the candidate biomarkers during pregnancy (Table 4). Despite sampling time being moderately correlated with IL-6, it was not a significant predictor following regression. Of note, pre-pregnancy BMI was also not correlated with IL-6 (rho = 0.02, p = 0.99). For IL-10, sampling time emerged as a
significant predictor (p = 0.05). TNF-a levels were not correlated with sampling time or pre-pregnancy BMI (all p 40.05). Pre-pregnancy BMI emerged as a signifi-cant predictor of CRP (p = 0.008). Overall only the model for CRP achieved statistical significance, explaining 17% of the variance in CRP concentration.
Regression models examining inflammatory markers during the postpartum period are summarized in Table 5. Sampling time and pre-pregnancy BMI were not correlated with IL-6, IL-10, or TNF-a (all p 4 0.05).
Table 4 Pregnancy inflammatory marker regression analysis
Outcome/predictors and covariates Rho Predictor p Model F Model p Adjusted R2
IL-6
EPDS 0.31 NS 1.95 NS 0.11
Sampling time -0.45 NS
Gestational week -0.34 NS
Pre-pregnancy BMI 0.02 NS
IL-10
EPDS -0.07 NS 1.07 NS o0.10
Sampling time -0.25 0.05
Gestational week -0.07 NS
Pre-pregnancy BMI -0.11 NS
TNF-a
EPDS -0.19 NS 0.30 NS 0.00
Sampling time 0.12 NS
Gestational week 0.07 NS
Pre-pregnancy BMI 0.09 NS
CRP
EPDS 0.06 NS 4.10 0.03 0.17
Pre-pregnancy BMI* 0.48 0.009
BMI = body mass index; CRP = C-reactive protein; EPDS = Edinburgh Perinatal Depression Scale; IL-6 = interleukin-6; IL-10 = interleukin-10; NS = non-significant; TNF-a= tumor necrosis factor alpha.
*Significant main effect for predictor/covariate (pp0.05).
Table 5 Regression analysis of postpartum inflammatory markers
Outcome/predictors and covariates Rho Predictor p Model F Model p Adjusted R2
IL-6
EPDS 0.06 NS 0.83 NS 0.00
Sampling time -0.19 NS
Postpartum week 0.17 NS
Pre-pregnancy BMI -0.09 NS
IL-10
EPDS -0.25 NS 0.60 NS 0.00
Sampling time -0.07 NS
Postpartum week -0.13 NS
Pre-pregnancy BMI 0.11 NS
TNF-a
EPDS 0.07 - - -
-Sampling time -0.03 Postpartum week 0.10 Pre-pregnancy BMI 0.19
CRP
EPDS 0.32 NS 4.43 0.02 0.19
Pre-pregnancy BMI* 0.44 0.009
BMI = body mass index; CRP = C-reactive protein; EPDS = Edinburgh Perinatal Depression Scale; IL-6 = interleukin-6; IL-10 = interleukin-10; NS = non-significant; TNF-a= tumor necrosis factor alpha.
TNF-amodel failed to meet regression assumptions despite multiple transformations.
Pre-pregnancy BMI remained a positive predictor of CRP (p = 0.009). Similar to pregnancy, no significant associa-tions between EPDS scores and IL-6, IL-10, or CRP were observed. We were unable to examine the influence of EPDS scores on TNF-aas multiple data transformations did not result in an acceptable model which satisfied all regression assumptions. The low level of correlation between TNF-a and EPDS (rho = 0.07, p-value non-significant) suggests that there was likely no significant relationship between them.
Discussion
In our study, we did not observe a significant association between pregnancy to postpartum changes in IL-6, IL-10, TNF-a, or CRP concentrations and changes in depressive symptoms. We did however observe a significant asso-ciation between pregnancy inflammatory markers (IL-6 and IL-10) and postpartum depressive symptoms. Like previous investigators, we also failed to detect a cross-sectional association between any of our candidate biomarkers and depressive symptoms during the third trimester or at 12 weeks postpartum.
During normal pregnancy there is a rise in both IL-6 and IL-10 levels from second to third trimester.27,28IL-6 and IL-10 are both associated with type 2 helper cell (Th2) immune responses,29and successful healthy pregnancy is generally considered to be a Th2 dominant phenom-enon.30 Our finding linking decreases in third trimester IL-6 and IL-10 with postpartum depressive symptoms suggests that late pregnancy reductions in Th2 immunity may affect the severity of postpartum depressive symp-toms. Another possibility is that our observed reductions in IL-6 and IL-10 were indicative of a shift toward Th1 immunity. Previous studies have shown that disruptions in Th1:Th2 ratio during pregnancy are associated with negative obstetric outcomes,31though no study has
examined how Th1:Th2 ratio may relate to perinatal depressive symptoms. It is important to note that other factors, particularly the diurnal variation in IL-6 and IL-10, may have influenced our findings. Larger prospective and longitudinal studies with control of sampling time and assessment of both Th1 (e.g., IFN-y) and Th2 cytokines are required to further examine this hypothesis.
The lack of cross-sectional association between inflam-matory markers and depressive symptoms in the present sample replicates the findings of previous studies of these biomarkers during pregnancy10,11 and the postpartum period15,16 which use the EPDS to assess depressive symptoms. Our study is also consistent with the pro-spective study conducted by Scrandis et al., who found no association between pregnancy CRP levels and post-partum depressive symptoms.20
Some limitations of our study are noteworthy. The mean level of depressive symptoms in our study popula-tion at both time points was in the subclinical range. The incidence of probable postpartum depression was also approximately half of what is observed in the general population (n = 2, 6.4 vs. 10-15%).1 This lower level of depressive symptomatology may be due to our exclusion of women taking psychotropic medication. As such, we
may have self-selected for a healthier or more resilient study population. The high degree of social support (100% of the women were married), high level of education (485% post-secondary), and absence of any current major depressive episodes during pregnancy further supports this assumption. While this limits the generalizability of our results, our assessment of a physically and psychiatrically healthy, medication free perinatal population provides a unique opportunity to examine the role of these biomarkers in the development of perinatal depressive symptoms. A further limitation of our study was our use of a single postpartum time point (12 weeks). It is possible that other transient factors, such as delivery method, breastfeeding status or maternal infections at 12 weeks could have influenced our findings. It is also possible that the relationship between depres-sive symptoms and biomarkers of inflammation during the first few weeks postpartum, as hormonal and immune responses normalize, differs from that of other periods. Our results are also somewhat limited by our small sample size, as we were unable to assess the role of other important covariates, including diagnostic history, childhood trauma, and current anxiety symptoms. How-ever, our sample size is similar to that of the only other perinatal study of similar design,20and our use of semi-structured diagnostic interviews and the perinatal-specific EPDS strengthens our results.
In conclusion, our study is the first to assess the change in perinatal inflammatory status over time and examine its relationship to perinatal depressive symp-toms. It is also the first study to observe an association between late pregnancy levels of IL-6 and IL-10 and postpartum depressive symptoms. Our findings support the absence of a relationship between inflammatory biomarkers and depressive symptoms during late preg-nancy or early postpartum, as reported by others. The present exploratory and preliminary results indicate that controlled longitudinal studies with larger, more depressed study populations, assessing both Th1 and Th2 cytokines, are required to examine the causality of these associations.
Acknowledgements
Funding for this study was provided in part by a student scholarship from the Father Sean O’Sullivan Research Centre and St. Joseph’s Healthcare Hamilton.
Disclosure
The authors report no conflicts of interest.
References
1 Gavin NI, Gaynes BN, Lohr KN, Meltzer-Brody S, Gartlehner G, Swinson T. Perinatal depression: a systematic review of prevalence and incidence. Obstet Gynecol. 2005;106:1071-83.
2 Bennett HA, Einarson A, Taddio A, Koren G, Einarson TR. Pre-valence of depression during pregnancy: systematic review. Obstet Gynecol. 2004;103:698-709.
4 Raison CL, Miller AH. Is depression an inflammatory disorder? Curr Psychiatry Rep. 2011;13:467-75.
5 Osborne LM, Monk C. Perinatal depression--the fourth inflammatory morbidity of pregnancy?: Theory and literature review. Psychoneur-oendocrinology. 2013;38:1929-52.
6 Christian LM, Franco A, Glaser R, Iams JD. Depressive symptoms are associated with elevated serum proinflammatory cytokines among pregnant women. Brain Behav Immun. 2009;23:750-4. 7 Cassidy-Bushrow AE, Peters RM, Johnson DA, Templin TN.
Asso-ciation of depressive symptoms with inflammatory biomarkers among pregnant African-American women. J Reprod Immunol. 2012;94: 202-9.
8 Azar R, Mercer D. Mild depressive symptoms are associated with elevated C-reactive protein and proinflammatory cytokine levels during early to midgestation: a prospective pilot study. J Womens Health (Larchmt). 2012;22:385-9.
9 Shelton MM, Schminkey DL, Groer MW. Relationships among prenatal depression, plasma cortisol, and inflammatory cytokines. Biol Res Nurs. 2014;17:295-302.
10 Blackmore ER, Moynihan JA, Rubinow DR, Pressman EK, Gilchrist M, O’Connor TG. Psychiatric symptoms and proinflammatory cyto-kines in pregnancy. Psychosom Med. 2011;73:656-63.
11 Blackmore ER, Groth SW, Chen DG, Gilchrist MA, O’Connor TG, Moynihan JA. Depressive symptoms and proinflammatory cytokines across the perinatal period in African American women. J Psychosom Obstet Gynaecol. 2014;35:8-15.
12 Corwin EJ, Johnston N, Pugh L. Symptoms of postpartum depression associated with elevated levels of interleukin-1 beta during the first month postpartum. Biol Res Nurs. 2008;10:128-33.
13 Groer MW, Morgan K. Immune, health and endocrine characteristics of depressed postpartum mothers. Psychoneuroendocrinology. 2007;32:133-9.
14 Kondo N, Suda Y, Nakao A, Oh-Oka K, Suzuki K, Ishimaru K, et al. Maternal psychosocial factors determining the concentrations of transforming growth factor-beta in breast milk. Pediatr Allergy Immunol. 2011;22:853-61.
15 Boufidou F, Lambrinoudaki I, Argeitis J, Zervas IM, Pliatsika P, Leonardou AA, et al. CSF and plasma cytokines at delivery and postpartum mood disturbances. J Affect Disord. 2009;115:287-92. 16 Skalkidou A, Sylve´n SM, Papadopoulos FC, Olovsson M, Larsson A,
Sundstro¨m-Poromaa I. Risk of postpartum depression in association with serum leptin and interleukin-6 levels at delivery: a nested case-control study within the UPPSAT cohort. Psychoneuroendocrinology. 2009;34:1329-37.
17 Maes M, Ombelet W, Libbrecht II, Stevens K, Kenis G, De Jongh R, et al. Effects of pregnancy and delivery on serum concentrations of Clara Cell Protein (CC16), an endogenous anticytokine: lower serum
CC16 is related to postpartum depression. Psychiatry Res. 1999; 87:117-27.
18 Maes M, Lin AH, Ombelet W, Stevens K, Kenis G, De Jongh R, et al. Immune activation in the early puerperium is related to postpartum anxiety and depressive symptoms. Psychoneuroendocrinology. 2000;25:121-37.
19 Maes M, Ombelet W, De Jongh R, Kenis G, Bosmans E. The inflammatory response following delivery is amplified in women who previously suffered from major depression, suggesting that major depression is accompanied by a sensitization of the inflammatory response system. J Affect Disord. 2001;63:85-92.
20 Scrandis DA, Langenberg P, Tonelli LH, Sheikh TM, Manogura AC, Alberico LA, et al. Prepartum depressive symptoms correlate posi-tively with c-reactive protein levels and negaposi-tively with tryptophan levels: a preliminary report. Int J Child Health Hum Dev. 2008;1: 167-74.
21 Lange T, Dimitrov S, Born J. Effects of sleep and circadian rhythm on the human immune system. Ann N Y Acad Sci. 2010;1193:48-59. 22 Sheehan DV, Lecrubier YH, Harnett-Sheehan K, Janavs J, Weiller E,
Keskiner A, et al. Validity of the Mini International Neuropsychiatric Interview (MINI) according to the SCID-P and its reliability. Eur Psychiatry. 1997;12:232-41.
23 Cox JL, Holden JM, Sagovsky R. Detection of postnatal depression. Development of the 10-item Edinburgh Postnatal Depression Scale. Br J Psychiatry. 1987;150:782-6.
24 Spielberger CD. State-trait anxiety inventory. Washington: John Wiley & Sons Inc; 2010.
25 Bernstein DP, Fink L, Handelsman L, Foote J, Lovejoy M, Wenzel K, et al. Initial reliability and validity of a new retrospective measure of child-abuse and neglect. Am J Psychiatry. 1994;151:1132-6. 26 Pena EA, Slate EH. Global validation of linear model assumptions.
J Am Stat Assoc. 2006;101:341.
27 Thaxton JE, Sharma S. Interleukin-10: a multi-faceted agent of pregnancy. Am J Reprod Immunol. 2010;63:482-91.
28 Opsjon SL, Wathen NC, Tingulstad S, Wiedswang G, Sundan A, Waage A, et al. Tumor necrosis factor, interleukin-1, and interleukin-6 in normal human pregnancy. Am J Obstet Gynecol. 1993;169: 397-404.
29 Mosmann TR, Sad S. The expanding universe of T-cell subsets: Th1, Th2 and more. Immunol Today. 1996;17:138-46.
30 Wegmann TG, Lin H, Guilbert L, Mosmann TR. Bi-directional cyto-kine interactions in the maternal-fetal relationship: is a successful pregnancy a Th2 phenomenon? Immunol Today. 1993;14:353-6. 31 Saito S, Sakai M, Sasaki Y, Tanebe K, Tsuda H, Michimata T.