Efectiveness of insulin solution: a comparison
between diferent times for maintaining the solution
Eiciência da solução de insulina: comparação entre diferentes
tempos de manutenção da solução
INTRODUCTION
The critically ill patient, either previously diabetic or not, trends to show increased blood glucose levels. This hyperglycemia, called “stress hyperglycemia” is characterized by insulin resistance, catecholaminergic reduced pancreas insulin secretion, increased angiotensin II levels, and proinflammatory cytokines release changing the insulin receptors.(1)
Hyperglycemia is a natural body response to metabolic stress caused by hormone changes. Additionally, the critically ill patient care increases hyperglycemic response due to corticosteroids, adrenergic agents and glu-cose rich nutrition support use. Although being a physiologic body re-sponse, blood glucose levels reduction improves the outcome and reduces complications risk, particularly infective.(2)
Increased blood glucose levels change the immune function and
ap-Carmen Maria Lazzari1, Taína
Volkart2
1. MSc, Post-Graduation PhD Student of the Cardiology Sciences Post-Graduation Program of Universidade Federal do Rio Grande do Sul – UFRGS - Porto Alegre (RS), Brasil; Professor for the Nursing Graduation Course and Intensive Care Post-Graduation Program of Universidade do Vale do Rio dos Sinos – UNISINOS - São Leopoldo (RS), Brasil.
2. Intensive Care Unit of Hospital Geral de Porto Alegre – Porto Alegre (RS), Brazil.
ABSTRACT
Background: Hyperglycemia is
fre-quent in the critically ill patient, and is a risk factor for unfavorable clinical outcomes, including mortality. During the recent years, intensive blood glucose control using intravenous insulin infu-sion has gained a prominent role in the critically ill patient management. here is important concern on insulin solution continued eicacy over the time, as little the literature available on this subject is poor. Lack of evidence is known to lead to inappropriate practices. his study aimed to compare the blood glucose lev-els between two diferent protocols in an intensive care unit in Porto Alegre, using the same solution concentration and two diferent replacement times during the irst 24 hours, and additionally to assess the protocol-related hypoglycemia rate.
Methods: he medical charts of 80
patients under insulin therapy for over 24
hours during 2008 were revised; 40 pa-tients had their insulin solution replaced every 6 hours and for 40 patients the in-sulin solution was replaced after 24 hours.
Results: he causes for admission
to the intensive care unit included more frequently hypertensive (68.8%) and diabetic (45%) patients. No signiicant capillary blood glucose diferences were seen for the every 6 or 24 hours solution replacement groups. Only 3 mild hypo-glycemia cases were observed in the ev-ery 6 hours replacement group, and no hypoglycemia was seen in the 24 hours replacement group.
Conclusion: We concluded that
keeping insulin infusion, replacing the solution every 24 hours is feasible. How-ever, longer infusion time studies are re-quired to check for possible hypoglyce-mic events as insulin therapy advances.
Keywords: Hyperglycemia; Insulin
therapy; Critical patient his work was developed at the
Intensive Care Unit of Hospital Geral de Porto Alegre – Porto Alegre (RS), Brazil.
Submitted on April 14, 2010 Accepted on September 8, 2010
Author for correspondence:
Taína Volkart
Rua Tristão de Alencar, 601 - Bairro Primavera
ZIP Code: 93340-130 - Novo Hamburgo (RS), Brazil. Phone: +55 51 3556-1988 +55 51 8547-0513
propriate glucose control improves the macrophage/ neutrophil function. Insulin has anti-inflammatory effects, as demonstrated by reduced C-reactive protein production. Has anabolic effects, and favorable effects on coagulation and fibrinolysis.(3)
In the last years, intensive blood glucose control, using continued intravenous infusion, took over a rel-evant role on the critically ill patient management. The premise is that maintaining normal blood glucose levels is associated with lower infection and organ fail-ure rates, and therefore, lower mortality rates.(4)
Hypoglycemia is considered the main complica-tion associated with continued venous insulin therapy, and severe hypoglycemia is seen in 4% to 7% of these patients. Severe hypoglycemia is considered when the blood glucose level is below 40 mg/dL; moderate from 41 to 60 mg/dL; and mild from 61 to 70 mg/dL.(4)
Some explanations are suggested as likely causes of increased hypoglycemia rates during intensive blood glucose control: excess insulin administration, failure of glucagon response to epinephrine, previously re-duced consciousness level (sedation and other clinical causes), other hormone deficiencies, other associated drugs, discontinuity of the nutrition support, or or-gan dysfunction.(5)
Insulin adsorption is an unspecific surface phe-nomenon, poorly understood, which starts suddenly and disturbs trustful insulin offer to the patient. Due to this phenomenon, in most of the institutions the solution is replaced every 6 hours. It is discussed if glycemic changes would occur in longer time infusion solution replacements.(6) This study aimed to compare
the glycemic levels between two different protocols involving different solution replacement times, and to identify protocol-associated hypoglycemic rates.
METHODS
A retrospective, descriptive with quantitative anal-ysis study was conducted, using the medical charts from 80 patients who stayed in the intensive care unit of the Hospital Geral de Porto Alegre and underwent insulin therapy for more than 24 hours; 40 patients were in the protocol with insulin solutions replaced every 6 hours, and 40 patients were in the 24 hours insulin solution replacement protocol. The study was approved by the Hospital Geral de Porto Alegre’s Eth-ics Committee, after signature of a commitment with data use document.
In September 2008 the insulin therapy protocol
was changed, keeping the same solution concentration but changing the solution replacement time to every 24 hours. The medical charts were randomly selected both pre- and post- protocol change, and evaluated for the study purposes.
For both protocols (replacement either every 6 or 24 hours), the insulin solutions were similarly pre-pared, with 50 IU regular insulin in 100 mL 0.9% normal saline, obligatorily infused with an infusion pump at the institution’s protocol-defined infusion rate. Capillary blood glucose assessments were made hourly.
The mean blood glucose levels were compared between the protocols on the 7th, 13th, 19th and 25th
hours, and hypoglycemic events were checked by the solution replacement times.
The results are presented with descriptive statistics, using arithmetic means and respective standard devia-tions (SD). The inter-group “before-after” compari-sons were analyzed using the Wilcoxon test and the in-ter-groups comparisons (“6 hours” versus “24 hours”) analyzed with the Mann-Whitney test. All statistical procedures were performed using the SPSS software (version 16), with a p ≤ 0.05 significance level.
RESULTS
he study population was characterized according to age, gender, admission cause and comorbidities (Ta-ble 1). he most frequent admission causes were related to cardiovascular diseases, showing high incidence of hypertensive and diabetic patients, and increased use of corticosteroids and norepinephrine for both groups. he studied patients had ages ranging between 27 and 90 years (mean 72.2 ± 12.2 years for the group with every 6 hours solution replacement, and 64.0 ± 16.4 for the group with replacement after 24 hours).
Considering H0 as the time of infusion start, and comparing the mean blood glucose levels between the protocols by the insulin solution replacement times, we identiied no change on the 25th hour insulin solution
efectiveness. he groups comparison failed to show any signiicant diference for the mean 7th, 13th, 19th
and 25th hours blood glucose levels (Table 2, Figure 1).
Table 1 – Sample characterization by groups
Variable 6 hours re-placement (N=40)
24 hours replacement
(N=40)
p value
Male gender 17 (42.5) 24 (60.0) 0.12 Age (years) 72.2 ± 12.2 64.0 ± 16.4 Cause of admission
Stroke/cerebral aneurism
6 (15.0) 11 (27.5)
Sepsis 4 (10.0) 7 (17.5) Acute myocardial
infarction
5 (12.5) 7 ( 17.5)
Respiratory failure 7 (17.5) 4 (10.0) 0.10 BCP/COPD/
pulmonary emphysema
7 (17.5) 3 (7.5)
Congestive heart failure
4 (10.0) 1 (2.5)
Others 7 (17.5) 7 (17.5) Comorbidities
Systemic arterial hypertension
26 (65.0) 29 (72.5)
Diabete mellitus 21 (52.5) 13 (32.5) Cancer 6 (15.0) 5 (12.5)
COPD 7 (17.5) 4 (10.0) 0.42 Urinary tract
infection
4 (10.0) 5 (12.5)
Renal failure 4 (10.0) 2 (5.0) Stroke 4 (10.0) 1 (2.5) Others 11 (27.5) 8 (20.0) Diet
Enteral 23 (57.5) 13 (32.5)
No oral ingestion 14 (35.0) 20 (50.0) 0.07 Oral 3 (7.5) 7 (17.5)
Dialysis
No 38 (95.0) 36 (90.0) 0.40 Continued
hemodialysis
2 (5.0) 4 (10.0)
Corticoid
No 14 (60.0) 16 (40.0)
Hydrocortisone 22 (55.0) 24 (60.0) 0.12 Methylprednisolone 4 (10.0) 0
Vasoactive drugs
No 11 (27.5) 13 (32.5)
Noradrenaline 24 (60.0) 24 (60.0) 0.08 Others 5 (12.5) 3 (7.5)
BCP – bronchopneumonia; COPD – chronic obstructive pulmonary disease. Results expressed as number (%) or mean ± standard deviation.
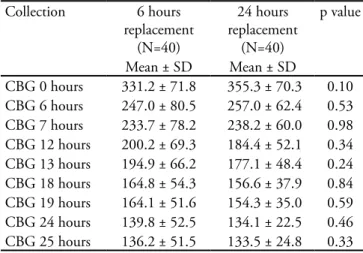
Table 2 – Inter-groups blood glucose levels comparison
Collection 6 hours replacement
(N=40)
24 hours replacement
(N=40)
p value
Mean ± SD Mean ± SD
CBG 0 hours 331.2 ± 71.8 355.3 ± 70.3 0.10 CBG 6 hours 247.0 ± 80.5 257.0 ± 62.4 0.53 CBG 7 hours 233.7 ± 78.2 238.2 ± 60.0 0.98 CBG 12 hours 200.2 ± 69.3 184.4 ± 52.1 0.34 CBG 13 hours 194.9 ± 66.2 177.1 ± 48.4 0.24 CBG 18 hours 164.8 ± 54.3 156.6 ± 37.9 0.84 CBG 19 hours 164.1 ± 51.6 154.3 ± 35.0 0.59 CBG 24 hours 139.8 ± 52.5 134.1 ± 22.5 0.46 CBG 25 hours 136.2 ± 51.5 133.5 ± 24.8 0.33 CPG – capillary blood glucose; SD – standard deviation. Results expressed as mean ± standard deviation.
CI – conidence interval.
Figure 1 - Evolution of blood glucose between the groups.
DISCUSSION
From the results, both insulin solution and pro-tocol were shown to be effective. We could identify that patients in both protocols are receiving the insu-lin doses required to lower their blood glucose levels, with no significant influence of the time for the solu-tion replacement, either after 6 or 24 hours.
healthcare resources management, we could men-tion the costs issue. I.e., every manager should take into consideration the cost-benefit ratio.(7)
Insti-tutions that use insulin therapy for blood glucose normalization do so based on their patients char-acteristics and their technical team. The protocol will guide how the solution must be prepared, its concentration, cautions for infusion and insulin therapy patients’ management.
In our literature research, we couldn’t find any guidance on the insulin solution time of effective-ness; neither could find any information on relation-ship of the hypoglycemia rate with the time of the solution replacement.
This study showed that both protocols, either replacing the insulin solution after 6 hours or 24 hours, are safe regarding hypoglycemia, and effec-tive for lowering capillary blood glucose to the tar-get levels. No change was observed on the 25th hour
solution effectiveness, thus suggesting that it is not necessary replacing the solution every 6 hours. Hy-poglycemia is concerning, as it is the main contin-ued venous insulin therapy complication, however was infrequently seen in this study. Only mild hypo-glycemia cases were identified in the most frequent solution replacement (every 6 hours); however, one should bear in mind that, as those were the first 24 hours in the protocol and during this time blood glu-cose levels are still normalizing, hypoglycemia inci-dence rates may increase later.
From this study we concluded that institutions replacing the venous insulin therapy solutions every 24 hours are not wrong, as this causes no harm to the patient. Both protocols may be considered safe, how-ever one should have in mind that shorter than how-every 24 hours replacements lead to increased material and human resources expenditures.
We should highlight that this was a retrospective trial evaluating a very small number of patients per group, and that this evaluation only covered the pro-tocol first 24 hours, while the blood glucose levels are still adjusting. However, comparing the blood glucose levels at 6 hours intervals, the blood glucose levels were found similar.
CONCLUSION
Although this trial evaluated a small number of patients, and the evaluation covered only the first 24 hours of infusion, we conclude that it is possible to keep the insulin solution infusion with every 24 hours replacement. Studies evaluating longer infu-sion times, looking for eventual hypoglycemic events as insulin therapy advances, are suggested.
RESUMO
Objetivos: A hiperglicemia ocorre com frequência nos
doentes críticos, sendo um fator de risco para evolução clínica desfavorável e aumento da mortalidade. Nos úl-timos anos, o controle glicêmico intensivo, obtido pela infusão venosa contínua de insulina, passou a ocupar lugar de destaque no manejo dos pacientes críticos. Há dúvi-das frequentes e importantes sobre o tempo de eficiência da solução de insulina, por não existir referência na lite-ratura. Sabe-se que a falta de evidências frequentemente favorece práticas impróprias. O objetivo deste estudo foi comparar glicemias entre dois protocolos diferentes, utili-zados na unidade de terapia intensiva de uma instituição de Porto Alegre, quanto ao tempo de troca da solução, nas primeiras 24 horas de uso, sendo a concentração da solu-ção a mesma; e verificar a taxa de hipoglicemia relacionada aos protocolos.
Métodos: Foram avaliados 80 prontuários de pacientes
que utilizaram insulinoterapia por mais de 24 horas no ano de 2008, sendo que 40 deles fizeram uso do protocolo com troca da solução de insulina a cada 6 horas e 40 com troca a cada 24 horas.
Resultados: Observou-se entre os motivos de
interna-ção elevada incidência de pacientes hipertensos (68,8%) e diabéticos (45%). Não houve diferenças significativas entre as trocas a cada 6 e 24 horas durante todo o período da co-leta com relação a glicemia capilar. Houve apenas 3 casos de hipoglicemia leve, todos no grupo de troca a cada 6 horas.
Conclusão: Com o presente estudo, concluiu-se que é
possível manter infusões de insulina promovendo a troca da solução a cada 24 horas. Sugerem-se, porém, estudos avaliando maior tempo de infusão em busca de possíveis eventos hipoglicêmicos com o avanço da insulinoterapia.
REFERENCES
1. Salaverría Garzón I, Cruz Acquaroni MM, Raigal Caño A, Alonso García A, Sánchez Rodríguez P. Evaluación de un protocolo de perfusión continua de insulina en enfermos críticos. Med Intensiva. 2007;31(9):485-90.
2. Nasraway SA Jr. Hyperglycemia during critical ilness. JPEN J Parenter Enteral Nutr. 2006;30(3):254-8.
3. Cerqueira MP. Terapia insulínica nos doentes críticos. In: Cavalcanti IL, Cantinho FAF, Assad A, editores. Medicina Perioperatória. Rio de Janeiro: Sociedade de Anestesiologia do Estado do Rio de Janeiro; 2006. Cap. 100. p. 897-901. 4. Diener JRC, Prazeres CEE, Rosa CM, Alberton UC.
Avaliação da efetividade e segurança do protocolo de infusão de insulina de Yale para o controle glicêmico intensivo. Rev Bras Ter Intensiva. 2006;18(3):268-75. 5. van den Berghe G, Wouters P, Weekers F, Verwaest
C, Bruyninckx F, Schetz M, et al. Intensive insulin therapy in critically ill patients. N Engl J Med. 2001;345(19):1359-67.
6. Lima SA, Andreoli RLF, Grossi SAA, Secoli SR. Insulina intravenosa: controvérsias sobre o processo de adsorção nos dispositivos de infusão. Rev Gaúcha Enferm. 2008;29(2):292-300.