Inspirato ry flo w-vo lum e curve
in sno ring patie nts with and
witho ut o bstructive sle e p apne a
Departamento de Clínica Médica, Faculdade de Ciências da Saúde, Universidade de Brasília, Brasília, DF, Brasil
V.M. Amado, A.C.G.A. Costa, M. Guiot, C.A. Viegas and P. Tavares
Abstract
We analyzed the flow-volume curves of 50 patients with complaints of snoring and daytime sleepiness in treatment at the Pneumology Unit of the University Hospital of Brasília. The total group was divided into snorers without obstructive sleep apnea (OSA) (N = 19) and snorers with OSA (N = 31); the patients with OSA were subdivided into two groups according to the apnea/hypopnea index (AHI): AHI<20/h (N = 14) and AHI>20/h (N = 17). The control group (N = 10) consisted of nonsmoking subjects without complaints of snoring, daytime sleepi-ness or pulmonary diseases. The population studied (control and patients) consisted of males of similar age, height and body mass index (BMI); spirometric data were also similar in the four groups. There was no significative difference in the ratio of forced expiratory and inspiratory flows (FEF50%/FIF50%)in any group: control, 0.89; snorers, 1.11; snorers with OSA (AHI<20/h), 1.42, and snorers with OSA (AHI>20/h), 1.64. The FIF at 50% of vital capacity (FIF50%) of snoring patients with or without OSA was lower than the FIF50% of the control group (P<0.05): snorers 4.30 l/s; snorers with OSA (AHI<20/h) 3.69 l/s; snorers with OSA (AHI>20/h) 3.17 l/s and control group 5.48 l/s. The FIF50% of patients with severe OSA (AHI>20/h) was lower than the FIF50% of snorers without OSA (P<0.05): 3.17 l/s and 4.30 l/s, respectively. We conclude that 1) the FEF50%/FIF50% ratio is not useful for predicting OSA, and 2) FIF50% is decreased in snoring patients with and without OSA, suggesting that these patients have increased upper airway resistance (UAR).
Co rre spo nde nce
P. Tavares
Laboratório de Fisiologia Respiratória
Departamento de Clínica Médica FS, Universidade de Brasília
70910-900 Brasília, DF Brasil
Fax: + 55-61-224-5038 E-mail: ptavares@ abordo.com.br
Research supported by FAPDF (No. 190.000.285/94).
Received March 6, 1998 Accepted December 21, 1998
Ke y wo rds
·Sleep
·Flow-volume curve
·O bstructive sleep apnea
·Snoring
·Upper airway resistance
Intro ductio n
Patients with obstructive sleep apnea (OSA) show episodic obstructions of the upper airway during sleep. It is known that these patients present anatomic and func-tional alterations of the upper airway (1-3).
The flow-volume curve has been used to define standards that can identify patients
with OSA. The parameters that have been used are the saw-tooth and the index of forced expiratory flow (FEF) to forced inspiratory flow (FIF) at 50% of vital capacity (FEF50%/
FIF50%) (4-10). Although alterations in the
In the present study we analyzed the in-spiratory and expiratory flow-volume curves in snorers with and without OSA and com-pared them to a control group.
Subje cts and Me tho ds
We reviewed the data of 50 patients un-der treatment at the sleep laboratory of the Pneumology Unit of the University Hospital of Brasília (HUB) with complaints of snor-ing and daytime hypersomnolence. After completing a detailed questionnaire about sleep disorders, all patients were submitted to polysomnography (PSG). The procedure consisted of continuously recording 3 chan-nels of the electroencephalogram (EEG), 2 channels of the electrooculogram (EOG), and 1 channel of the submentonian elec-tromyogram (EMG). The electrocardiogram (ECG) and oxygen saturation were also recorded, as well as the non-calibrated respiratory flow and the thoracic movements. The PSG was based on the method of Rechtschaffen and Kales (11), recently re-vised by Carskadon and Rechtschaffen (12). A 16-channel Berger polygraph model TW 102 (São Paulo, SP, Brazil) and a pulse oximeter (Biochem International Inc., Waukesha, WI, USA) were used to record sleep and oxygen saturation.
The patients were divided into snorers
without OSA (N = 19) and snorers with OSA (31) according to the results of the PSG. The group of patients with OSA was further sub-divided into 14 patients with an apnea/ hypopnea index (AHI) <20/h and 17 patients with AHI>20/h. The patients were compared to the control group consisting of 10 non-smoking persons without complaints of snor-ing, daytime hypersomnolence, or pulmo-nary disease. Thus, 4 groups were studied.
After PSG the subjects underwent pul-monary function testing, which included spirometric evaluation with a Futuremed Spiro Analyzer ST-250 (New York, NY, USA), performed according to the standards of the American Thoracic Society (13), and arterial gasometry. The spirometric variables studied were forced vital capacity (FVC), forced expiratory volume in 1 s (FEV1), and
forced expiratory flow between 25 and 75% of FVC (FEF25-75%). The expiratory
flow-volume curve provided peak expiratory flow (PEF), forced expiratory flow at 50% of FVC (FEF50%), and forced expiratory flow at
75% of FVC (FEF75%). The inspiratory
flow-volume curve provided peak inspiratory flow (PIF), forced inspiratory flow at 50% of FVC (FIF50%), and the ratio FEF50% to FIF50%
(FEF50%/FIF50%).
All subjects were males of similar age, height, and body mass index (BMI). Statisti-cal significance was assessed by nonpara-metric ANOVA followed by the method of Dunn, and P<0.05 was considered to be statistically significant.
Re sults
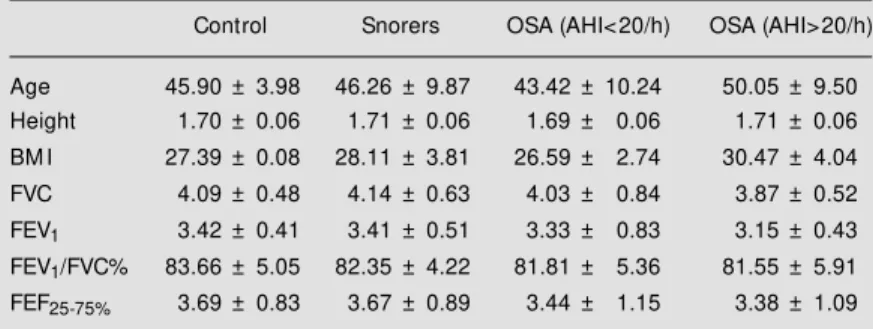
Table 1 shows the mean values of age, height, BMI and spirometric data in the four groups studied. Statistical analysis showed that the values were similar for all groups.
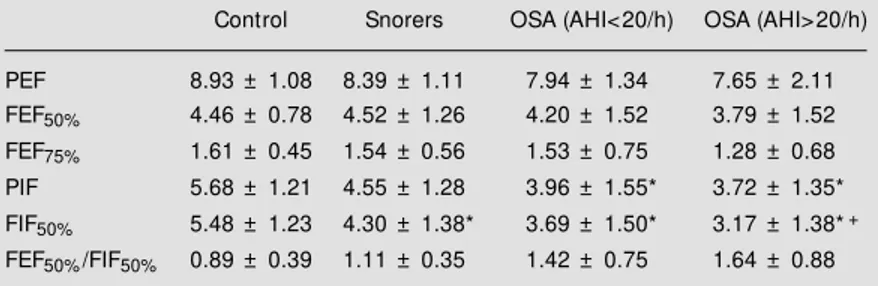
The parameters of the expiratory and in-spiratory flow-volume curves and the FEF50%/
FIF50% ratio are given in Table 2. Regarding
the FEF50%/FIF50%,no significant difference
(P = 0.07) was observed between the 4 groups.
Table 1 - Anthropometric and spirometric data for the patients studied.
Data are reported as mean ± SD. OSA: Obstructive sleep apnea; AHI: apnea/hypopnea index; BM I: body mass index; FVC: forced vital capacity; FEV1: forced expiratory volume in 1 s; FEF25-75%: forced expiratory flow betw een 25 and 75% of FVC.
Control Snorers OSA (AHI<20/h) OSA (AHI>20/h)
Age 45.90 ± 3.98 46.26 ± 9.87 43.42 ± 10.24 50.05 ± 9.50 Height 1.70 ± 0.06 1.71 ± 0.06 1.69 ± 0.06 1.71 ± 0.06
BM I 27.39 ± 0.08 28.11 ± 3.81 26.59 ± 2.74 30.47 ± 4.04
FVC 4.09 ± 0.48 4.14 ± 0.63 4.03 ± 0.84 3.87 ± 0.52
With respect to the expiratory loop of the curve, PEF, FEF50% and FEF75% were similar
for all groups. With respect to the inspiratory loop, both groups of snorers with OSA (AHI<20/h and AHI>20/h) had a lower PIF than the control group (P<0.05), snorers with and without OSA had a lower FIF50% than
the control group (P<0.05), and snorers with severe OSA (AHI>20/h) had a lower FIF50%
than the group of snorers without OSA (P<0.05).
D iscussio n
Studies regarding pharynx geometry in awake patients with OSA have shown that the pharyngeal diameter of these subjects is smaller than normal (1). Studies of the pha-ryngeal muscles of awake patients with OSA have demonstrated that in these patients added inspiratory resistive loads do not pro-voke an adequate muscular response in pha-ryngeal zones, where greater collapsibility is found. These results suggest that there may be an altered regulation of these structures (14). Other studies on the upper airway re-sistance (UAR) of patients with OSA, using transducers placed in different pharyngeal zones, have shown that the UAR is higher in these patients than in normal subjects (15,16). These data suggest that the causes of OSA may be primarily anatomic, and that some muscular regulation factor may be altered, leading to an increase in upper airway resis-tance even in the awake state. During sleep these alterations may be much more pro-nounced causing periodic occlusions of the pharynx (17,18).
The flow-volume curve, mainly the in-spiratory phase, has been the parameter most frequently used to look for a simple way to pinpoint patients with OSA, since the PSG is a difficult and expensive exam. The saw-tooth signal and an FEF50%/FIF50% ratio >1.0
have been the most used variables, but there are controversies about their reliability (4,5). Haponik et al. (10) studied the FEF50%/FIF50%
and the PIF in two groups of patients, 27 with OSA and 25 without OSA, and ob-served that the group with OSA had FEF50%/
FIF50% >1.0 and lower PIF. The authors
con-cluded that the flow-volume curve was use-ful for the diagnosis of OSA. Tammelin et al. (8) studied the flow-volume curve and per-formed fiberoptic nasopharyngoscopy in 22 patients with OSA. They observed that, in the presence of endoscopic alterations of the upper airway, the flow-volume curve was often abnormal (saw-tooth, FEF50%/FIF50%
>1.0 or both). The authors concluded that patients with OSA and an abnormal flow-volume curve are likely to present anatomi-cal alterations of the upper airway.
Hoffstein et al. (5) analyzed 405 patients referred to the sleep laboratory with the ma-jor complaint of snoring. According to the PSG, the patients were divided into 207 with OSA and 198 without OSA. The authors showed that the FEF50%/FIF50% ratio did not
differ between groups. Rauscher et al. (6) showed that the FEF50%/FIF50% ratio and
saw-tooth sign are of limited value for predicting OSA and Katz et al. (7) reported similar results.
We examined 50 male patients with com-plaints of snoring and daytime sleepiness and compared them to a control group. The FEF50%/FIF50% ratio was not significantly
dif-Table 2 - Expiratory and inspiratory flow s for the patients studied.
Values are reported as means ± SEM . OSA: Obstructive sleep-apnea; AHI: apnea/ hypopnea index; PEF: peak expiratory flow ; FEF50%: forced expiratory flow at 50% of forced vital capacity (FVC); FEF75%: forced expiratory flow at 75% of FVC; FIF50%: forced inspiratory flow at 50% of FVC; PIF: peak inspiratory flow ; FEF50%/FIF50%: ratio of FEF50% to FIF50%. * P<0.05 vs control; +P<0.05 vs snorers (ANOVA).
Control Snorers OSA (AHI<20/h) OSA (AHI>20/h)
PEF 8.93 ± 1.08 8.39 ± 1.11 7.94 ± 1.34 7.65 ± 2.11
ferent in the four groups studied. In other words, the FEF50%/FIF50% ratio is not helpful
to diagnose OSA among snoring patients. Regarding the inspiratory flows, snorers with and without OSA have a significantly lower FIF50% than normal subjects, and snoring
patients with OSA have a significantly lower PIF than the control group.
It is interesting to note that snorers with mild OSA (AHI<20/h) and snorers without OSA have a similar FIF50%,but snorers with
severe OSA (AHI>20) have significantly lower FIF50% than snorers without OSA.
Fig-ure 1 shows the FIF50% for the four groups:
the higher FIF50% was observed in the
con-trol group and the lowest in snorers with severe OSA (AHI>20/h).
The data referring to FIF50% suggest that
snoring patients with or without OSA have in common partial obstruction of the upper airway. When we compare the control group to the group of snoring patients, with or
without OSA, we find a significantly lower FIF50%; when we compare the FIF50% of
snor-ing patients with severe OSA (AHI>2/h) to that of snoring patients without OSA, the differences remain statistically significant. In contrast, when we compare snorers with-out OSA to snorers with mild to moderate OSA (AHI<20/h) the difference is no longer significant. Thus, the flow-volume curve is not useful to identify among snoring patients those having mild to moderate OSA, but the flow-volume curve is useful to identify those having severe OSA. In other words, though the flow-volume curve is not useful for pre-dicting OSA, it is useful to easily demon-strate that the increase of UAR is a factor playing an important role in the severity of OSA.
In conclusion, the present data suggest that a) the FEF50%/FIF50% ratio is not useful
for predicting patients with OSA and b) the FIF50% is decreased in snoring patients and
patients with OSA, suggesting that these patients have increased upper airway resis-tance.
Ackno wle dgm e nts
The authors thank Denise de Sousa Vieira, Noeme Tavares Dias and Antonio Corte Wanderley for excellent technical assistance.
F IF5 0 % ( l/ s ) 8 6 4 2 0 * * *+
Control Snorers AHI<20/h AH>20/h Figure 1 - Forced inspiratory flow
at 50% of vital capacity (FIF50%) in the 4 groups studied. The group of snorers and bot h groups of snorers w ith obstruc-tive sleep apnea (OSA) had a low er FIF50% than the control group. The group of patients w ith severe OSA (AHI>20/h) had a low er FIF50% than the snorers w ithout OSA. Data are reported as median (horizontal bars) and 25-75 percentiles. * P<0.05 vs cont rol; +P< 0.05 vs snorers (ANOVA).
Re fe re nce s
1. Surat t PM , Dee P, At kinson RL, Armstrong P & Wilhoit SC (1983). Fluoro-scopic and computed tomographic fea-tures of the pharyngeal airw ay in obstruc-tive sleep apnea. American Review of
Respiratory Disease, 127: 487-492.
2. Rivlin J, Hof f st ein V, Kalbf leisch J, M cNicholas W, Zamel N & Bryan AC (1984). Upper airw ay morphology in pa-tients w ith idiopathic obstructive sleep apnea. American Review of Respiratory
Disease, 129: 355-360.
3. Brow n IG, Bradley TD, Phillipson EA, Zamel N & Hoffstein V (1985). Pharyngeal compliance in snoring subjects w ith and
w ithout obstructive sleep apnea.
Ameri-can Review of Respiratory Disease, 132:
211-215.
4. Sanders M H, M artin RJ, Pennock BE & Rogers RM (1981). The detection of sleep apnea in the aw ake patient. The “ saw -tooth” sign. Journal of the American
M edical Association, 245: 2414-2418.
5. Hoffstein V, Wright S & Zamel N (1989). Flow -volume curves in snoring patients w ith and w ithout obstructive sleep ap-nea. American Review of Respiratory Dis-ease, 139: 957-960.
6. Rauscher H, Popp W & Zw ick H (1990). Flow -volume curves in obstructive sleep
apnea and snoring. Lung, 168: 209-214. 7. Katz I, Zamel N, Slutsky AS, Rebuck AS &
Hoffstein V (1990). An evaluation of flow -volume curves as a screening test for ob-structive sleep apnea. Chest, 98: 337-340. 8. Tammelin BR, Wilson AF, Borow iecki BB & Sassin JF (1983). Flow -volume curves reflect pharyngeal airw ay abnormalities in sleep apnea syndrome. American Review
of Respiratory Disease, 128: 712-715.
524-528.
10. Haponik EF, Bleecker ER, Allen RP, Smith PL & Kaplan J (1981). Abnormal inspira-tory flow -volume curves in patients w ith sleep-disordered breathing. American
Re-view of Respiratory Disease, 124:
571-574.
11. Rechtschaffen A & Kales A (Editors) (1968). A M anual of Standardized Termi-nology, Techniques and Scoring System
for Sleep Stages of Human Subjects.
UCLA Brain Information Service/Brain Re-search Institute, Los Angeles.
12. Carskadon M A & Rechtschaffen A (1994). M onitoring and staging human sleep. In: Kryger M H, Roth T & Dement WC (Edi-tors), Principles and Practice of Sleep
M edicine. W .B. Saunders Com pany,
Philadelphia.
13. American Thoracic Society (1987). Stan-dardization of spirometry. American
Re-view of Respiratory Disease, 136:
1285-1298.
14. Wasicko M J, Erlichman JS & Leiter JC (1993). Control of segmental upper air-w ay resistance in patients air-w ith obstruc-tive sleep apnea. Journal of Applied
Phys-iology, 74: 2694-2703.
15. Hudgel DW & Hendricks C (1988). Palate and hypopharynx - Sites of inspiratory nar-row ing of the upper airw ay during sleep.
American Review of Respiratory Disease,
138: 1542-1547.
16. Anch AM , Remmers JE & Bunce III H
(1982). Supraglottic airw ay resistance in normal subjects and patients w ith occlu-sive sleep apnea. Journal of Applied Phys-iology: Respiratory, Environmental and
Ex-ercise Physiology, 53: 1158-1163.
17. Haponik EF, Bohlman M , Smith PL, Allen R, Goldman S & Bleecker ER (1982). CT scanning in obstructive sleep apnea: cor-relation of structure w ith airw ay physiolo-gy during sleep and w akefulness.
Ameri-can Review of Respiratory Disease, 125:
107 (Abstract).
18. Wilms D, Popovitch J, Conw ay W, Fujita S & Zorick F (1982). Anatomic abnormali-ties in obstructive sleep apnea. Annals of
Otology, Rhinology, and Laryngology, 91: