ORIGINAL ARTICLE
Floristic composition, structure and soil-vegetation relations
in three white-sand soil patches in central Amazonia
Layon Oreste DEMARCHI1,*, Veridiana Vizoni SCUDELLER2, Livia Carvalho MOURA3, Randolpho Gonçalves DIAS-TERCEIRO1, Aline LOPES1,4, Florian Karl WITTMANN1,5, Maria Teresa Fernandez PIEDADE1
1 Instituto Nacional de Pesquisas da Amazônia - INPA, Av. André Araújo 2936, Aleixo, Manaus, AM, Brasil
2 Universidade Federal do Amazonas – UFAM, Instituto de Ciências Biológicas – ICB, Av. General Rodrigo Otávio Jordão Ramos 3000, Aleixo, Manaus, AM, Brasil 3 Universidade de Brasília – UnB, Departamento de Ecologia, Campus Darcy Ribeiro, Asa Norte, Brasília, DF, Brasil
4 Universidade Nilton Lins, Av. Professor Nilton Lins 3259, Parque das Laranjeiras, Manaus, AM, Brasil 5 Karlsruher Institut für Technologie – KIT, 76131 Karlsruhe, Germany
* Corresponding author: [email protected]
ABSTRACT
The Amazonian white-sand vegetation presents a set of unique features, such as the dominance of a few species, high endemism and low species richness, which differentiate it from other Amazonian forests. Soil parameters have long been recognized as the main drivers of white-sand vegetation (WSV) characteristics. However, how they influence the composition, richness and structure of this vegetation type is still poorly understood. In this study we investigated the variation in floristic composition between patches and the soil-vegetation relations in three central Amazonian WSV patches. We tested whether slight differences in soil properties are linked with differences in floristic composition, species richness and forest structure in adjacent patches. In each patch three plots of 50 x 50 m were sampled (a total of 2.25 ha). Soil samples were collected for each plot. The sampling cutoff for arboreal individuals was DBH ≥ 5 cm. We sampled a total of 3956 individuals belonging to 40 families and 140 species. In each patch only a few species were dominant, but the dominant species varied among patches. Differences among patches were significant, but plots in the same patch tended to have similar species composition. The variable sum of bases (SB) was directly related to species composition, however, species richness and forest structure were not related to soil parameters. Even small variations in soil parameters can change species composition in WSV, although these variations do not necessarily influence the richness and other structural parameters.
KEYWORDS: species richness, oligotrophic ecosystems, dominance, sum of bases
Composição florística, estrutura e relação solo-vegetação em três áreas de
campinarana na Amazônia central
RESUMO
As campinaranas amazônicas apresentam uma série de características únicas, como a dominância de poucas espécies, alto grau de endemismos e baixa riqueza de espécies, que as diferenciam de outras formações florestais amazônicas. Parâmetros edáficos têm sido apontados como os principais responsáveis pelas características das campinaranas. Contudo, como estes parâmetros influenciam a composição, riqueza e estrutura deste tipo de vegetação ainda é pouco entendido. Neste estudo investigamos a variação estrutural, a composição florística e a relação solo-vegetação em três áreas de campinarana na Amazônia central, com intuito de testar se pequenas diferenças nos parâmetros edáficos do solo estão relacionados com diferenças na composição, riqueza e estrutura do componente arbóreo em áreas de campinarana adjacentes. Em cada área foram amostradas três parcelas de 50 x 50 m (totalizando 2.25 ha), com o critério de inclusão para os indivíduos de DAP ≥ 5 cm. Amostras de solo foram coletadas em cada parcela. O número total de indivíduos amostrados foi 3956, pertencendo a 40 famílias e 140 espécies. Em cada área poucas espécies foram dominantes, mas estas variaram entre as áreas. Diferenças entre as áreas foram significativas, porém parcelas da mesma área tenderam a ter composição florística similar. A variável soma de bases (SB) foi diretamente relacionada à composição de espécies; contudo, riqueza de espécies e estrutura florestal não foram relacionadas a nenhum dos parâmetros do solo amostrados. Concluimos que mesmo pequenas variações nos parâmetros edáficos do solo podem mudar a composição de espécies em campinaranas, embora esta variação não necessariamente influencie a riqueza e outros parâmetros estruturais da vegetação.
PALAVRAS-CHAVE: riqueza de espécies, ecossistemas oligotróficos, dominância, soma de bases
INTRODUCTION
The Amazonian region is formed by a mosaic of landscapes with different floristic compositions. Each landscape diversity is related to a variety of habitat characteristics and species preferences (Pitman et al. 2001; Coronado et al. 2009; Junk et al.
2011). It is estimated that Amazonian forests contain between 12,500 and 16,000 tree species (Hubbell et al. 2008; ter Steege
et al. 2013). The formations designated as white-sand vegetation (WSV) or campinarana (Veloso et al. 1991) constitute a peculiar phytophysiognomy in the Amazon region. Soils beneath white-sand vegetation are composed of heavily leached white-white-sand of very low fertility (Heyligers 1963; Anderson 1981; Luizão
et al. 2007; Mendonça et al. 2015); the woody vegetation is scleromorphic and relatively poor in tree species compared to other Amazonian ecosystems (Vicentini 2004; Stropp et al.
2011,), but rich in endemisms (Janzen 1974; Anderson et al.
1975; Anderson 1981; Boubli 2002; Fine et al. 2010; Adeney
et al. 2016; Fine and Baraloto 2016; Guevara et al. 2016). Estimates of white-sand vegetation cover ranged from 64,000 km2 (Braga 1979) to 400,000 km2 (Prance and Daly 1989). However, more accurate mapping techniques with remote sensing suggest that the coverage might be larger, since surveys of the Negro River basin alone (where continuous areas of white-sand vegetation are common) estimated its coverage to be 104.000 km2 (Junk et al. 2011), and the most recent estimate of white-sand vegetation coverage in the Amazon basin is 334,879 km2 (Adeney et al. 2016). In many other Amazonian regions, white-sand vegetation distribution is isolated and island-like, a result of the fragmented nature of the distribution of the sandy soils on which this vegetation type occurs (Prance 1996).
The structure of white-sand vegetation varies from grassland and open areas, dominated by herbaceous plants, to open shrub and dense-canopy forest physiognomies (Veloso
et al. 1991; IBGE 2012). Many white-sand soils have an underlying hardpan, where any increase in precipitation can quickly elevate the groundwater level, subjecting plants to waterlogging or hydric saturation periods (Richardt et al.
1975; Kubitzki 1989a; Franco and Dezzeo 1994). Because of this characteristic, some authors emphasize the comparatively high floristic similarity between white-sand vegetation and Amazonian black-water seasonally-flooded forest (igapó) (Kubitzki 1989a; Kubitzki 1989b; Damasco et al. 2013).
Oligotrophic soils and hydric saturation have been considered the main drivers of white-sand vegetation characteristics (Heyligers 1963; Pires and Prance 1985; Franco and Dezzeo 1994; Tiessen et al. 1994; Sobrado 2009), since they work as strong environmental filters for tree species establishment and distribution (Targhetta et al. 2015; Adeney
et al. 2016). Studies show that white-sand vegetation areas with higher hydric saturation may present lower species richness and smaller individuals (Bongers et al. 1985; Franco and Dezzeo 1994; Targhetta et al. 2015), although under
certain edaphic and topographic conditions hydric saturation may provide less adverse conditions for species establishment, thereby these conditions might have a positive effect on species richness and diversity (Damasco et al. 2013). Though soil properties are directly influenced by hydric saturation, soil texture and fertility have been considered the main factors causing structural and floristic variation of white-sand vegetation (Tiessen et al. 1994; Coomes and Grubb 1996; Coomes 1997; Damasco et al. 2013). However, there are few studies that investigated the role of small differences in soil nutrient concentration within this oligotrophic ecosystem.
To investigate the relationships between soil parameters and the composition and structural characteristics of the woody plant assemblage, three isolated patches of white-sand vegetation surrounded by upland forest (terra-firme) forest were studied to address the following questions: (1) are the patches different in assemblage composition and (2) if so, are such differences linked to soil characteristics?
MATERIAL AND METHODS
Study Area
WSV was studied in three areas within the Tupé Sustainable Development Reserve (SDR Tupé, Figure 1), located on the left margin of the Negro River, approximately 30 km west of the city of Manaus, in the state of Amazonas, Brazil. The SDR Tupé covers an area of 11.973 ha and, together with other protected areas, forms an important mosaic of protected habitats in the central Brazilian Amazon. The average annual rainfall in the region is 2,100 mm, with a well defined rainy season (165-300 mm month-1) from November to May, and a dry season (<65 mm month-1) from July to September. The average temperature is 27 °C, ranging between 18 °C and 37 °C throughout the year, and average relative humidity is around 85% (Radam Brasil 1978). The study area is inserted in the Igarapé Tarumã-mirim basin (a tributary of the Rio Negro). This region is largely covered by WSV areas, which are distributed in patches. The vegetation of the SDR Tupé is predominantly upland forest (terra-firme), with black water river floodplains forest (igapó) dominating the narrow riverine floodplain (Scudeller et al. 2005).
Vegetation sampling
All living woody individuals (except lianas), with diameter at breast height (DBH) ≥ 5 cm were marked with numbered aluminum tags, and had their diameter measured. Tree height was estimated with a hypsometer. Vouchers from all individuals were collected, dried, pressed, and subsequently deposited in the herbarium of the National Institute of Amazon Research (Instituto Nacional de Pesquisas da Amazônia - INPA) and in the herbarium of the Federal Institute of Amazonas (Instituto Federal do Amazonas - IFAM) (EAFM). Species were identified using analytical keys, comparison with herbarium specimens and consulting specialists (see acknowledgements).
Species were classified according to APG IV (2016), and their names were standardized according to the classification of the REFLORA program.
Chemical and physical soil characterization
Soil samples at 0 to 20 cm depth were collected in the four corners and in the center of each sampling plot. The samples were homogenized in the field and joined in one composite sample per plot. The analyses were performed according to the Embrapa soil analysis protocol (Embrapa 1997). Twenty-four variables were analyzed: fine sand (0.2-0.05 mm grain diameter),
coarse sand (2.0-0.2 mm), total sand (2.0-0.05 mm), silt (0.05-0.002 mm) and clay (>(0.05-0.002 mm), C (carbon), OM (organic matter), pH, P, K+, Na+, Ca2+, Mg2+, Al3+, H+AL (potential acidity), SB (sum of bases: Ca²+ +Mg²+ + K+ + Na+), CEC(t) (effective cation exchange capacity), CEC(T) (cation exchange capacity under neutral pH), V (saturation index for bases), m (saturation index for aluminum), Fe, Zn+, Mn2+ and Cu.
Data analysis
The forest structure parameters Relative Density (RDe), Relative Dominance (RDo), Relative Frequency (RFr) and the Importance Value Index (IVI) (Curtis and McIntosh 1951) were calculated using the software Fitopac 2.1.2 (Shepperd 2010). To evaluate the local effect on species composition between the patches, two NMDS axes were generated and a MANOVA was applied to test for statistical difference in species composition among patches. Ranking was based on dissimilarity between samples (in a presence and absence matrix) calculated with the Jaccard Index (Borcard et al. 2011). To evaluate the effect of soil parameters in tree assemblages, we generated a new NMDS axis (k =1), based on dissimilarity between samples (in a presence and absence matrix) calculated with the Jaccard Index. The relationship between environmental variables and species composition was assessed using a Generalized Linear Mixed Model (GLMM). For the model, we used only variables that were not correlated with each other (see Supplementary Material, Table S1), as correlated variables carry the same information and could potentially mask or enhance patterns in additive multiple linear models (Magnusson and Mourão 2005). We used the patches as a random variable. Therefore, our overall multiple regression model was: NMDS = a + b (Mn2+) + b (Silt %) + b (SB) + b (1 | patches).
To evaluate the effect of soil parameters on species richness and vegetation structure variation the GLMM was used separately for each parameter (species richness, relative density, average height and average basal area). Thus we used the same model (mentioned above) replacing the dependent variable for the vegetation structural parameters. To test the effects of soil variables on vegetation without the influence of the sampled patch, we included in the model the variable patches (study areas) as a random variable, so it was possible to control the effect of this variable and verify the real effect of the edaphic variables. All the multivariate analyses were performed using R vegan (R Core Team, 2014; Oksanen et al. 2013).
RESULTS
Vegetation structural variation
A total of 3956 trees belonging to 40 families and 140 species were recorded in the three patches (Table 1). The families with highest species richness were Fabaceae (15 species), Sapotaceae and Lauraceae (14 species each), Burseraceae, Moraceae and Myrtaceae (7 species each) and Sapindaceae (6 species).
The average DBH was 10.4 cm, with a maximum of 94.2 cm. Among the 36 individuals with DBH >45 cm, 33 were
Aldina heterophylla Spruce ex Benth. The average height of individual trees was 7 m, with some emergent individuals, mostly A. heterophylla, reaching 22 m.
The highest similarity (41%) occurred between patches A and B, followed by patches A and C (27%) and B and C (22%). Many species occurred only in one patch (51.4% of all recorded species). Overall, the 10 most abundant species corresponded to 54.2% of recorded individuals. Likewise, the 10 most important species corresponded to 44.3% of the total IVI values. Only Aldina heterophylla was among the 10 most important (IVI) species in all three patches, and only
Aspidosperma aff. verruculosum Müll.Arg., Clusia nemorosa
G.Mey., Simaba guianensis Aubl., Pradosia schomburgkiana
(A.DC.) Cronquist,and Conceveiba terminalis (Baill.) Müll. Arg. were among the 10 most important species in at least two of the sampled patches (Table 2). For 38 species only one individual was recorded, and for 13 species only two individuals. Together, these species corresponded to 36.4% of the total species richness. Phytosociological parameters and herbarium voucher numbers for all recorded species are available as Supplementary Material, Table S2.
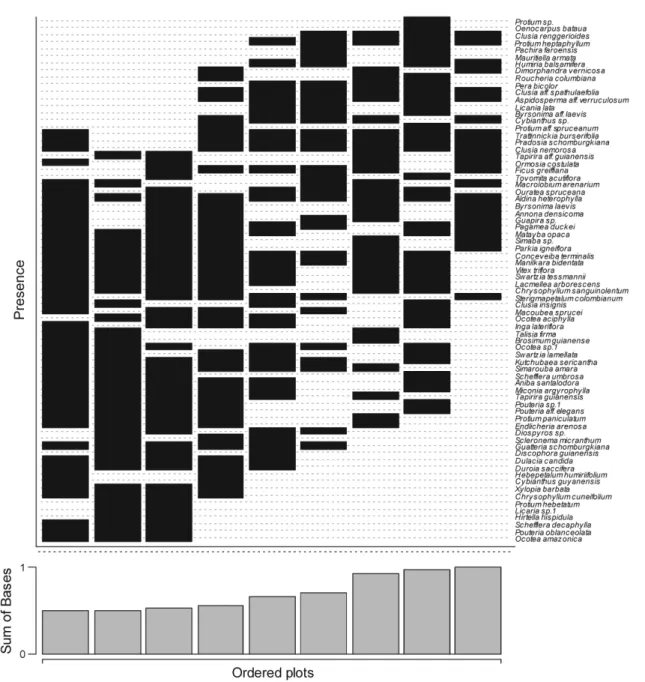
Tree height and basal area differed significantly among sampling plots (ANOVA F = 0.38; P = 0.00; F = 1.92; P = 0.05 respectively) (Figure 2). However, only basal area differed significantly among patches (ANOVA F = 4.45; P = 0.01), due to a significant difference between patches A and C (Tukey test, P = 0.01). Plot ordination along the two NMDS axes captured 92.76% of the variation in species composition. Tree assemblages differed significantly among patches (MANOVA: Pillai trace = 1.5449; F = 10.182; P <0.001) (Figure 3).
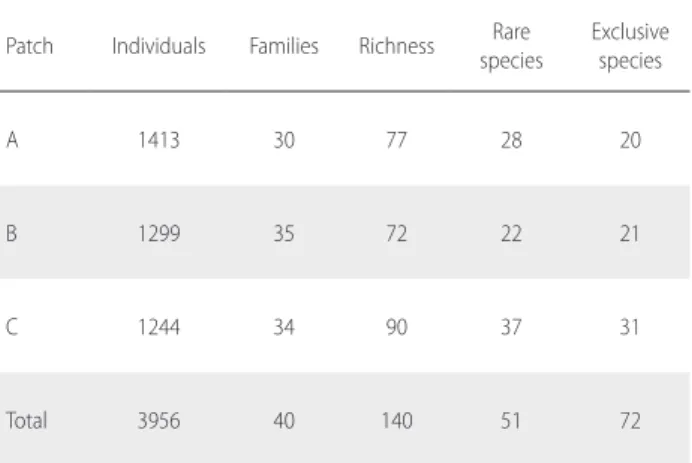
Table 1. Number of individuals, families, richness (total number of species), number of rare species (only one or two recorded individuals) and number of exclusive species (present in only one patch) for nine sampling plots in three white-sand forest patches in Tupé Sustainable Development Reserve (SDR Tupé), Amazonas, Brazil.
Patch Individuals Families Richness Rare species
Exclusive species
A 1413 30 77 28 20
B 1299 35 72 22 21
C 1244 34 90 37 31
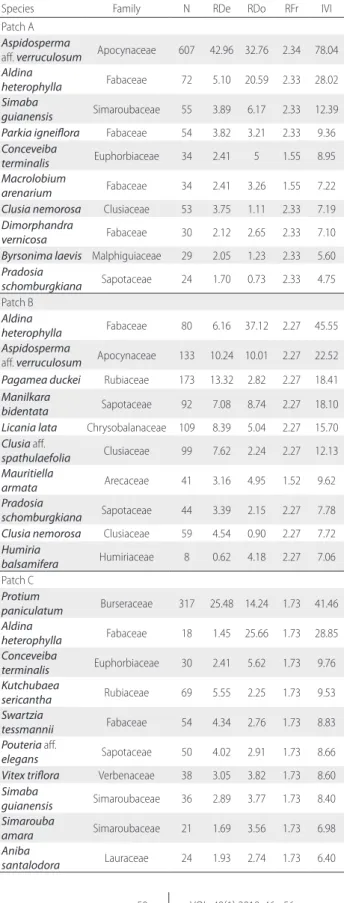
Table 2. Phytosociological parameters for the 10 species with highest IVI per patch of white-sand forest patches in the Tupé Sustainable Development Reserve (SDR Tupé), Amazonas (Brazil). N = number of individuals, RDe = Relative Density, RDo = Relative Dominance, RFr = Relative Frequency, IVI = Importance Value Index. Values of RDe, RDo and RFr are in percentage.
Species Family N RDe RDo RFr IVI
Patch A Aspidosperma
aff. verruculosum Apocynaceae 607 42.96 32.76 2.34 78.04 Aldina
heterophylla Fabaceae 72 5.10 20.59 2.33 28.02 Simaba
guianensis Simaroubaceae 55 3.89 6.17 2.33 12.39 Parkia igneiflora Fabaceae 54 3.82 3.21 2.33 9.36 Conceveiba
terminalis Euphorbiaceae 34 2.41 5 1.55 8.95
Macrolobium
arenarium Fabaceae 34 2.41 3.26 1.55 7.22
Clusia nemorosa Clusiaceae 53 3.75 1.11 2.33 7.19 Dimorphandra
vernicosa Fabaceae 30 2.12 2.65 2.33 7.10
Byrsonima laevis Malphiguiaceae 29 2.05 1.23 2.33 5.60 Pradosia
schomburgkiana Sapotaceae 24 1.70 0.73 2.33 4.75 Patch B
Aldina
heterophylla Fabaceae 80 6.16 37.12 2.27 45.55 Aspidosperma
aff. verruculosum Apocynaceae 133 10.24 10.01 2.27 22.52 Pagamea duckei Rubiaceae 173 13.32 2.82 2.27 18.41 Manilkara
bidentata Sapotaceae 92 7.08 8.74 2.27 18.10
Licania lata Chrysobalanaceae 109 8.39 5.04 2.27 15.70 Clusia aff.
spathulaefolia Clusiaceae 99 7.62 2.24 2.27 12.13 Mauritiella
armata Arecaceae 41 3.16 4.95 1.52 9.62
Pradosia
schomburgkiana Sapotaceae 44 3.39 2.15 2.27 7.78 Clusia nemorosa Clusiaceae 59 4.54 0.90 2.27 7.72 Humiria
balsamifera Humiriaceae 8 0.62 4.18 2.27 7.06 Patch C
Protium
paniculatum Burseraceae 317 25.48 14.24 1.73 41.46 Aldina
heterophylla Fabaceae 18 1.45 25.66 1.73 28.85 Conceveiba
terminalis Euphorbiaceae 30 2.41 5.62 1.73 9.76 Kutchubaea
sericantha Rubiaceae 69 5.55 2.25 1.73 9.53
Swartzia
tessmannii Fabaceae 54 4.34 2.76 1.73 8.83
Pouteria aff.
elegans Sapotaceae 50 4.02 2.91 1.73 8.66
Vitex triflora Verbenaceae 38 3.05 3.82 1.73 8.60 Simaba
guianensis Simaroubaceae 36 2.89 3.77 1.73 8.40 Simarouba
amara Simaroubaceae 21 1.69 3.56 1.73 6.98
Aniba
santalodora Lauraceae 24 1.93 2.74 1.73 6.40
Figure 3. NMDS ordination diagram of the nine sampling plots in three white-sand forest patches in the Tupé Sustainable Development Reserve (SDR Tupé), Amazonas (Brazil) based on species occurrence of trees with DBH ≥ 5 cm.
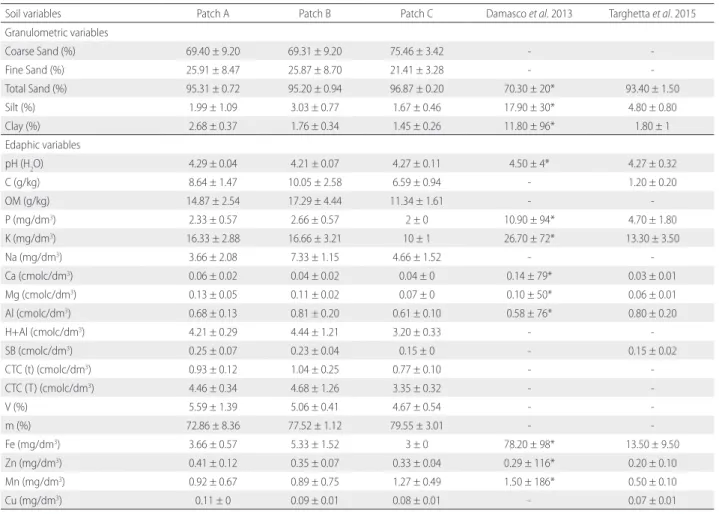
Table 3. Soil parameter values for three white-sand forest patches (A, B and C) in the Tupé Sustainable Development Reserve (SDR Tupé), Amazonas (Brazil) and for other WSV areas in other studies. Values are the mean ± standard deviation [except * = variation coefficient (%)].
Soil variables Patch A Patch B Patch C Damasco et al. 2013 Targhetta et al. 2015 Granulometric variables
Coarse Sand (%) 69.40 ± 9.20 69.31 ± 9.20 75.46 ± 3.42 -
-Fine Sand (%) 25.91 ± 8.47 25.87 ± 8.70 21.41 ± 3.28 -
-Total Sand (%) 95.31 ± 0.72 95.20 ± 0.94 96.87 ± 0.20 70.30 ± 20* 93.40 ± 1.50
Silt (%) 1.99 ± 1.09 3.03 ± 0.77 1.67 ± 0.46 17.90 ± 30* 4.80 ± 0.80
Clay (%) 2.68 ± 0.37 1.76 ± 0.34 1.45 ± 0.26 11.80 ± 96* 1.80 ± 1
Edaphic variables
pH (H2O) 4.29 ± 0.04 4.21 ± 0.07 4.27 ± 0.11 4.50 ± 4* 4.27 ± 0.32
C (g/kg) 8.64 ± 1.47 10.05 ± 2.58 6.59 ± 0.94 - 1.20 ± 0.20
OM (g/kg) 14.87 ± 2.54 17.29 ± 4.44 11.34 ± 1.61 -
-P (mg/dm3) 2.33 ± 0.57 2.66 ± 0.57 2 ± 0 10.90 ± 94* 4.70 ± 1.80
K (mg/dm3) 16.33 ± 2.88 16.66 ± 3.21 10 ± 1 26.70 ± 72* 13.30 ± 3.50
Na (mg/dm3) 3.66 ± 2.08 7.33 ± 1.15 4.66 ± 1.52 -
-Ca (cmolc/dm3) 0.06 ± 0.02 0.04 ± 0.02 0.04 ± 0 0.14 ± 79* 0.03 ± 0.01
Mg (cmolc/dm3) 0.13 ± 0.05 0.11 ± 0.02 0.07 ± 0 0.10 ± 50* 0.06 ± 0.01
Al (cmolc/dm3) 0.68 ± 0.13 0.81 ± 0.20 0.61 ± 0.10 0.58 ± 76* 0.80 ± 0.20
H+Al (cmolc/dm3) 4.21 ± 0.29 4.44 ± 1.21 3.20 ± 0.33 -
-SB (cmolc/dm3) 0.25 ± 0.07 0.23 ± 0.04 0.15 ± 0 - 0.15 ± 0.02
CTC (t) (cmolc/dm3) 0.93 ± 0.12 1.04 ± 0.25 0.77 ± 0.10 -
-CTC (T) (cmolc/dm3) 4.46 ± 0.34 4.68 ± 1.26 3.35 ± 0.32 -
-V (%) 5.59 ± 1.39 5.06 ± 0.41 4.67 ± 0.54 -
-m (%) 72.86 ± 8.36 77.52 ± 1.12 79.55 ± 3.01 -
-Fe (mg/dm3) 3.66 ± 0.57 5.33 ± 1.52 3 ± 0 78.20 ± 98* 13.50 ± 9.50
Zn (mg/dm3) 0.41 ± 0.12 0.35 ± 0.07 0.33 ± 0.04 0.29 ± 116* 0.20 ± 0.10
Mn (mg/dm3) 0.92 ± 0.67 0.89 ± 0.75 1.27 ± 0.49 1.50 ± 186* 0.50 ± 0.10
Cu (mg/dm3) 0.11 ± 0 0.09 ± 0.01 0.08 ± 0.01 - 0.07 ± 0.01
C (organic carbon), OM (organic matter), pH in water (proportion 1:2,5), H+AL (potential acidity), SB (sum of bases), CTC(t) (effective cation exchange capacity), CTC(T) (cation exchange capacity under neutral pH), V (saturation index for bases), m (saturation index for aluminum).
Vegetation variation and soil fertility
The three patches were characterized by sand predominance and nutrient-poor soils (Table 3). The single NMDS axis (k=1) explained 58.8% of the variation in species composition. The GLMM using this NMDS axis as dependent variable and soil parameters as independent variables explained 60.50% of the variation in species composition (NMDS = – 1.165-17 + 1.286-1 QM – 2.489-2 PS – 4.083-1 SB; χ2 = 9.7086; R2 = 0.6050; P = 0.02), yet only the variable sum of bases (SB) contributed significantly to the model (t = – 3.094; P = 0.03) (Table 4). However, there was no significant effect of soil parameters on species richness and structural variation.
Some species were widely distributed along the fertility gradient, while others were restricted to parts of it. Species such as Ocotea amazonica (Meisn.) Mezand Pouteria oblanceolata
Table 4. Effects of edaphic variables on tree species composition in three white-sand forest patches in the Tupé Sustainable Development Reserve (SDR Tupé), Amazonas (Brazil). Estimate = β value of analyzed fixed variables; Std. Error = standard error; t value = t-test value; P value: probability value.
Fixed Effects Estimate Std. Error t value P value
Intercept – 1.165-17 1.059-1 -
-Mn2+ 1.286-1 1.255-1 1.025 0.36
Silt – 2.489-2 1.247-1 – 0.200 0.82
Sum of Bases (SB) – 4.083-1 1.320-1 – 3.094 0.03*
DISCUSSION
Our results show that, although the floristic composition and basal area differed significantly between patches and the height differed significantly among plots, only the variation in species composition was related to soil parameters. This soil effect on species composition may explain why the most important species (IVI) varied among relatively nearby patches.
Fabaceae, followed by Sapotaceae, were the families with the highest species richness, which agrees with previous studies in other WSV areas in the Amazon (Anderson 1981; Coomes and Grubb 1996; Ferreira 2009; Fine et al. 2010; Stropp et al.
2011; Damasco et al. 2013; Targhetta et al. 2015; Guevara et al. 2016). Apocynaceae and Burseraceae are also important, mainly due to the high abundance of Aspidosperma aff.
verruculosum and Protium paniculatum var. modestum Daly, respectively. Lauraceae, Moraceae and Myrtaceae had high richness, but low abundance in the study patches. Common families in other Amazonian forests, such as Lecythidaceae and Myristicaceae (Gentry 1988), were poorly represented in the white-sand forest patches in SDR Tupé.
The greatest height and DBH values achieved by Aldina heterophylla exemplify the important ecological role of this species in WSV, as was also found in other studies (Anderson
et al. 1975; Stropp et al. 2011; Targhetta et al. 2015). The smaller size of the majority of species when compared to other dominant forest formations in Amazonia, such as terra-firme
and seasonal flooded forests, justifies the adoption of the individual inclusion criteria of DBH ≥ 5 cm. If the inclusion criteria commonly used in Amazon forests of DBH ≥ 10 cm had been adopted, 60% of the individuals in our sampling plots, including abundant species such as Pagamea duckei
Standl., would not have been sampled.
Patches had significantly different floristic composition, but plots in the same patch tended to have similar species composition. Previous studies have related differences in floristic composition to factors such as the insular characteristics of WSV (Anderson 1981; Prance 1996), the dispersion capacity limited to anemochory and ornithochory (Macedo and Prance 1978), the effect of fire (Vicentini 2004; Adeney et al. 2016), past anthropogenic actions (Prance and Schubart 1978) and differences in abiotic characteristics among patches (Tiessen et al. 1994; Damasco et al. 2013; Adeney et al. 2016).
The dominance of just a few species, as found in this study, is common in WSV; the sum of the 10 most abundant species often exceeds 50% of all individuals (Boubli 2002; Fine et al.
2010; Stropp et al. 2011). This pattern also occurs in other Amazonian forest formations (Pitman et al. 2001; ter Steege et al. 2013). Only one species was among the 10 most dominant species in all patches, and only three were among the 10 most dominant species in at least two of the sampled patches. This disagrees with Fine et al. (2010) who, on a regional scale, proposed that dominant species in an area of WSV tend also
to be dominant in other nearby WSV areas. However, the reduced spatial scale and the limited number of sampling units in our study preclude any further extrapolations.
Variations in edaphic characteristics change significantly the distribution and abundance of woody species in local environments (Comes and Grubb 1996; Clark et al. 1998; Tuomisto et al. 2003; John et al. 2007), and our results showed that this effect occurs even among nearby white-sand forest patches, and should be investigated in more detail.
The sum of bases SB was the only parameter strongly linked to floristic composition. SB is a good indicator of soil fertility and was closely related to floristic composition in oligotrophic ecosystems (Assis et al. 2011). In other vegetation types on less oligotrophic soils, SB was also the best predictor of species composition (Ruggiero et al. 2002; Zuquim et al.
2014). SB is composed of macronutrients that influence directly the basic processes of plants, such as hydration regulation, stomatal movement and photosynthesis, having an essential role in all stages of plant development (Larcher 2000). The presence and quantity of the elements that compose the SB are directly related to other soil parameters such as soil texture and variation in groundwater level. Although soil texture is not a physiologically important edaphic factor, elements such as silt and clay may increase water-holding and nutrient retention capacity (Mendonça et al. 2015). The
continuous variation in groundwater level, intrinsically related to soil properties, leaches the soil components to lower layers (Franco and Dezzeo 1994). Thus, the interaction between texture and groundwater level is essential to predict soil fertility and species composition (Targhetta et al. 2015).
The variation in SB was significantly related to species composition, but it was not related to species richness nor vegetation structure. In the WSV of Viruá National Park, soil fertility directly influenced the vegetation structure in different phytophysiognomies and may counterbalance the negative effects of flooding (Damasco et al. 2013). In our study soil fertility in white-sand forest patches was less variable than in Viruá NP, but was nevertheless enough to influence floristic composition.
high light penetration, high porosity and low water retention capacity of sandy soils, can subject WSV to physiological constraints during the dry season, when effective drought conditions prevail (Franco and Dezzeo 1994; Vicentini 2004).
Our results highlight the role of edaphic variations in promoting species composition heterogeneity in white-sand forest patches. In this extremely nutrient-poor ecosystem, any nutrient addition may change the habitat partitioning of component species, and therefore may cause changes in species distribution and assemblage composition (Grubb 1977; Oliveira et al. 2014). The differentiation of species composition based on minor resource variations may be an important mechanism for niche differentiation in plant communities.
CONCLUSIONS
We detected significant differences among white-sand forest patches located at about 4 km from each other in an area in the central Brazilian Amazon. Sampling plots within patches tended to have similar species composition. We also found that small differences in soil parameters explained species composition heterogeneity in the white-sand forest patches, reflected in the large number of species (51.4%) that were exclusive to only one patch. Changes in the sum of bases were likely to be linked to species composition variation. Although these changes do not necessarily influence species richness and other structural parameters, they may be related to differential responses of a species abundance, or whether it is present or absent from a white-sand area.
ACKNOWLEDGEMENTS
We thank the Coordenação de Aperfeiçoamento de Pessoal de Nível Superior - CAPES for the first author’s scholarship, Aline Lopes received scholarship from the Programa de Apoio à Fixação de Doutores no Amazonas – FIXAM/AM. We also would like to thank the Fundação de Amparo à Pesquisa do Estado do Amazonas - FAPEAM (public call: 021/2011) and Conselho Nacional de Desenvolvimento Científico e Tecnológico - CNPq/PELD-MAUA (grant number: 403792/2012-6) for financing the research, as well as Instituto Nacional de Pesquisas da Amazônia -INPA and MAUA-INPA technicians for all the support. Special thanks to the SDR Tupé dwellers for the hospitality, Affonso Henrique, Bruno Cintra, Paula Guarido, Álvaro Bastos, Diego Ken, José Ferreira, Marco Volpato and David Marical for helping in the field, Antônio Mello, José Ramos, Mario Terra, Fátima Melo, Alberto Vicentini, André Correa, and Jhennyffer Alves for helping to identify the plants, and Maria Julia Ferreira for editing the figures.
REFERENCES
Adeney, J.M.; Christensen, N.L.; Vicentini, A.; Cohn-Haft, M.
2016. White-sand Ecosystems in Amazonia. Biotropica, 48: 7-23.
Anderson, A.B.; Prance, G.T.; Albuquerque, B.W.P. 1975. Estudos sobre as vegetações de Campinas Amazônica III: a vegetação lenhosa da Campina da Reserva Biológica INPA-SUFRAMA
(Manaus-Caracaraí, km 62). Acta Amazonica, 5: 225-246.
Anderson, A.B. 1981. White-sand vegetation of Brazilian Amazonia.
Biotropica, 13: 199-210.
APG IV. 2016. An update of the Angiosperm Phylogeny Group classification for the orders and families of flowering plants: APG IV. Botanical Journal of the Linnean Society,181: 1-20. Assis, M.A.; Prata, E.M.B.; Pedroni, F.; Sanchez, M.; Eisenlohr,
P.V.; Martins, F.R.; et al. 2011. Florestas de restinga e de terras
baixas na planície costeira do sudeste do Brasil: vegetação e
heterogeneidade ambiental. Biota Neotropica, 11: 103-121.
Borcard, D.; Gillet, F.; Legendre, P. 2011. Numerical Ecology with
R. Springer, New York, 306p.
Boubli, J.P. 2002. Lowland floristic assessment of Pico da Neblina
National Park, Brazil. Plant Ecology, 160: 149-167.
Braga, P.I.S. 1979. Subdivisão fitogeográfica, tipos de vegetação,
conservação e inventário florístico da Floresta Amazônica. Acta
Amazonica, 9: 53-80.
Bongers, F.; Engelen, D.; Klinge, H. 1985. Phytomass structure of natural plant communities on spodosols in southern Venezuela:
the Bana woodland. Vegetatio, 63: 13-34.
Clark, D.B.; Clark, D.A.; Read, J. 1998. Edaphic variation and the mesoscale distribution of tree species in a neotropical rain forest.
Journal of Ecology, 86: 101-112.
Coomes, D.A.; Grubb, P.J. 1996. Amazonian caatinga and related communities at La Esmeralda, Venezuela: forest structure,
physiognomy and floristics, and control by soil factors. Vegetatio,
122: 167-191.
Coomes, D.A. 1997. Nutrient status of Amazonian caatinga forests in a seasonally dry area: nutrient fluxes in litter fall and analyses
of soils. Canadian Journal of Forest Research, 27: 831-839.
Coronado, E.N.H.; Baker, T.R.; Phillips, O.L.; Pitman, N.C.A.;
Pennington, R.T.; Martínez, R.V.; et al. 2009. Multi-scale
comparisons of tree composition in Amazonian Terra Firme
Forests. Biogeosciences, 6: 2719-2731.
Curtis, J.T.; McIntosh, R.P. 1951. An upland forest continuum in the
prairie-forest border region of Wisconsin. Ecology, 32: 476-496.
Damasco, G.; Vicentini, A.; Castilho, C.V.; Pimentel, T.P.; Nascimento, H.E.M. 2013. Disentangling the role of edaphic variability, flooding regime and topography of Amazonian
white-sand vegetation. Journal of Vegetation Science, 24: 384-394.
Embrapa. 1997. Manual de Métodos de Análise de Solos. 2da ed.,
Centro Nacional de Pesquisa de Solos, Rio de Janeiro, 212p.
Ferreira, C.A.C. 2009. Análise comparativa de vegetação lenhosa do
ecossistema campina na Amazônia brasileira. PhD thesis, Instituto Nacional de Pesquisas da Amazônia, Universidade Federal do Amazonas, Manaus, Brazil, 277p.
Fine, L.V.; Miller, Z.J.; Mesones, I.; Irazuzta, S.; Appel, H.M.;
Stevens, M.H.H.; et al. 2006. The growth-defense trade-off and
habitat specialization by plants in Amazonian forests. Ecology,
Fine, P.V.A.; García-Villacorta, R.; Pitman, N.C.A.; Mesones, I.; Kembel, S.W. 2010. A floristic study of the White-sand forests
of Peru. Annals of the Missouri Botanical Garden, 97: 283-305.
Fine, P.V.A.; Baraloto, C. 2016. Habitat Endemism in White-sand Forests: Insights into the Mechanisms of Lineage Diversification
and Community Assembly of the Neotropical Flora. Biotropica,
48: 24-33.
Franco, W.; Dezzeo, N. 1994. Soils and soil-water regime in the terra-firme-caatinga forest complex near San Carlos de Rio
Negro, state of Amazonas, Venezuela. Interciencia, 19: 305-316.
Gentry, A.H. 1988. Changes in plant community diversity and floristic composition on enviromental and geographical
gradients. Annals of the Missouri Botanical Garden, 75: 1-34.
Grubb, P.J. 1977. The Maintenance of Species-richness in Plant Communities: The Importance of the Regeneration Niche.
Biological Reviews, 52: 107-145.
Guevara, J.E.; Damasco, G.; Baraloto, C.; Fine, P.V.A.; Peñuela,
M.C.; Castilho, C. et al. 2016. Low Phylogenetic Beta Diversity
and Geographic Neo-endemism in Amazonian White-sand
Forests. Biotropica, 48: 34-46.
Heyligers, P.C. 1963. Vegetation and soil of a White-Sand Savanna in
Suriname. Mededelingen van het Botanisch Museum en Herbarium
van de Rijksuniversiteit te Utrecht, 191: 1-148.
Hubbell, S.P.; He, F.; Condit, R.; Borda-de-Água, L.; Kellner, J.; ter Steege, H. 2008. How many tree species are there in the Amazon
and how many of them will go extinct? Proceedings of the National
Academy of Sciences, 105: 11498-11504.
IBGE. 2012. Manual Técnico da Vegetação brasileira. 2da ed., Instituto
Brasileiro de Geografia e Estatística, Rio de Janeiro, 275p. Janzen, D. 1974. Tropical blackwater rivers, animals and mast fruiting
by Dipterocarpaceae. Biotropica, 6: 69-103.
John, R.; Dalling, J.W.; Harms, K.E.; Yavitt, J.B.; Stallard, R.F.;
Mirabello, M.; et al. 2007. Soil nutrients influence spatial
distributions of tropical tree species. Proceedings of the National
Academy of Sciences, 104: 864-869.
Junk, W.J.; Piedade, M.T.F.; Schöngart, J.; Cohn-Haft, M.; Adeney, J.M.; Wittmann, F. 2011. A classification of major
naturally-occurring Amazonian lowland wetlands. Wetlands, 31: 623:640.
Kubitzki, K. 1989a. The ecogeographical differentiation of Amazon
inundation forests. Plant Systematics and Evolution, 162: 285-304.
Kubitzki, K. 1989b. Amazon lowland and Guayana highland – historical and ecological aspects of the development of their
floras. Amazoniana, 11: 1-12.
Larcher, W. 2000. Ecofisiologia vegetal. RiMa Artes e Textos, São
Carlos, 531p.
Luizão, F.J.; Luizão, R.C.C.; Proctor, J. 2007. Soil acidity and
nutrient deficiency in central Amazonian heath forest soils. Plant
Ecology, 192: 209-224.
Macedo, M.; Prance, G.T. 1978. Notes on the vegetation of Amazonia II. The dispersal of plants in Amazonian white sand campinas: The
campinas as functional islands. Brittonia, 30: 203-215.
Magnusson, W.E; Mourão, G. 2005. Estatística sem Matemática. 2da
ed., Publisher Planta, Londrina, 138p.
Mendonça, B.A.F.; Filho, E.I.F.; Schaefer, C.E.G.R.; Simas, F.N.B.; Paula, M.D. 2015. Os solos das Campinaranas na Amazônia
Brasileira: Ecossistemas arenícolas oligotróficos. Ciência Florestal,
25: 827-839.
Oksanen, J.F.; Blanchet, G.; Kindt, R.; Legendre, P.; Minchin,
P.R.; O’Hara, R.B.; et al. 2013. vegan: Community Ecology
Package, R package version 2.0-7. (http://CRAN.R-project.org/ package=vegan).
Oliveira, A.A.; Vicentini, A.; Chave, J.; Castanho, C.T.; Davies,
S.J.; Martini, A.M.Z. et al. 2014. Habitat specialization and
phylogenetic structure of tree species in a coastal Brazilian
white-sand forest. Journal of Plant Ecology, 7:134–144.
Parolin, P.; Wittmann, F. 2010. Struggle in the flood: tree responses
to flooding stress in four tropical floodplain systems. AoB Plants,
v2010: plq003.
Piedade, M.T.F.; Schöngart, J.; Wittmann, F.; Parolin, P.; Junk, W.J. 2013. Impactos da inundação e seca na vegetação de áreas alagáveis amazônicas. In: Borma, L.S.; Nobre, C.A. (Org.).
Secas na Amazônia: causas e consequências. São Paulo, Oficina de Textos, p.268-305.
Pires, J.M.; Prance, G.T. 1985. The vegetation types of the Brazilian
Amazon. In: Prance, G.T.; Lovejoy, T.E. (Ed.). Key Enviroments:
Amazonia. Oxford, Pergamon Press, p.109-145.
Pitman, N.C.A.; Terborgh, J.W.; Silman, M.R.; Núñez, P.V.; Neill,
D.A.; Cerón, C.E.; et al. 2001. Dominance and distribution of
tree species in upper Amazonian Terra Firme forests. Ecology,
82: 2101-2117.
Prance, G.T.; Schubart, H.O.R. 1978. Nota preliminar sobre a
origem das campinas abertas de areia branca do rio Negro. Acta
Amazonica, 3: 567-570.
Prance, G.T.; Daly, D. 1989. Brasilian Amazon. In: Campbell, D.G.;
Hammond, H.D. (Ed.). Floristic inventory of tropical countries.
New York Botanical Garden, New York, p.523-533.
Prance, G.T. 1996. Islands in Amazonia. Philosophical Transactions
of the Royal Society of London. Series B, 351: 823-833.
R Core Team. 2014. R: A language and environment for statistical computing. R Foundation for Statistical Computing, Vienna, Austria. (http://www.R-project.org/).
Radam Brasil. 1978. Levantamento de recursos naturais. v.18. Folha
SA. 20 Manaus, Departamento Nacional de Produção Mineral, Rio de Janeiro, 747p.
Reflora - Flora do Brasil 2020 em construção. Jardim Botânico do Rio de Janeiro. (http://floradobrasil.jbrj.gov.br/). Accessed on 22/05/2017.
Richardt, K.; Santos, A.; Nascimento-Filho, V.; Bacc, O.O.S. 1975. Movimento de água subterrânea em ecossistema Campina
Amazônica. Acta Amazonica, 6: 229-290.
Ruggiero, P.G.C.; Batalha, M.A.; Pivello, V.R.; Meirelles, S.T. 2002. Soil-vegetation relationships in cerrado (Brazilian savanna) and
semideciduous forest, Southeastern Brazil. Plant Ecology, 160: 1-16.
Scudeller, V.V.; Aprile, F.M.; Melo, S.; Santos-Silva, E.N. 2005. Reserva de Desenvolvimento Sustentável do Tupé: características gerais. In: Santos-Silva, E.N.; Aprile, F.M.; Scudeller, V.V.; Melo,
do Baixo Rio Negro, Amazônia Central. Instituto Nacional de Pesquisas da Amazônia, Manaus, p. XI-XXI.
Shepherd, G.J. 2010. Fitopac - Manual do usuário. Departamento
de Botânica, Universidade Estadual de Campinas, Campinas, Brazil, 91p.
Sobrado, M.A. 2009. Leaf tissue water relations and hydraulic properties of sclerophyllous vegetation on white sands of the
upper Rio Negro in the Amazon region. Journal of Tropical
Ecology, 25: 271-280.
Stropp, J.; Van Der Sleen, P.; Assunção, P.A.; Silva, A.L.; ter Steege, H. 2011. Tree communities of white-sand and terra-firme forests
of the upper Rio Negro. Acta Amazonica, 41: 521-544.
Targhetta, N.; Kesselmeier, J.; Wittmann, F. 2015. Effects of the hydroedaphic gradient on tree species composition and aboveground wood biomass of oligotrophic forest ecosystems
in the central Amazon basin. Folia Geobotanica, 50: 185-205.
ter Steege, H.; Pitman, N.C.A.; Sabatier, D.; Baraloto, C.; Salomão,
R.P.; Guevara, J.E.; et al. 2013. Hyperdominance in the
Amazonian Tree Flora. Science, 342: 325-336.
Tiessen, H.; Chacon, P.; Cuevas, E. 1994. Phosphorus and nitrogen status in soils and vegetation along a toposequence of dystrophic
rainforests on the upper Rio Negro. Oecologia, 99: 145-150.
Tuomisto, H.; Ruokolainem, K.; Aguilar, M.; Sarmiento, A. 2003. Floristic patterns along a 43-km long transect in an Amazonian
rain forest. Journal of Ecology, 91: 743-756.
Veloso, H.P.; Rangel Filho, A.L.R.; Lima, J.C.A. 1991. Classificação
da vegetação brasileira, adaptada a um sistema universal. Instituto Brasileiro de Geografia e Estatística, Rio de Janeiro, 124p. Vicentini, A. 2004. A vegetação ao longo de um gradiente edáfico no
Parque Nacional do Jaú. In: Borges, S.H.; Iwanaga, S.; Durigan,
C.C.; Pinheiro, M.R. (Ed.). Janelas para a biodiversidade
no Parque Nacional do Jaú: uma estratégia para o estudo da
biodiversidade na Amazônia. Fundação Vitória Amazônica,
WWF, IBAMA, Manaus, p.117-143.
Zuquim, G.; Tuomisto, H.; Jones, M.M.; Prado, J.; Figueiredo,
F.O.G.; Moulatlet, G.M.; et al. 2014. Predicting environmental
gradients with fern species composition in Brazilian Amazonia.
Journal of Vegetation Science, 25: 1195-1207.
RECEIVED: 30/12/2016
ACCEPTED: 04/09/2017
ASSOCIATE EDITOR: Natália Ivanauskas
SUPPLEMENTARY MATERIAL
(only available in the electronic version)
DEMARCHI et al. Floristic composition, structure and soil-vegetation relations in three white-sand soil patches in central Amazonia.
Table S1. Correlation matrix of soil parameters collected in three white-sand vegetation patches in Tupé Sustainable Development Reserve, in the central Brazilian Amazon. (This table is available in electronic edition only).
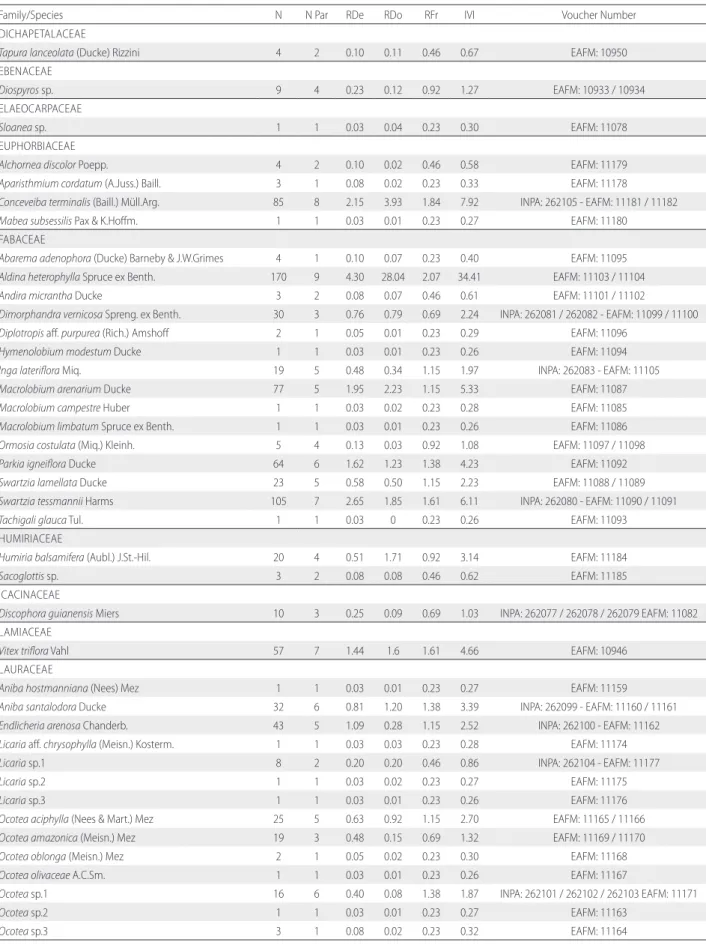
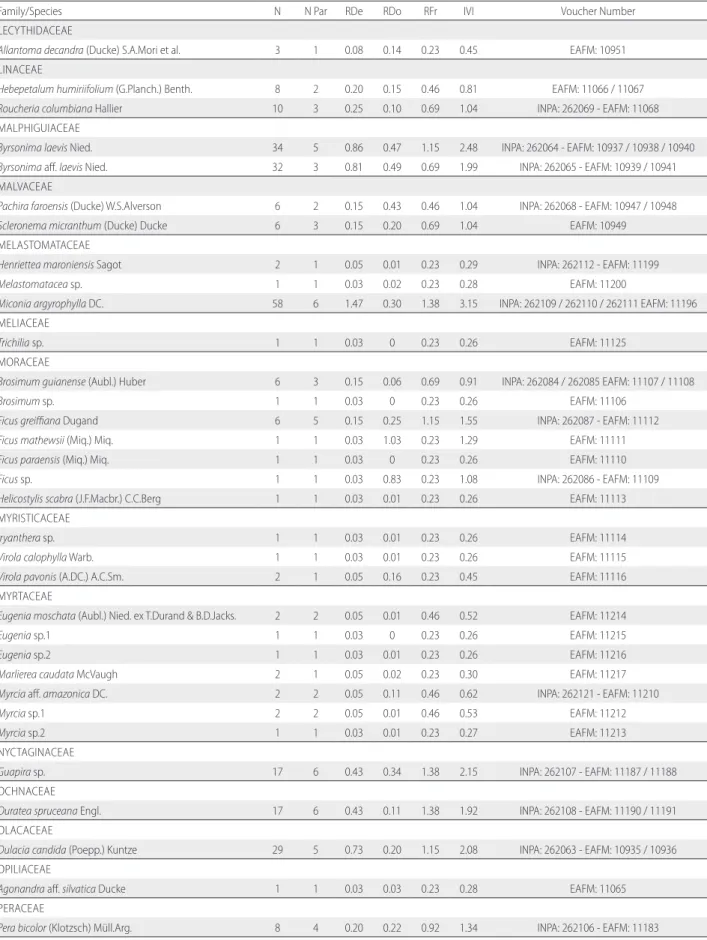
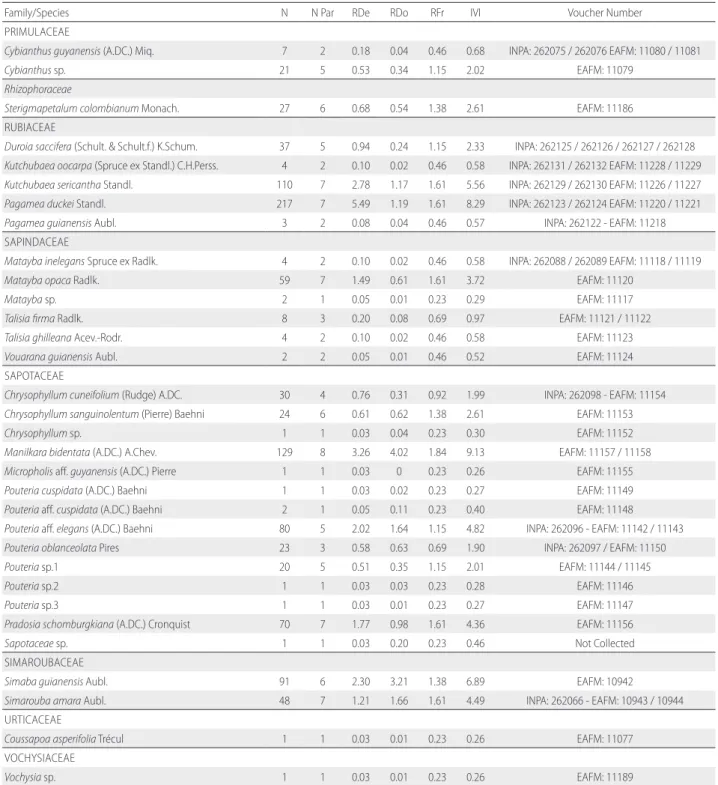
Table S2. Phytosociological parameters of species found in the three areas of white-sand vegetation sampled in Tupé Sustainable Development Reserve, central Brazilian Amazon. N. = number of individuals, N Par = number of parcels in wich species occurred, RDe = Relative Density, RDo = Relative Dominance, RFr = Relative Frequency, IVI = Importance Value Index. Voucher number refers to material deposited in the herbaria of Instituto Nacional de Pesquisas da Amazônia (INPA) and Instituto Federal do Amazonas (EAFM). (This table is available in electronic edition only).
V
O
L. 48
(1
) 2018: 46
- 56
h
ttp://dx.doi.or
g/10.1590/1809-4392201603523
TICLE
Z
O
N
IC
A
AR
Y
M
A
TERIAL
(only a
v
ailable in the elec
tr
onic v
ersion)
CHI
et al.
Floristic composition, str
uctur
e and soil-v
egetation r
elations in thr
ee white-sand soil patches in
onia.
co.sand ** * ** NS NS NS NS NS NS NS NS NS NS NS NS NS NS NS NS NS NS NS NS
fi.sand -0.99 * ** NS NS NS NS NS NS NS NS NS NS NS NS NS NS NS NS NS NS NS NS
to.sand 0.74 -0.66 ** NS NS NS NS NS ** NS NS NS NS NS * NS NS NS NS NS NS NS NS
silt -0.81 0.77 -0.80 NS NS NS NS NS NS NS NS NS NS NS NS NS NS NS NS NS NS NS NS
clay 0.03 -0.09 -0.42 -0.22 NS NS NS NS NS NS NS NS NS NS NS NS NS NS NS NS NS NS **
pH -0.24 0.28 0.10 -0.22 0.17 NS NS NS NS NS NS NS NS NS NS NS NS NS NS NS NS NS NS
C -0.01 -0.08 -0.63 0.36 0.46 -0.33 ** NS ** NS NS * ** ** * ** ** NS NS ** NS NS NS
OM -0.01 -0.08 -0.62 0.36 0.47 -0.32 1.00 NS ** NS NS * ** ** * ** ** NS NS ** NS NS NS
P -0.19 0.14 -0.46 0.49 0.00 -0.49 0.36 0.35 NS NS NS NS NS NS NS NS NS NS NS NS NS NS NS
K+ -0.46 0.38 -0.87 0.57 0.54 -0.09 0.84 0.84 0.44 NS * ** NS * ** * * NS NS * NS NS NS
Na+ -0.01 -0.01 -0.16 0.42 -0.37 -0.43 0.16 0.16 0.38 -0.05 NS NS NS NS NS NS NS NS NS NS NS NS NS
Ca2+ -0.06 -0.01 -0.46 0.07 0.64 0.14 0.63 0.63 0.28 0.72 -0.45 ** NS * ** NS * NS * NS NS NS NS
Mg2+ -0.18 0.12 -0.56 0.23 0.56 0.08 0.68 0.68 0.49 0.85 -0.29 0.90 NS * ** NS * * * NS NS NS NS
Al3+ 0.36 -0.45 -0.31 0.09 0.36 -0.61 0.84 0.84 0.28 0.46 0.40 0.30 0.28 ** NS ** ** NS NS ** NS NS NS
H+Al 0.12 -0.22 -0.58 0.24 0.57 -0.44 0.92 0.92 0.54 0.74 0.21 0.67 0.68 0.87 * ** ** NS NS ** NS NS NS
SB -0.22 0.14 -0.67 0.34 0.57 -0.01 0.77 0.77 0.54 0.90 -0.16 0.89 0.98 0.40 0.77 * ** * * NS NS NS *
CTC(t) 0.23 -0.33 -0.47 0.19 0.48 -0.51 0.94 0.94 0.40 0.67 0.28 0.54 0.55 0.96 0.97 0.65 ** NS NS ** NS NS NS
CTC(T) 0.09 -0.19 -0.59 0.25 0.58 -0.42 0.92 0.92 0.55 0.77 0.19 0.69 0.71 0.85 1.00 0.80 0.96 NS NS ** NS NS NS
V -0.51 0.50 -0.42 0.31 0.21 0.50 0.18 0.18 0.24 0.58 -0.44 0.65 0.77 -0.35 0.08 0.70 -0.07 0.13 ** NS NS NS NS
m 0.54 -0.53 0.48 -0.32 -0.29 -0.43 -0.14 -0.14 -0.38 -0.57 0.44 -0.68 -0.77 0.36 -0.13 -0.71 0.07 -0.18 -0.96 NS NS NS NS
Fe -0.04 -0.05 -0.60 0.49 0.23 -0.39 0.89 0.89 0.38 0.65 0.57 0.31 0.38 0.86 0.82 0.52 0.88 0.81 -0.07 0.11 NS NS NS
Zn 0.40 -0.44 0.03 -0.37 0.51 -0.35 0.06 0.06 0.00 -0.10 0.23 -0.07 -0.14 0.43 0.33 -0.07 0.34 0.30 -0.52 0.42 0.12 NS NS
Mn2+ 0.35 -0.35 0.19 -0.14 -0.10 0.14 0.18 0.19 0.13 0.02 -0.09 0.54 0.36 0.09 0.23 0.35 0.18 0.25 0.32 -0.29 0.11 -0.25 NS
Cu -0.14 0.08 -0.49 -0.03 0.83 0.27 0.32 0.32 0.33 0.51 -0.14 0.65 0.63 0.16 0.52 0.65 0.34 0.54 0.41 -0.54 0.19 0.41 0.11
Table S2. Phytosociological parameters of species found in the three areas of white-sand vegetation sampled in Tupé Sustainable Development Reserve, central Brazilian Amazon. N. = number of individuals, N Par = number of parcels in wich species occurred, RDe = Relative Density, RDo = Relative Dominance, RFr = Relative Frequency, IVI = Importance Value Index. Voucher number refers to material deposited in the herbaria of Instituto Nacional de Pesquisas da Amazônia (INPA) and Instituto Federal do Amazonas (EAFM).
Family/Species N N Par RDe RDo RFr IVI Voucher Number
ANACARDIACEAE
Spondias sp. 3 2 0.08 0.06 0.46 0.60 EAFM: 11194 / 11195
Tapirira guianensis Aubl. 24 6 0.61 1.19 1.38 3.18 EAFM: 11192
Tapirira aff. guianensis Aubl. 12 4 0.30 0.16 0.92 1.39 EAFM: 11193 ANNONACEAE
Annonadensicoma Mart. 22 5 0.56 0.18 1.15 1.89 INPA: 262118 / 262119 / 262120 EAFM: 11207
Guatteriaschomburgkiana Mart. 28 6 0.71 0.53 1.38 2.62 INPA: 262116 / 262117 EAFM: 11205 / 11206
Xylopiabarbata Hoffmanns. ex Mart. 14 5 0.35 0.26 1.15 1.77 EAFM: 11204 APOCYNACEAE
Aspidospermaexcelsum Benth. 1 1 0.03 0.23 0.23 0.49 Not Collected
Aspidosperma aff. verruculosum Müll.Arg. 740 6 18.71 13.12 1.38 33.21 EAFM: 11073
Lacmelleaarborescens (Müll.Arg.) Markgr. 32 7 0.81 0.50 1.61 2.92 INPA: 262072 / 262073 / 262074 EAFM: 11074
Macoubea sprucei (Müll.Arg.) Markgr. 28 5 0.71 0.24 1.15 2.10 INPA: 262070 / 262071 EAFM: 11069 / 11070
Malouetia cf. flavescens (Willd. ex Roem. & Schult.) Müll.Arg. 1 1 0.03 0 0.23 0.26 EAFM: 11072 ARALIACEAE
Scheffleradecaphylla (Seem.) Harms 20 3 0.51 0.39 0.69 1.59 INPA: 262113 / 262114 EAFM: 11201 / 11202
Scheffleraumbrosa Frodin & Fiaschi 6 4 0.15 0.06 0.92 1.14 INPA: 262115 – EAFM: 11203 ARECACEAE
Leopoldiniapulchra Mart. 2 1 0.05 0.02 0.23 0.30 Not Collected
Mauritiellaarmata (Mart.) Burret 41 2 1.04 1.67 0.46 3.17 Not Collected
Oenocarpusbataua Martius. 5 1 0.13 0.23 0.23 0.59 Not Collected BURSERACEAE
Protiumhebetatum Daly 5 2 0.13 0.07 0.46 0.66 EAFM: 11141
Protiumheptaphyllum (Aubl.) Marchand 50 5 1.26 0.24 1.15 2.66 INPA: 262094 / 262095 EAFM: 11139 / 11139
Protiumpaniculatum var. modestum Daly 336 5 8.49 5.63 1.15 15.27 INPA: 262091 / 262092 EAFM: 11135 / 11136
Protium aff. spruceanum (Benth.) Engl. 8 2 0.20 0.09 0.46 0.75 INPA: 262093 - EAFM: 11137
Protium sp. 6 1 0.15 0.05 0.23 0.44 EAFM: 11140
Trattinnickiaburserifolia Mart. 16 7 0.40 0.25 1.61 2.27 INPA: 262090 - EAFM: 11133 / 11134
Trattinnickia sp. 1 1 0.03 0 0.23 0.26 EAFM:11132 CHRYSOBALANACEAE
Hirtellahispidula Miq. 8 2 0.20 0.25 0.46 0.91 EAFM: 11131
Licaniagracilipes Taub. 1 1 0.03 0.05 0.23 0.31 EAFM: 11130
Licanialata J.F.Macbr. 109 3 2.76 1.70 0.69 5.15 EAFM: 11128 / 11129
Licania sp.1 4 2 0.10 0.16 0.46 0.72 EAFM: 11126
Licania sp.2 1 1 0.03 0 0.23 0.26 EAFM: 11127 CLUSIACEAE
Clusiainsignis Mart. 7 4 0.18 0.29 0.92 1.39 EAFM: 10926
Clusianemorosa G.Mey. 116 7 2.93 0.66 1.61 5.20 INPA: 262057 / 262058 - EAFM: 10927 / 10928
Clusiarenggerioides Planch. & Triana 8 4 0.20 0.26 0.92 1.38 INPA: 262056 - EAFM: 10924 / 10925
Clusia aff. spathulaefolia Engl. 116 6 2.93 0.86 1.38 5.17 INPA: 262059 - EAFM: 10929
Tovomitaacutiflora M.S. de Barros & G. Mariz 21 3 0.53 0.16 0.69 1.38 INPA: 262060 / 262061 / 262062 EAFM: 10930 COMBRETACEAE
Buchenaviamacrophylla Eichler 4 4 0.10 0.15 0.92 1.17 EAFM: 10952
Family/Species N N Par RDe RDo RFr IVI Voucher Number DICHAPETALACEAE
Tapuralanceolata (Ducke) Rizzini 4 2 0.10 0.11 0.46 0.67 EAFM: 10950 EBENACEAE
Diospyros sp. 9 4 0.23 0.12 0.92 1.27 EAFM: 10933 / 10934 ELAEOCARPACEAE
Sloanea sp. 1 1 0.03 0.04 0.23 0.30 EAFM: 11078 EUPHORBIACEAE
Alchorneadiscolor Poepp. 4 2 0.10 0.02 0.46 0.58 EAFM: 11179
Aparisthmiumcordatum (A.Juss.) Baill. 3 1 0.08 0.02 0.23 0.33 EAFM: 11178
Conceveibaterminalis (Baill.) Müll.Arg. 85 8 2.15 3.93 1.84 7.92 INPA: 262105 - EAFM: 11181 / 11182
Mabeasubsessilis Pax & K.Hoffm. 1 1 0.03 0.01 0.23 0.27 EAFM: 11180 FABACEAE
Abaremaadenophora (Ducke) Barneby & J.W.Grimes 4 1 0.10 0.07 0.23 0.40 EAFM: 11095
Aldinaheterophylla Spruce ex Benth. 170 9 4.30 28.04 2.07 34.41 EAFM: 11103 / 11104
Andiramicrantha Ducke 3 2 0.08 0.07 0.46 0.61 EAFM: 11101 / 11102
Dimorphandravernicosa Spreng. ex Benth. 30 3 0.76 0.79 0.69 2.24 INPA: 262081 / 262082 - EAFM: 11099 / 11100
Diplotropis aff. purpurea (Rich.) Amshoff 2 1 0.05 0.01 0.23 0.29 EAFM: 11096
Hymenolobiummodestum Ducke 1 1 0.03 0.01 0.23 0.26 EAFM: 11094
Ingalateriflora Miq. 19 5 0.48 0.34 1.15 1.97 INPA: 262083 - EAFM: 11105
Macrolobiumarenarium Ducke 77 5 1.95 2.23 1.15 5.33 EAFM: 11087
Macrolobiumcampestre Huber 1 1 0.03 0.02 0.23 0.28 EAFM: 11085
Macrolobiumlimbatum Spruce ex Benth. 1 1 0.03 0.01 0.23 0.26 EAFM: 11086
Ormosiacostulata (Miq.) Kleinh. 5 4 0.13 0.03 0.92 1.08 EAFM: 11097 / 11098
Parkiaigneiflora Ducke 64 6 1.62 1.23 1.38 4.23 EAFM: 11092
Swartzialamellata Ducke 23 5 0.58 0.50 1.15 2.23 EAFM: 11088 / 11089
Swartziatessmannii Harms 105 7 2.65 1.85 1.61 6.11 INPA: 262080 - EAFM: 11090 / 11091
Tachigaliglauca Tul. 1 1 0.03 0 0.23 0.26 EAFM: 11093 HUMIRIACEAE
Humiriabalsamifera (Aubl.) J.St.-Hil. 20 4 0.51 1.71 0.92 3.14 EAFM: 11184
Sacoglottis sp. 3 2 0.08 0.08 0.46 0.62 EAFM: 11185 ICACINACEAE
Discophoraguianensis Miers 10 3 0.25 0.09 0.69 1.03 INPA: 262077 / 262078 / 262079 EAFM: 11082 LAMIACEAE
Vitextriflora Vahl 57 7 1.44 1.6 1.61 4.66 EAFM: 10946 LAURACEAE
Anibahostmanniana (Nees) Mez 1 1 0.03 0.01 0.23 0.27 EAFM: 11159
Anibasantalodora Ducke 32 6 0.81 1.20 1.38 3.39 INPA: 262099 - EAFM: 11160 / 11161
Endlicheriaarenosa Chanderb. 43 5 1.09 0.28 1.15 2.52 INPA: 262100 - EAFM: 11162
Licaria aff. chrysophylla (Meisn.) Kosterm. 1 1 0.03 0.03 0.23 0.28 EAFM: 11174
Licaria sp.1 8 2 0.20 0.20 0.46 0.86 INPA: 262104 - EAFM: 11177
Licaria sp.2 1 1 0.03 0.02 0.23 0.27 EAFM: 11175
Licaria sp.3 1 1 0.03 0.01 0.23 0.26 EAFM: 11176
Ocoteaaciphylla (Nees & Mart.) Mez 25 5 0.63 0.92 1.15 2.70 EAFM: 11165 / 11166
Ocoteaamazonica (Meisn.) Mez 19 3 0.48 0.15 0.69 1.32 EAFM: 11169 / 11170
Ocoteaoblonga (Meisn.) Mez 2 1 0.05 0.02 0.23 0.30 EAFM: 11168
Ocoteaolivaceae A.C.Sm. 1 1 0.03 0.01 0.23 0.26 EAFM: 11167
Ocotea sp.1 16 6 0.40 0.08 1.38 1.87 INPA: 262101 / 262102 / 262103 EAFM: 11171
Ocotea sp.2 1 1 0.03 0.01 0.23 0.27 EAFM: 11163
Ocotea sp.3 3 1 0.08 0.02 0.23 0.32 EAFM: 11164
Family/Species N N Par RDe RDo RFr IVI Voucher Number LECYTHIDACEAE
Allantomadecandra (Ducke) S.A.Mori et al. 3 1 0.08 0.14 0.23 0.45 EAFM: 10951 LINACEAE
Hebepetalumhumiriifolium (G.Planch.) Benth. 8 2 0.20 0.15 0.46 0.81 EAFM: 11066 / 11067
Roucheriacolumbiana Hallier 10 3 0.25 0.10 0.69 1.04 INPA: 262069 - EAFM: 11068 MALPHIGUIACEAE
Byrsonimalaevis Nied. 34 5 0.86 0.47 1.15 2.48 INPA: 262064 - EAFM: 10937 / 10938 / 10940
Byrsonima aff. laevis Nied. 32 3 0.81 0.49 0.69 1.99 INPA: 262065 - EAFM: 10939 / 10941 MALVACEAE
Pachirafaroensis (Ducke) W.S.Alverson 6 2 0.15 0.43 0.46 1.04 INPA: 262068 - EAFM: 10947 / 10948
Scleronemamicranthum (Ducke) Ducke 6 3 0.15 0.20 0.69 1.04 EAFM: 10949 MELASTOMATACEAE
Henrietteamaroniensis Sagot 2 1 0.05 0.01 0.23 0.29 INPA: 262112 - EAFM: 11199
Melastomatacea sp. 1 1 0.03 0.02 0.23 0.28 EAFM: 11200
Miconiaargyrophylla DC. 58 6 1.47 0.30 1.38 3.15 INPA: 262109 / 262110 / 262111 EAFM: 11196 MELIACEAE
Trichilia sp. 1 1 0.03 0 0.23 0.26 EAFM: 11125 MORACEAE
Brosimumguianense (Aubl.) Huber 6 3 0.15 0.06 0.69 0.91 INPA: 262084 / 262085 EAFM: 11107 / 11108
Brosimum sp. 1 1 0.03 0 0.23 0.26 EAFM: 11106
Ficusgreiffiana Dugand 6 5 0.15 0.25 1.15 1.55 INPA: 262087 - EAFM: 11112
Ficusmathewsii (Miq.) Miq. 1 1 0.03 1.03 0.23 1.29 EAFM: 11111
Ficusparaensis (Miq.) Miq. 1 1 0.03 0 0.23 0.26 EAFM: 11110
Ficus sp. 1 1 0.03 0.83 0.23 1.08 INPA: 262086 - EAFM: 11109
Helicostylisscabra (J.F.Macbr.) C.C.Berg 1 1 0.03 0.01 0.23 0.26 EAFM: 11113 MYRISTICACEAE
Iryanthera sp. 1 1 0.03 0.01 0.23 0.26 EAFM: 11114
Virolacalophylla Warb. 1 1 0.03 0.01 0.23 0.26 EAFM: 11115
Virolapavonis (A.DC.) A.C.Sm. 2 1 0.05 0.16 0.23 0.45 EAFM: 11116 MYRTACEAE
Eugeniamoschata (Aubl.) Nied. ex T.Durand & B.D.Jacks. 2 2 0.05 0.01 0.46 0.52 EAFM: 11214
Eugenia sp.1 1 1 0.03 0 0.23 0.26 EAFM: 11215
Eugenia sp.2 1 1 0.03 0.01 0.23 0.26 EAFM: 11216
Marliereacaudata McVaugh 2 1 0.05 0.02 0.23 0.30 EAFM: 11217
Myrcia aff. amazonica DC. 2 2 0.05 0.11 0.46 0.62 INPA: 262121 - EAFM: 11210
Myrcia sp.1 2 2 0.05 0.01 0.46 0.53 EAFM: 11212
Myrcia sp.2 1 1 0.03 0.01 0.23 0.27 EAFM: 11213 NYCTAGINACEAE
Guapira sp. 17 6 0.43 0.34 1.38 2.15 INPA: 262107 - EAFM: 11187 / 11188 OCHNACEAE
Ourateaspruceana Engl. 17 6 0.43 0.11 1.38 1.92 INPA: 262108 - EAFM: 11190 / 11191 OLACACEAE
Dulaciacandida (Poepp.) Kuntze 29 5 0.73 0.20 1.15 2.08 INPA: 262063 - EAFM: 10935 / 10936 OPILIACEAE
Agonandra aff. silvatica Ducke 1 1 0.03 0.03 0.23 0.28 EAFM: 11065 PERACEAE
Perabicolor (Klotzsch) Müll.Arg. 8 4 0.20 0.22 0.92 1.34 INPA: 262106 - EAFM: 11183
Family/Species N N Par RDe RDo RFr IVI Voucher Number PRIMULACEAE
Cybianthusguyanensis (A.DC.) Miq. 7 2 0.18 0.04 0.46 0.68 INPA: 262075 / 262076 EAFM: 11080 / 11081
Cybianthus sp. 21 5 0.53 0.34 1.15 2.02 EAFM: 11079
Rhizophoraceae
Sterigmapetalumcolombianum Monach. 27 6 0.68 0.54 1.38 2.61 EAFM: 11186 RUBIACEAE
Duroiasaccifera (Schult. & Schult.f.) K.Schum. 37 5 0.94 0.24 1.15 2.33 INPA: 262125 / 262126 / 262127 / 262128
Kutchubaeaoocarpa (Spruce ex Standl.) C.H.Perss. 4 2 0.10 0.02 0.46 0.58 INPA: 262131 / 262132 EAFM: 11228 / 11229
Kutchubaeasericantha Standl. 110 7 2.78 1.17 1.61 5.56 INPA: 262129 / 262130 EAFM: 11226 / 11227
Pagameaduckei Standl. 217 7 5.49 1.19 1.61 8.29 INPA: 262123 / 262124 EAFM: 11220 / 11221
Pagameaguianensis Aubl. 3 2 0.08 0.04 0.46 0.57 INPA: 262122 - EAFM: 11218 SAPINDACEAE
Mataybainelegans Spruce ex Radlk. 4 2 0.10 0.02 0.46 0.58 INPA: 262088 / 262089 EAFM: 11118 / 11119
Mataybaopaca Radlk. 59 7 1.49 0.61 1.61 3.72 EAFM: 11120
Matayba sp. 2 1 0.05 0.01 0.23 0.29 EAFM: 11117
Talisiafirma Radlk. 8 3 0.20 0.08 0.69 0.97 EAFM: 11121 / 11122
Talisiaghilleana Acev.-Rodr. 4 2 0.10 0.02 0.46 0.58 EAFM: 11123
Vouaranaguianensis Aubl. 2 2 0.05 0.01 0.46 0.52 EAFM: 11124 SAPOTACEAE
Chrysophyllumcuneifolium (Rudge) A.DC. 30 4 0.76 0.31 0.92 1.99 INPA: 262098 - EAFM: 11154
Chrysophyllumsanguinolentum (Pierre) Baehni 24 6 0.61 0.62 1.38 2.61 EAFM: 11153
Chrysophyllum sp. 1 1 0.03 0.04 0.23 0.30 EAFM: 11152
Manilkarabidentata (A.DC.) A.Chev. 129 8 3.26 4.02 1.84 9.13 EAFM: 11157 / 11158
Micropholis aff. guyanensis (A.DC.) Pierre 1 1 0.03 0 0.23 0.26 EAFM: 11155
Pouteriacuspidata (A.DC.) Baehni 1 1 0.03 0.02 0.23 0.27 EAFM: 11149
Pouteria aff. cuspidata (A.DC.) Baehni 2 1 0.05 0.11 0.23 0.40 EAFM: 11148
Pouteria aff. elegans (A.DC.) Baehni 80 5 2.02 1.64 1.15 4.82 INPA: 262096 - EAFM: 11142 / 11143
Pouteriaoblanceolata Pires 23 3 0.58 0.63 0.69 1.90 INPA: 262097 / EAFM: 11150
Pouteria sp.1 20 5 0.51 0.35 1.15 2.01 EAFM: 11144 / 11145
Pouteria sp.2 1 1 0.03 0.03 0.23 0.28 EAFM: 11146
Pouteria sp.3 1 1 0.03 0.01 0.23 0.27 EAFM: 11147
Pradosiaschomburgkiana (A.DC.) Cronquist 70 7 1.77 0.98 1.61 4.36 EAFM: 11156
Sapotaceae sp. 1 1 0.03 0.20 0.23 0.46 Not Collected SIMAROUBACEAE
Simaba guianensis Aubl. 91 6 2.30 3.21 1.38 6.89 EAFM: 10942
Simaroubaamara Aubl. 48 7 1.21 1.66 1.61 4.49 INPA: 262066 - EAFM: 10943 / 10944 URTICACEAE
Coussapoaasperifolia Trécul 1 1 0.03 0.01 0.23 0.26 EAFM: 11077 VOCHYSIACEAE
Vochysia sp. 1 1 0.03 0.01 0.23 0.26 EAFM: 11189