DIALLEL CROSSING AMONG MAIZE POPULATIONS FOR
RESISTANCE TO FALL ARMYWORM
María del Pilar Alvarez
1; José Branco de Miranda Filho
2*
1
INTA (Instituto Nacional de Tecnología Agropecuaria) Ruta 178, km 4,5. CC 31 (2700) Pergamino, BA. Argentina. 2
Depto. de Genética - USP/ESALQ, C.P. 83 - CEP: 13400-970 - Piracicaba, SP. *Corresponding author <[email protected]>
ABSTRACT: Among the insects infecting the maize (Zea mays L.) crop in Brazil, the fall armyworm (Spodoptera frugiperda Smith, 1797, Lepdoptera: Noctuidae) is considered one of the most important because it causes
the highest damage to yield. Genetic resistance to the fall armyworm has be an effective control strategy. The main objective of this work was to evaluate new germplasm sources for resistance to the fall armyworm, the key pest for the maize crop in Brazil. A partial diallel design between 20 varieties of Brazilian germplasm and nine exotic and semi-exotic varieties of different origin was used. The 180 crosses and 29 parental varieties along with two commercial checks were evaluated in three locations in the State of São Paulo State (Brasil).
Fall armyworm resistance (FAWR) under artificial and natural infestations, grain yield (GY), and plant height (PH) were analyzed. The populations CMS14C and MIRT, and hybrid São José x MIRT showed the highest resistance, with values of 1.8, 1.7 and 1.4, respectively. Populations PMI9401 and PR91B, and the hybrid CMS14C x (B97xITU) had best yields, with 4893, 3858 and 5677 kg ha-1, respectively. Heterosis ranged from –28% to 47% for FAWR and from –21% to 125% for GY, with mean values of –0,43% and 31%, respectively. Genotype by environment interaction was not significant for FAWR. The effects of varieties and heterosis were significant for all traits, showing that both additive and dominance effects may be important as sources of variation. For FAWR, only specific heterosis presented significance, suggesting strong genetic divergence between specific pairs of parental populations. Brasilian populations PMI9302 and São José, and the exotic population PR91B presented high performance per se, and also in croses for FAWR and GY. Crosses PMI9401
x (Cuba110 x EsalqPB1) and São José x MIRT presented high specific heterosis effects for both characters. These populations can be useful to be introgressed in maize breeding programs.
Key words: genetic resistance, partial diallel, germplasm
CRUZAMENTO DIALÉLICO ENTRE POPULAÇÕES DE MILHO PARA
RESISTÊNCIA À LAGARTA DO CARTUCHO
RESUMO: Dentre as pragas que infestam a cultura de milho (Zea mays L.) no Brasil, destaca-se a lagarta do cartucho (Spodoptera frugiperda Smith, 1797, Lepdoptera: Noctuidae), considerada como a praga chave por
ser a que produz o maior dano. A utilização de cultivares resistentes constitui um método de controle eficiente. O principal objetivo deste trabalho foi a avaliação de novas fontes de germoplasma para resistência à lagarta do cartucho, praga chave da cultura de milho no Brasil. Foi utilizado um esquema dialélico parcial entre 20 populações representantes de germoplasma brasileiro e nove populações exóticas e semi-exóticas de diferentes origens. Os 180 híbridos e as 29 variedades genitoras, junto com duas testemunhas comerciais, foram avaliados em três locais no Estado de São Paulo (Brasil). Foram analizados os caracteres resistência à lagarta do cartucho (RLC), sob infestação artificial e natural, produtividade de grãos (PG) e altura de planta (AP). As populações CMS14C e MIRT, e o híbrido São José x MIRT apresentaram a maior resistência, com valores de 1,8 , 1,7 e 1,4, respectivamente. As populações PMI9401 e PR91B, e o híbrido CMS14C x (B97 x ITU) tiveram a maior produtividade, com 4893, 3858 e 5677 kg ha-1, respectivamente. Os valores de heterose foram de –28% a 47% para RLC e de –21% a 125% para PG, com valores médios de –0,43% e 31%, respectivamente. O caráter RLC não apresentou interação genótipo x ambiente significativa. Os efeitos de variedades e de heterose foram significativos para os três caracteres, indicando que tanto os efeitos aditivos quanto os de dominância podem ser importantes como fontes de variação. Para FAWR, somente a heterose específica foi significativa, sugerindo uma forte divergência genética entre pares específicos de populações parentais. As populações brasileiras PMI9302 e São José, e a população exótica PR91B apresentaram boa performance per se e em cruzamentos para resistência e produtividade. Os híbridos PMI9401 x (Cuba110 x ESALQ-PB1) e (São José x MIRT) apresentaram altos efeitos de heterose específica para ambos caracteres. Estes materiais podem ser promissores para sua incorporação em programas de melhoramento.
Palavras-chave: resistência genética, dialelo parcial, germoplasma
INTRODUCTION
Among the insects infecting the maize crop in
Brazil, the fall armyworm (
Spodoptera frugiperda
Smith,
The genetic potential of different materials are
usually studied in controlled crosses; in this sense, the
diallel mating scheme has been useful and largely used
to estimate the potential value of genotypes
per se
, their
combining ability and heterosis effects (Hallauer &
Miranda Filho, 1995). Miranda Filho & Geraldi (1984)
suggested the partial diallel cross between two fixed sets
of varieties or lines, as an adaptation of the complete
diallel model of Gardner & Eberhart (1966). Geraldi &
Miranda Filho (1988) concluded that the adapted model
of Gardner & Eberhart (1966) is more informative than
the partial diallel adapted from Griffing’s (1956) model.
The objectives of the present work were to evaluate
maize germplasm from Brazil and exotic or semi-exotic
germplasm for their agronomic traits and resistance to fall
armyworm; to estimate genetic parameters for agronomic
traits and resistance to fall armyworm using the partial
diallel scheme (Miranda Filho & Geraldi, 1984); and to
select populations with high level of resistance and
desirable agronomic traits to be indicated for their use in
breeding programs.
MATERIAL AND METHODS
Germplasm
The identification of populations used in this work
is shown in Table 1, divided in two groups: Group I,
comprising 20 Brazilian populations previously introduced
in the NAP (
Núcleo de Apoio à Pesquisa
) Project; and
Group II, represented by nine exotic and semi-exotic
populations of diverse origins. The 20 populations of
Group I were selected for fall armyworm resistance, from
113 populations of the NAP Project, under artificial
infestation (data not shown).
Exotic populations were introduced on the basis
of their pattern of resistance to
S. frugiperda
or other corn
borer species in their sites of origin. Some of the exotics
(MIRT and PR91B) were used directly and others were
previously crossed with local populations to develop
semi-exotics better adapted to local conditions. Two
commercial hybrids (MASTER: resistant; and P3041:
susceptible) were used as checks, which were chosen
as the extremes for resistant pattern from a set of 12
cultivars previously evaluated under artificial and natural
infestation (data not shown).
Experiments
Populations of Group I were crossed with Group
II, under partial diallel scheme suggested by Miranda Filho
& Geraldi (1984). The 211 entries (29 parental populations,
180 crosses and 2 hybrid checks) were evaluated in two
locations representing three environments: [1] Piracicaba
(SP), under artificial infestation; [2] Anhembi (SP), under
natural infestation; and [3] Piracicaba (SP), under no
infestation. The geographical coordinates, represented by
latitude, longitude and altitude of the two locations are:
22°42’South, 47°38’ West and 546 m for Piracicaba; and
22°48’South, 48°07’ West and 469 m for Anhembi,
of the order of 15% to 34% have been reported,
depending on the phase of the plant development (Cruz,
1995).
The use of resistant cultivars has been suggested
by several authors (Sprague & Dahms, 1972; Wiseman
& Widstrom, 1992) as an efficient and feasible method
to control armyworm infestation, either by decreasing the
population of insects or by increasing the efficiency of
insecticide application, thus reducing the amount of
chemical products and also reducing the negative impact
on environment.
In spite of the great genetic variability of the
maize germplasm in Brazil, little is known in relation to
the genetic potential of different materials as sources of
resistance to insect infestations. The characterization of
germplasm and the identification of new sources of
resistance to be used in the development of new
commercial varieties become more important when faced
to the presence or the increase of insects attacks.
Breeding for resistance to fall armyworm has had
a slow development until the advent of techniques for
artificial infestation that allowed uniform evaluations of
large number of plants in the field. Such techniques were
developed by Ortega et al. (1980) and modified by
Wiseman & Widstrom (1980). Artificial infestation has the
advantage to provide more uniform levels of attack, with
approximately the same number of larvae per plant. The
evaluation under such conditions are really necessary
when the high natural infestation does not occur in the
experiment. On the other hand, there are environments
where the population of insects remain at a high level
every year, so that natural infestation is sufficient to
assure evaluation with the desired precision. In the
evaluation under field conditions, visual scales are used,
which take into account the type of damage (size and
number of lesions) and the damaged tissues (leaves and/
or whorl) (Carvalho, 1970; Davis et al., 1992).
respectively. The three environments will be here
designated as experiments, symbolized by EXP [1], EXP
[2] and EXP [3], respectively. A completely randomized
block design was used, with one-row plots, 5 m long with
spaces of 0.9 m between rows and 0.2 m between plants
within rows; with an expected stand of 25 plants per plot
after thinning. Number of replications were three in EXP
[1] and EXP [3] and four in EXP [2]. Planting dates were
September 23, September 22 and November 20 for EXP
[1], EXP [2] and EXP [3], respectively, in 1998. Plots of
the susceptible check were intercalated each 15 rows in
EXP [1] and EXP [2], for observation on the uniformity of
infestations and for calculating the correlation between
traits.
Evaluated traits
The resistance to the fall armyworm (RFA) was
evaluated in EXP [1] under artificial infestation and in
EXP [2] under natural infestation. Artificial infestation in
the field was made by application of young larvae mixed
with corn cob grits using a manual dispenser “bazooka”
(Wiseman et al., 1980). Infestations were made in eight
plants per plot in the stages V6 to V8, with approximately
15 larvae per plant. In EXP [1] visual evaluation of the
damage was at 7 and 14 days after infestation. In EXP
[2] the first evaluation was 7 days after the stages
V6-V8, following another evaluation one week later. In both
experiments a scale of notes (0: non-damaged plant to
5: plant whorl completely destroyed) was used (Carvalho,
1970). Data for statistical analysis was represented by
the average of two measurements, as suggested by
Davis et al. (1992). Grain yield (GY: total grain weight of
the plot, in kg ha
-1) and plant height (PH: mean of ten
plants per plot, in cm) were also included for analysis of
EXP [2] and EXP [3].
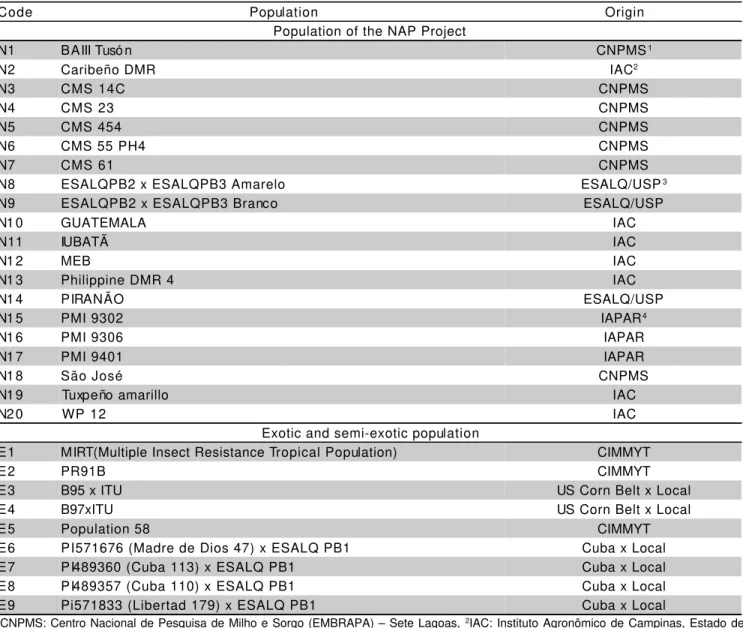
Table 1 - Designation and origin of populations from the NAP Project (Group I) and exotic and semi-exotic populations (Group II).
1CNPMS: Centro Nacional de Pesquisa de Milho e Sorgo (EMBRAPA) – Sete Lagoas, 2IAC: Instituto Agronômico de Campinas, Estado de São Paulo. 3ESALQ/USP: Escola Superior de Agricultura “Luiz de Queiroz” (Universidade de São Paulo) – Piracicaba, Estado de São Paulo. 4IAPAR: Instituto Agronômico do Estado de Paraná. Londrina, Estado de Paraná.
Code Population Origin
Population of the NAP Project
N1 BAIII Tusó n CNPMS1
N2 Caribeño DMR IAC2
N3 CMS 14C CNPMS
N4 CMS 23 CNPMS
N5 CMS 454 CNPMS
N6 CMS 55 PH4 CNPMS
N7 CMS 61 CNPMS
N8 ESALQPB2 x ESALQPB3 Amarelo ESALQ/USP3
N9 ESALQPB2 x ESALQPB3 Branco ESALQ/USP
N1 0 GUATEMALA IAC
N11 IUBATÃ IAC
N1 2 MEB IAC
N1 3 Philippine DMR 4 IAC
N1 4 PIRANÃO ESALQ/USP
N1 5 PMI 9302 IAPAR4
N1 6 PMI 9306 IAPAR
N1 7 PMI 9401 IAPAR
N1 8 São José CNPMS
N1 9 Tuxpeño amarillo IAC
N2 0 WP 12 IAC
Exotic and semi-exotic population
E1 MIRT(Multiple Insect Resistance Tropical Population) CIMMYT
E2 PR91B CIMMYT
E3 B95 x ITU US Corn Belt x Local
E4 B97xITU US Corn Belt x Local
E5 Population 58 CIMMYT
E6 PI571676 (Madre de Dios 47) x ESALQ PB1 Cuba x Local
E7 PI489360 (Cuba 113) x ESALQ PB1 Cuba x Local
E8 PI489357 (Cuba 110) x ESALQ PB1 Cuba x Local
Statistical analysis
Preliminary analysis of variance for each
experiment and combined analysis over experiments
were performed for all traits. The analysis of variance of
the partial diallel tables combined over experiments
followed the model (Miranda Filho & Geraldi, 1984;
Belluci, 1994):
Y
ijk=
µ
+
α
[d + (ld)
k] + ½ [v
i+ v
j+ (lv)
ik+ (lv)
jk] + l
k+
θ
[ h + h
i+ h
j+ s
ij+ (1 h )
k+ (lh)
ik+ (lh)
jk+ (ls)
ijk+ e
ijkwhere Y
ijkis the mean of the cross between i
thpopulation
(Group I) and j
thpopulation (Group II) in the k
thexperiment;
µ
is the mean of the two groups;
α
= 1,
α
=
-1 and
α
= 0 for parental varieties of groups I and II and
crosses, respectively; d is a measure of the difference
between group means; v
iand v
jare the effects of
populations for Groups I and II, respectively; l
kis the fixed
effect of experiments;
θ
= 0 for parental populations (Y
iiand Y
jj) and
θ
= 1 for crosses (Y
ij); h is the average
heterosis over experiments; h
iand h
jare the effects of
heterosis of populations for Groups I and II, respectively;
s
ijis the specific heterosis of the cross i x j; e
ijkis the
error term associated to the observed mean (Y
ii, Y
jjor
Y
ij) in the k
thexperiment; all other terms in the model refer
to the interaction of the respective effects with
experiments (environments).
RESULTS AND DISCUSSION
Observed means are presented for three traits:
RFA, combined for EXP. [1] and EXP. [2]; GY for EXP.
[2] and EXP. [3] and PH combined for EXP. [2] and EXP.
[3] (Table 2).
Preliminary analyses of variance
The preliminary analysis of variance, combined
over experiments (data not shown), revealed differences
between the hybrid checks for the variable RFA,
indicating the effectiveness of the conditions of infestation
for the discrimination between genotypes. Also, the
non-significance of the interaction checks x experiments
indicated that the reaction of the hybrid checks was
relatively stable, even though the level of incidence of
S.
frugiperda
was different between experiments. The non
significance of the treatment x experiment interaction also
reinforce the stable response of genotypes under the two
different conditions of infestation.
For the variable GY significance was detected for
both treatments and treatment x experiment interaction,
indicating results should be interpreted for each
experiment representing different environments. A similar
pattern of significance was observed for the variable PH,
but the mean square for treatments was 6.6 times greater
than for the interaction treatment x experiment; although
significant, the later showed a lower level of variation, as
indicated by the F test (F = 1.4). For that reason, all
parameters for PH were calculated with the mean over
experiments.
Analysis of the diallel tables
Table 3 shows the analyses of variance for the
three variables for the partial diallel table, represented by
observed means of parental populations and their
crosses. Differences were observed between groups for
RFA (
P
< 0.01) and PH (
P
< 0.05). For RFA the difference
was for advantage of Group II (lower mean) with an
estimated parameter of d = 0.162. This result is explained
by the fact that the NAP populations (Group I) were
chosen for their pattern of resistance to
S. frugiperda
but,
except for CMS14C, CMS23 and São José, all other were
never submitted to selection for resistance. On the other
hand, the exotic populations (Group II) were released for
their high pattern of resistance to
S. frugiperda
and other
Lepdoptera
species.
Populations N3 (CMS14C) and E1 (MIRT), and
the cross N18 (São José) x E1 (MIRT) presented highest
resistance, with values of 1.8, 1.7 and 1.4, respectively.
Populations PMI9401 and PR91B, and hybrid CMS14C
x (B97xITU) had best yields, with 4893, 3858 and
5677 kg ha
-1, respectively (Table 2). Genotype by
environment interaction was not significant for FAWR
(Table 3).
Heterosis showed significance (
P
< 0.01) for all
traits. For RFA the significant components of heterosis
were population heterosis in Group I and specific heterosis;
h
= - 1.04%) indicated non unidirectional dominance
effects (Vencovsky & Barriga, 1992), which can be
explained by the presence of different mechanisms of
resistance, under the control of different genetic systems.
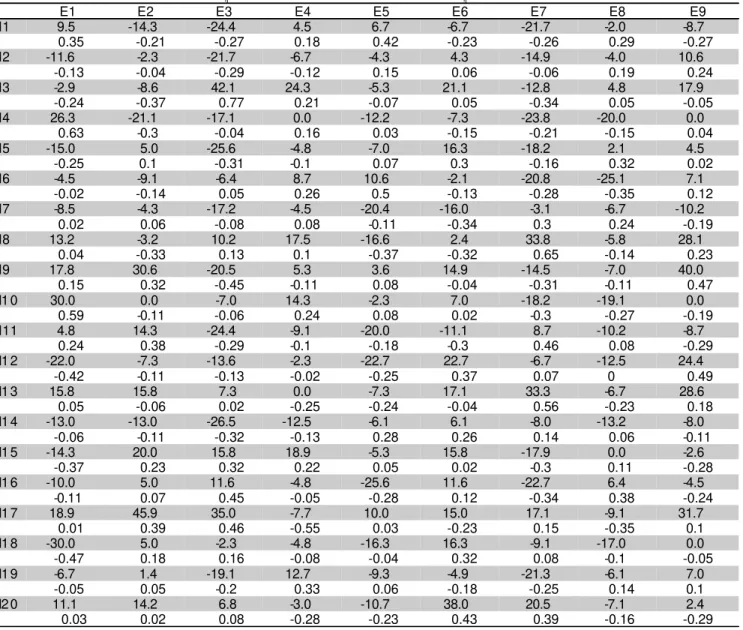
In fact, the heterosis effects in crosses varied from
negative (-28%) to positive (47%) in the crosses N14 x E3
and N3 x E3, respectively (Table 4). For GY and PH all
the heterosis components showed significance.
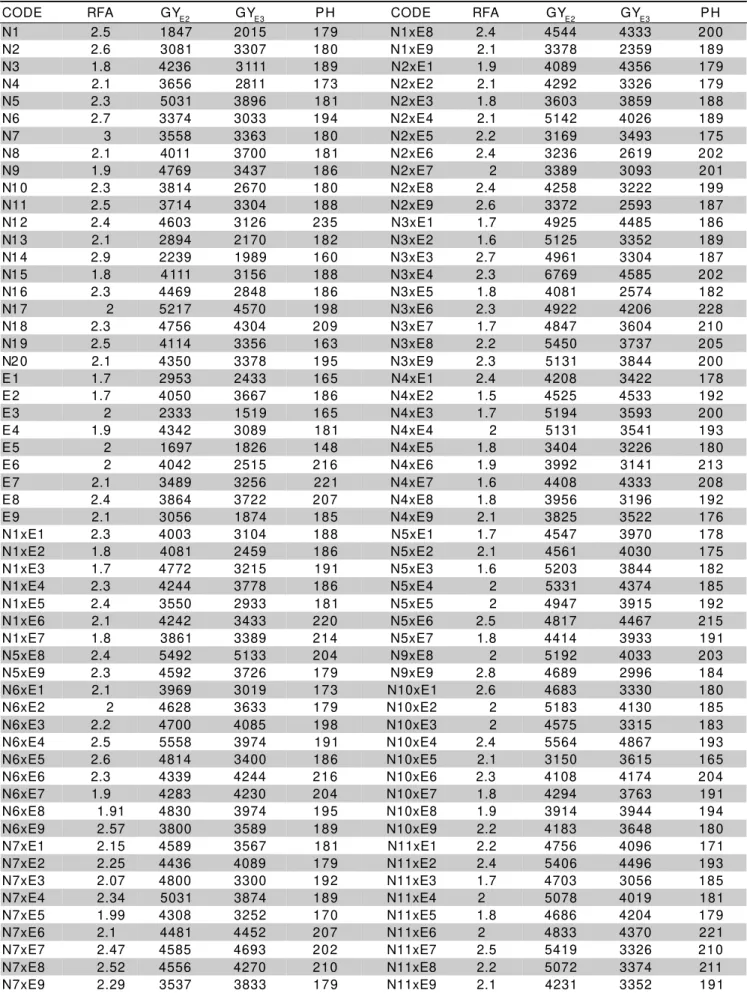
Table 2 - Observed means for resistance to fall armyworm (RFA), grain yield (GY) and plant height (PH) for populations and crosses.
CODE RFA GYE2 GYE3 PH CODE RFA GYE2 GYE3 PH
N1 2.5 1847 2015 179 N1xE8 2.4 4544 4333 200
N2 2.6 3081 3307 180 N1xE9 2.1 3378 2359 189
N3 1.8 4236 3 111 189 N2xE1 1.9 4089 4356 179
N4 2.1 3656 2811 173 N2xE2 2.1 4292 3326 179
N5 2.3 5031 3896 181 N2xE3 1.8 3603 3859 188
N6 2.7 3374 3033 194 N2xE4 2.1 5142 4026 189
N7 3 3558 3363 180 N2xE5 2.2 3169 3493 175
N8 2.1 4011 3700 181 N2xE6 2.4 3236 2619 202
N9 1.9 4769 3437 186 N2xE7 2 3389 3093 201
N1 0 2.3 3814 2670 180 N2xE8 2.4 4258 3222 199
N11 2.5 3714 3304 188 N2xE9 2.6 3372 2593 187
N1 2 2.4 4603 3126 235 N3xE1 1.7 4925 4485 186
N1 3 2.1 2894 2170 182 N3xE2 1.6 5125 3352 189
N1 4 2.9 2239 1989 160 N3xE3 2.7 4961 3304 187
N1 5 1.8 4 111 3156 188 N3xE4 2.3 6769 4585 202
N1 6 2.3 4469 2848 186 N3xE5 1.8 4081 2574 182
N1 7 2 5217 4570 198 N3xE6 2.3 4922 4206 228
N1 8 2.3 4756 4304 209 N3xE7 1.7 4847 3604 210
N1 9 2.5 4114 3356 163 N3xE8 2.2 5450 3737 205
N2 0 2.1 4350 3378 195 N3xE9 2.3 5131 3844 200
E1 1.7 2953 2433 165 N4xE1 2.4 4208 3422 178
E2 1.7 4050 3667 186 N4xE2 1.5 4525 4533 192
E3 2 2333 1519 165 N4xE3 1.7 5194 3593 200
E4 1.9 4342 3089 181 N4xE4 2 5131 3541 193
E5 2 1697 1826 148 N4xE5 1.8 3404 3226 180
E6 2 4042 2515 216 N4xE6 1.9 3992 3141 213
E7 2.1 3489 3256 221 N4xE7 1.6 4408 4333 208
E8 2.4 3864 3722 207 N4xE8 1.8 3956 3196 192
E9 2.1 3056 1874 185 N4xE9 2.1 3825 3522 176
N1xE1 2.3 4003 3104 188 N5xE1 1.7 4547 3970 178
N1xE2 1.8 4081 2459 186 N5xE2 2.1 4561 4030 175
N1xE3 1.7 4772 3215 191 N5xE3 1.6 5203 3844 182
N1xE4 2.3 4244 3778 186 N5xE4 2 5331 4374 185
N1xE5 2.4 3550 2933 181 N5xE5 2 4947 3915 192
N1xE6 2.1 4242 3433 220 N5xE6 2.5 4817 4467 215
N1xE7 1.8 3861 3389 214 N5xE7 1.8 4414 3933 191
N5xE8 2.4 5492 5133 204 N9xE8 2 5192 4033 203
N5xE9 2.3 4592 3726 179 N9xE9 2.8 4689 2996 184
N6xE1 2.1 3969 3019 173 N10xE1 2.6 4683 3330 180
N6xE2 2 4628 3633 179 N10xE2 2 5183 4130 185
N6xE3 2.2 4700 4085 198 N10xE3 2 4575 3315 183
N6xE4 2.5 5558 3974 191 N10xE4 2.4 5564 4867 193
N6xE5 2.6 4814 3400 186 N10xE5 2.1 3150 3615 165
N6xE6 2.3 4339 4244 216 N10xE6 2.3 4108 4174 204
N6xE7 1.9 4283 4230 204 N10xE7 1.8 4294 3763 191
N6xE8 1.91 4830 3974 195 N10xE8 1.9 3914 3944 194
N6xE9 2.57 3800 3589 189 N10xE9 2.2 4183 3648 180
N7xE1 2.15 4589 3567 181 N11xE1 2.2 4756 4096 171
N7xE2 2.25 4436 4089 179 N11xE2 2.4 5406 4496 193
N7xE3 2.07 4800 3300 192 N11xE3 1.7 4703 3056 185
N7xE4 2.34 5031 3874 189 N11xE4 2 5078 4019 181
N7xE5 1.99 4308 3252 170 N11xE5 1.8 4686 4204 179
N7xE6 2.1 4481 4452 207 N11xE6 2 4833 4370 221
N7xE7 2.47 4585 4693 202 N11xE7 2.5 5419 3326 210
N7xE8 2.52 4556 4270 210 N11xE8 2.2 5072 3374 211
RFA – means of two experiments (environments) in notes from 0 to 5 (see text). GYE1 and GYE3 : means in kg ha-1 for EXP 2 and EXP 3, respectively.
PH : mean of two experiments (EXP 2 and EXP 3).
N8xE1 2.1 5 4308 4044 182 N12xE1 1.6 4706 2885 211
N8xE2 1.8 4 5133 4578 176 N12xE2 1.9 5614 3200 200
N8xE3 2.2 6 5272 2963 188 N12xE3 1.9 5208 3293 207
N8xE4 2.3 5 5108 4867 186 N12xE4 2.1 5306 3652 211
N8xE5 1.7 1 3767 3981 185 N12xE5 1.7 5042 3378 212
N8xE6 2.1 4628 3178 225 N12xE6 2.7 3456 2170 252
N8xE7 2.8 1 4275 3804 198 N12xE7 2.1 4433 4363 239
N8xE8 2.1 2 5069 3930 190 N12xE8 2.1 4756 4185 217
N8xE9 2.6 9 4164 3374 186 N12xE9 2.8 4556 3174 205
N9xE1 2.1 2 5019 3948 186 N13xE1 2.2 4472 2893 176
N9xE2 2.3 5 5186 4489 188 N13xE2 2.2 4419 3578 183
N9xE3 1.5 5 3967 3133 187 N13xE3 2.2 3567 3015 175
N9xE4 2 5625 3493 193 N13xE4 2 5250 3893 201
N9xE5 2.0 2 4486 3256 185 N13xE5 1.9 4003 3593 174
N9xE6 2.2 4 4733 3344 212 N13xE6 2.4 3792 3607 216
N9xE7 1.7 1 4239 3659 201 N13xE7 2.8 3669 4230 203
N13xE8 2.1 4408 4122 205 N17xE8 2 4556 4270 218
N13xE9 2.7 4608 2907 193 N17xE9 2.7 3537 3833 196
N14xE1 2 5136 4544 201 N18xE1 1.4 4308 4044 195
N14xE2 2 4350 2611 196 N18xE2 2.1 5133 4578 202
N14xE3 1.8 5319 3756 198 N18xE3 2.1 5272 2963 185
N14xE4 2.1 4472 3789 189 N18xE4 2 5108 4867 200
N14xE5 2.3 4689 3037 195 N18xE5 1.8 3767 3981 197
N14xE6 2.6 4250 2741 230 N18xE6 2.5 4628 3178 209
N14xE7 2.3 3644 3526 213 N18xE7 2 4275 3804 222
N14xE8 2.3 5569 4407 219 N18xE8 1.9 5 5031 4556 219
N14xE9 2.3 4908 3081 196 N18xE9 2.2 4211 3326 181
N15xE1 1.5 4314 4056 178 N19xE1 1.9 6 3803 4074 171
N15xE2 2.1 5225 3800 177 N19xE2 2.1 3 5264 3504 170
N15xE3 2.2 5508 4048 188 N19xE3 1.8 2 5003 3448 175
N15xE4 2.2 5589 3085 174 N19xE4 2.4 8 6006 4693 179
N15xE5 1.8 4094 3304 187 N19xE5 2.0 4 4256 3441 172
N15xE6 2.2 4464 4752 215 N19xE6 2.1 4 4 111 4263 204
N15xE7 1.6 4836 3819 202 N19xE7 1.81 3953 3556 195
N15xE8 2.1 5492 5133 206 N19xE8 2.3 5011 3800 190
N15xE9 1.9 4592 3726 189 N19xE9 2.4 6 3200 2626 177
N16xE1 1.8 3969 3019 183 N20xE1 2 .11 5636 4367 182
N16xE2 2.1 4628 3633 172 N20xE2 2.1 7 5167 3944 168
N16xE3 2.4 4700 4085 191 N20xE3 2.1 9 5553 3533 189
N16xE4 2 5558 3974 183 N20xE4 1.9 4 6050 4374 203
N16xE5 1.6 4814 3400 175 N20xE5 1.8 3 4831 3552 191
N16xE6 2.4 4339 4244 218 N20xE6 2.8 3 4728 3770 220
N16xE7 1.7 4283 4230 201 N20xE7 2.5 3 4969 3996 196
N16xE8 2.5 4830 3974 205 N20xE8 2.0 9 6086 4841 202
N16xE9 2.1 3800 3589 178 N20xE9 2.1 5 5733 3333 188
N17xE1 2.2 4589 3567 166 Mean 2.1 4 4486 3634 192.7
N17xE2 2.7 4436 4089 191 Max 3.0 0 6769 5133 251.7
N17xE3 2.7 4800 3300 191 Mi n 1.4 0 1697 1519 147.7
N17xE4 1.8 5031 3874 194 HR 1.9 7 5706 4567 186.8
N17xE5 2.2 4308 3252 179 HS 3.0 0 6847 4774 197.3
N17xE6 2.3 4481 4452 226 --- --- --- ---
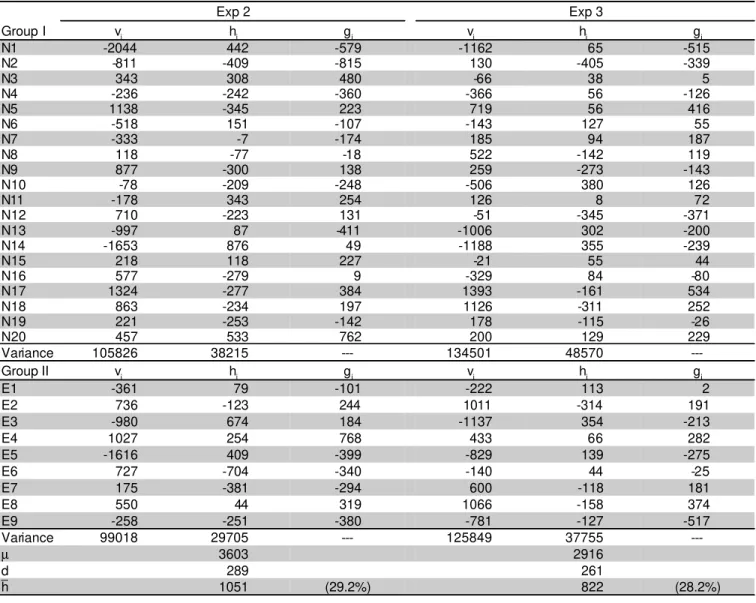
---For GY the highest GCA effects in EXP 2 were
observed for N20 (WP12), N3 (CMS14C) and N17
(PMI9401) in Group I and for E4 (B97 x ITU), E8 (Cuba
110 x ESALQ PB1), E2 (PR91B) and E3 (B95 x ITU) in
Group II. In EXP 3 the highest GCA effects were for N17
(PMI9401), N5 (CMS454), N18 (São José) and N20
(WP12) in Group I and E8 (Cuba110 x ESALQPB1), E4
(B97 x ITU), E2 (PR91B) and E7 (Cuba113 x
ESALQPB1) in Group II.
Regarding PH, low estimates are desired if the
objective is to identify populations with lower plant height
and ear height, as generally occur with tropical
germplasm. Lower estimates of GCA were obtained for
N19 (Tuxpeño amarillo), N10 (Guatemala), N2 (Caribeño
DMR), N5 (CMS454) and N16 (PMI9306) in Group I; and
for populations E1 (MIRT), E5 (Pop. 58), E2(PR91B) and
E9(Libertad179 x ESALQPB1) in Group II.
Selection of populations
Heterosis in variety crosses can be used directly
in the first generation of the cross between two parental
varieties. The parental populations of heterotic crosses
also can be used for the development of inbred lines to
be used in hybrid crosses. On the other hand, the
synthesis of composites by intercrossing
n
parental
varieties is a mean to retain heterosis in the population,
because
(n-1)/n
of the heterosis component remain as
part of the expected mean of the new population (Miranda
Filho & Vencovsky, 1984).
In the present work, expressive heterosis effects
were detected for both RFA and GY, which can be utilized
by selecting the outstanding crosses. The effects of
varieties or populations also were detected in both groups
of populations and selection based on this parameter
leads to the identification of the most appropriate
populations for intrapopulation recurrent selection.
The correlation coefficients between RFA and GY,
calculated from measurements of the hybrid check,
planted every fifteen rows in the experiments, were non
significant: r = -11%,
P
= 0.46 under artificial infestation;
and r = -1,4%,
P
= 0.92 under natural infestation. For
this reason, selection of populations based only on GY
is not recommended and, both traits (RFA and GY) must
be taken into account.
Populations N4 (CMS23), N15 (PMI9302) and
N18 (São José) from Group I, and E1 (MIRT) and E2
(PR91B), from Group II, showed the best performance
for RFA in crosses. The good resistance level of crosses
between these two selected groups is explained by the
fact that N4, N15 and N18 exhibited the best estimates
of g
iin Group I and E1 and E2 showed the best level of
resistance per se (v
j) in Group II.
For GY an analysis for each experiment
(environment) was necessary because the existence of
genotype x experiment interaction. In EXP 2, N4 did not
presented a good performance in relation to GCA effect
(g
i), while N15 and N18 showed good levels for GCA. In
Interactions of effects with experiments were
non-significant for RFA and AP (except populations I x
experiments); for GY all the effects presented interaction
with experiments.
Dominance effects can be an important source
of variation for all traits. The relative contribution of each
source of variation to the total sum of squares shows
that dominance effects are differentiated among the
studied traits. For RFA 32% of the total sum of squares
are due to the variation of populations while 68% are
attributed to the total heterosis; specific heterosis is
responsible for 84% of the total variation of heterosis.
For similar situations, Miranda Filho & Vencovsky (1984)
considered that even if the additive and dominance
effects are confounded in the effects of populations (v
iand v
j), it is reasonable to suppose that the dominance
effects are more expressive at the interpopulation
(population cross) level. The detection of dominance
effects in the control of the resistance to
S. frugiperda
was already reported by Williams et al. (1978), Widstrom
et al. (1993), Guimarães & Viana (1994), and Williams
et al. (1995). For GY and PH, the proportion of the
variation due to populations and heterosis were 46.9 :
53.1 and 77.8 : 22.2, indicating that the dominance at
the interpopulation level is more expressive for GY than
for PH. Similar results were reported by Miranda Filho
& Vencovsky (1984) and Santos et al. (1994). Low
heterotic response for PH has also been reported by
many authors (Castro et al. 1968; Barriga e Vencovsky,
1973; Souza, Jr., 1981; Miranda Filho & Vencovsky,
1984).
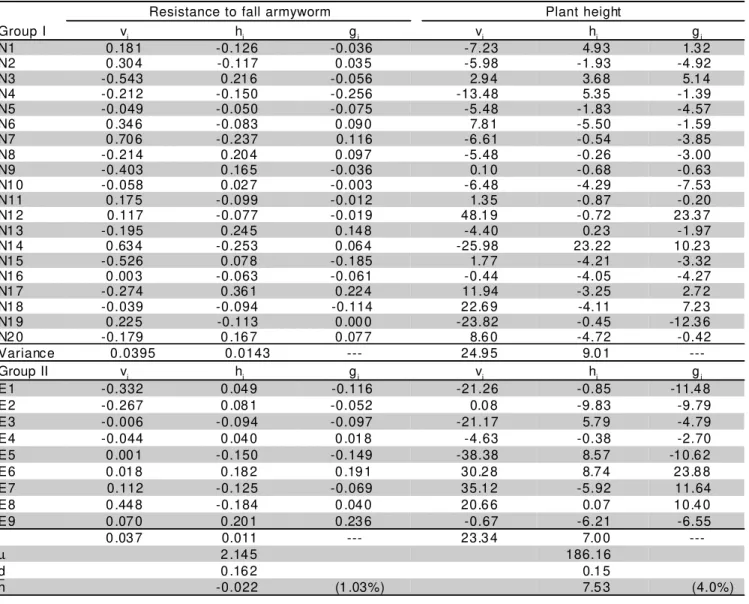
The estimates of the effects (
µ
, d, v
i, v
j,
h, h
i, h
j;
except s
ij) in the partial diallel model are presented in
Table 6 for RFA and PH and in Table 7 for GY for both
experiments. The effect of general combining ability
(GCA) was estimated by g
i=
12
v
i+ h
iand g
j=
1 2
v
j+ h
j(Geraldi & Miranda Filho, 1988). Outstanding populations
in Group I for GCA (negative g
i) of RFA were N4
(CMS23), N15 (PMI9302) and N18 (Tuxpeño Amarelo).
CMS23 is a population that had undergone selection at
EMBRAPA under artificial selection and was released for
its good level of resistance to
S. frugiperda
. Results
observed in the present work allowed the identification
of populations, as mentioned above, to be used as source
of resistance at levels similar to CMS23.
In Group II, two populations from CIMMYT (E1 –
MIRT and E2- PR91B) exhibited the best values for
resistance (negative v
j). The use of v
jinstead of g
j(Table 4) for discriminating the best populations is
explained by the non significance of population heterosis
effects. MIRT (
Multiple Insect Resistance for Tropical
Regions
) was selected at CIMMYT (Smith et al., 1989)
and released for its high resistance to several species
of the family
Lepdoptera
(
Ostrinia nubilalis
,
Diatraea
saccharalis
,
D. grandiosella
, and
S. frugiperda
). PR91B
Table 3 - Mean squares and their significance in the analyses of diallel tables for the variables RFA, GY and PH combined over experiments.
**, *, ns - significance levels for the F test: P < 0.01, P < 0.05 and non significant, respectively. 1Mean squares multiplied by 10-5
RFA GY1 PH
Source of variation GL Mean square
Dialelll 208 0.6753 ** 28.660 ** 1762.47 **
Gro up s 1 5.7230 ** 2.760 ns 1107.04 *
Populations (I) 19 1.0460 ** 76.979 ** 4506.65 **
Populations (II) 8 2.4401 ** 166.534 ** 24799.49 **
Heterosis 180 0.5297 ** 17.575 ** 452.58 **
Average heterosis 1 0.0756 ns 134.009 ** 8671.46 **
Population heterosis (I) 19 0.5745 ** 12.509 ** 762.61 **
Popula tion heterosis (II) 8 0.4804 ns 18.475 ** 1034.06 **
Specific heterosis 152 0.5297 ** 9.460 ** 329.15 **
Dialell x Experiments (E) 208 0.2999 ns 8.080 ** 265.17 **
Between experiments 1 16.229 ns 74.89 ns
Populations (I) x E 19 2787.904 ** 872.83 **
Populations (II) x E 8 6692.450 ** 357.51ns
He terosis x E 180 5.647 ** 197.98 ns
Avg. heterosis x E 1 43841.062 ** 608.33 ns
Pop. heterosis (I) x E 19 412.727 ** 239.83 ns
Pop. heterosis (II) x E 8 403.075 ** 284.72 ns
Specific he terosis x E 152 5.127 ns 185.48 ns
Pooled error 1050 0.2917 4.372 183.84
Table 4 - Estimates of total heterosis (hij: upper valuer) and specific heterosis (sij: lower values) for RFA in population crosses.
E1 E2 E3 E4 E5 E6 E7 E8 E9
N1 9.5 -14.3 -24.4 4.5 6.7 -6.7 -21.7 -2.0 -8.7 0.35 -0.21 -0.27 0.18 0.42 -0.23 -0.26 0.29 -0.27 N2 -11.6 -2.3 -21.7 -6.7 -4.3 4.3 -14.9 -4.0 10.6
-0.13 -0.04 -0.29 -0.12 0.15 0.06 -0.06 0.19 0.24 N3 -2.9 -8.6 42.1 24.3 -5.3 21.1 -12.8 4.8 17.9
-0.24 -0.37 0.77 0.21 -0.07 0.05 -0.34 0.05 -0.05 N4 26.3 -21.1 -17.1 0.0 -12.2 -7.3 -23.8 -20.0 0.0
0.63 -0.3 -0.04 0.16 0.03 -0.15 -0.21 -0.15 0.04 N5 -15.0 5.0 -25.6 -4.8 -7.0 16.3 -18.2 2.1 4.5
-0.25 0.1 -0.31 -0.1 0.07 0.3 -0.16 0.32 0.02 N6 -4.5 -9.1 -6.4 8.7 10.6 -2.1 -20.8 -25.1 7.1
-0.02 -0.14 0.05 0.26 0.5 -0.13 -0.28 -0.35 0.12 N7 -8.5 -4.3 -17.2 -4.5 -20.4 -16.0 -3.1 -6.7 -10.2
0.02 0.06 -0.08 0.08 -0.11 -0.34 0.3 0.24 -0.19 N8 13.2 -3.2 10.2 17.5 -16.6 2.4 33.8 -5.8 28.1
0.04 -0.33 0.13 0.1 -0.37 -0.32 0.65 -0.14 0.23 N9 17.8 30.6 -20.5 5.3 3.6 14.9 -14.5 -7.0 40.0
0.15 0.32 -0.45 -0.11 0.08 -0.04 -0.31 -0.11 0.47 N1 0 30.0 0.0 -7.0 14.3 -2.3 7.0 -18.2 -19.1 0.0
0.59 -0.11 -0.06 0.24 0.08 0.02 -0.3 -0.27 -0.19 N11 4.8 14.3 -24.4 -9.1 -20.0 -11.1 8.7 -10.2 -8.7
0.24 0.38 -0.29 -0.1 -0.18 -0.3 0.46 0.08 -0.29 N1 2 -22.0 -7.3 -13.6 -2.3 -22.7 22.7 -6.7 -12.5 24.4
-0.42 -0.11 -0.13 -0.02 -0.25 0.37 0.07 0 0.49 N1 3 15.8 15.8 7.3 0.0 -7.3 17.1 33.3 -6.7 28.6
0.05 -0.06 0.02 -0.25 -0.24 -0.04 0.56 -0.23 0.18 N1 4 -13.0 -13.0 -26.5 -12.5 -6.1 6.1 -8.0 -13.2 -8.0
-0.06 -0.11 -0.32 -0.13 0.28 0.26 0.14 0.06 -0.11 N1 5 -14.3 20.0 15.8 18.9 -5.3 15.8 -17.9 0.0 -2.6
-0.37 0.23 0.32 0.22 0.05 0.02 -0.3 0.11 -0.28 N1 6 -10.0 5.0 11.6 -4.8 -25.6 11.6 -22.7 6.4 -4.5
-0.11 0.07 0.45 -0.05 -0.28 0.12 -0.34 0.38 -0.24 N1 7 18.9 45.9 35.0 -7.7 10.0 15.0 17.1 -9.1 31.7
0.01 0.39 0.46 -0.55 0.03 -0.23 0.15 -0.35 0.1 N1 8 -30.0 5.0 -2.3 -4.8 -16.3 16.3 -9.1 -17.0 0.0 -0.47 0.18 0.16 -0.08 -0.04 0.32 0.08 -0.1 -0.05 N1 9 -6.7 1.4 -19.1 12.7 -9.3 -4.9 -21.3 -6.1 7.0
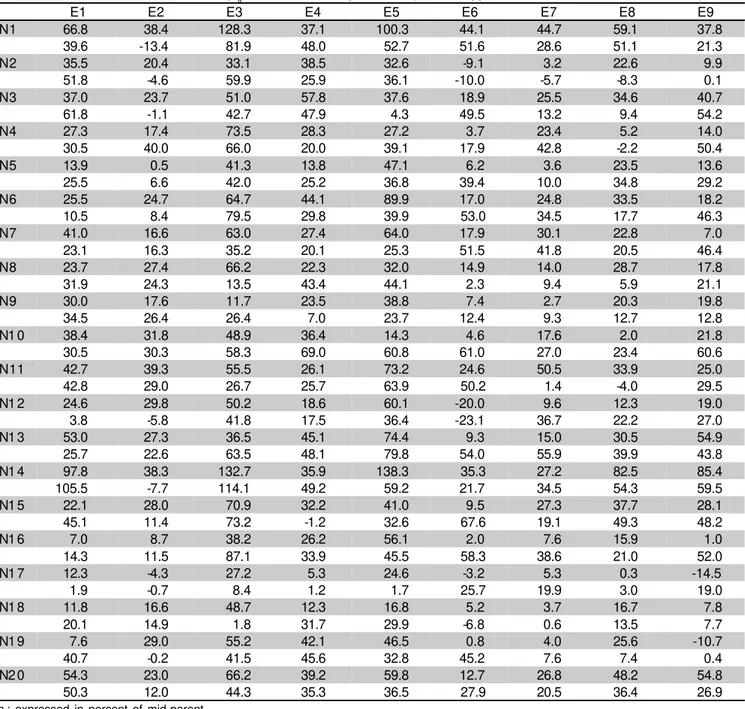
Table 5 – Estimates of total heterosis (hij) for GY in two experiments (EXP 2: upper values; and EXP 3: lower values).
hij: expressed in percent of mid-parent.
Group 2, E1 showed a low performance for GCA while
E2 were among the best ones for this effect. In EXP 3,
N18 and E2 were oustanding for GCA, while N4 and E1
were among the poorest ones.
Finally, when considering the general performance
for GY in crosses, N4 and E1 should be discarded among
the populations selected for RFA. Therefore, N15, N18
and E2 are recommended as the most promising for
incorporation in breeding programs, as indicated by their
good level of resistance to
S. frugiperda
and acceptable
agronomic traits. For plant height, N15 and E2 showed
negative values for GCA and should be indicated as
source of genotypes to lower plant architecture.
Selection of specific crosses also can be done
from the presented results. High specific heterosis for both
RFA and GY were shown by crosses N17 (PMI9401) x E8
(Cuba 110 x ESALQ PB1) and N18 (São José) x E1
(MIRT). Total heterosis in percent of mid-parent in these
crosses were 9% and 27% for RLC and 26% and 24% for
GY, respectively, the indicated crosses for their properties
can be used directly for the exploitation of heterosis in
reciprocal recurrent selection programs, or as base for the
development of inbred lines to be used in crosses.
ACKNOWLEDGES
To FAPESP for financial support.
REFERENCES
BARRIGA, P.; VENCOVSKY, R. Heterose da produção de grãos e de outros caracteres agronômicos em cruzamentos intervarietais de milho. Ciência e Cultura, v.25, p.880–885, 1973.
E1 E2 E3 E4 E5 E6 E7 E8 E9
N1 66.8 38.4 128.3 37.1 100.3 44.1 44.7 59.1 37.8
39.6 -13.4 81.9 48.0 52.7 51.6 28.6 51.1 21.3
N2 35.5 20.4 33.1 38.5 32.6 -9.1 3.2 22.6 9.9
51.8 -4.6 59.9 25.9 36.1 -10.0 -5.7 -8.3 0.1
N3 37.0 23.7 51.0 57.8 37.6 18.9 25.5 34.6 40.7
61.8 -1.1 42.7 47.9 4.3 49.5 13.2 9.4 54.2
N4 27.3 17.4 73.5 28.3 27.2 3.7 23.4 5.2 14.0
30.5 40.0 66.0 20.0 39.1 17.9 42.8 -2.2 50.4
N5 13.9 0.5 41.3 13.8 47.1 6.2 3.6 23.5 13.6
25.5 6.6 42.0 25.2 36.8 39.4 10.0 34.8 29.2
N6 25.5 24.7 64.7 44.1 89.9 17.0 24.8 33.5 18.2
10.5 8.4 79.5 29.8 39.9 53.0 34.5 17.7 46.3
N7 41.0 16.6 63.0 27.4 64.0 17.9 30.1 22.8 7.0
23.1 16.3 35.2 20.1 25.3 51.5 41.8 20.5 46.4
N8 23.7 27.4 66.2 22.3 32.0 14.9 14.0 28.7 17.8
31.9 24.3 13.5 43.4 44.1 2.3 9.4 5.9 21.1
N9 30.0 17.6 11.7 23.5 38.8 7.4 2.7 20.3 19.8
34.5 26.4 26.4 7.0 23.7 12.4 9.3 12.7 12.8
N1 0 38.4 31.8 48.9 36.4 14.3 4.6 17.6 2.0 21.8
30.5 30.3 58.3 69.0 60.8 61.0 27.0 23.4 60.6
N11 42.7 39.3 55.5 26.1 73.2 24.6 50.5 33.9 25.0
42.8 29.0 26.7 25.7 63.9 50.2 1.4 -4.0 29.5
N1 2 24.6 29.8 50.2 18.6 60.1 -20.0 9.6 12.3 19.0
3.8 -5.8 41.8 17.5 36.4 -23.1 36.7 22.2 27.0
N1 3 53.0 27.3 36.5 45.1 74.4 9.3 15.0 30.5 54.9
25.7 22.6 63.5 48.1 79.8 54.0 55.9 39.9 43.8
N1 4 97.8 38.3 132.7 35.9 138.3 35.3 27.2 82.5 85.4
105.5 -7.7 114.1 49.2 59.2 21.7 34.5 54.3 59.5
N1 5 22.1 28.0 70.9 32.2 41.0 9.5 27.3 37.7 28.1
45.1 11.4 73.2 -1.2 32.6 67.6 19.1 49.3 48.2
N1 6 7.0 8.7 38.2 26.2 56.1 2.0 7.6 15.9 1.0
14.3 11.5 87.1 33.9 45.5 58.3 38.6 21.0 52.0
N1 7 12.3 -4.3 27.2 5.3 24.6 -3.2 5.3 0.3 -14.5
1.9 -0.7 8.4 1.2 1.7 25.7 19.9 3.0 19.0
N1 8 11.8 16.6 48.7 12.3 16.8 5.2 3.7 16.7 7.8
20.1 14.9 1.8 31.7 29.9 -6.8 0.6 13.5 7.7
N1 9 7.6 29.0 55.2 42.1 46.5 0.8 4.0 25.6 -10.7
40.7 -0.2 41.5 45.6 32.8 45.2 7.6 7.4 0.4
N2 0 54.3 23.0 66.2 39.2 59.8 12.7 26.8 48.2 54.8
BELLUCI, A.A. Avaliação de populações derivadas de híbridos de milho (Zea mays L.) em cruzamentos dialélicos e “top crosses”. Piracicaba, 1994. 131p. Dissertação (Mestrado) - Escola Superior de Agricultura “Luiz de Queiroz”, Universidade de São Paulo.
CARVALHO, R.P.L. Danos, flutuação da população, controle e comportamento de Spodoptera frugiperda (J.E.Smith, 1797) e suscetibilidade de diferentes genótipos de milho, em condições de campo. Piracicaba, 1970. 170p. Tese (Doutorado) - Escola Superior de Agricultura “Luiz de Queiroz”, Universidade de São Paulo.
CASTRO, M.; GARDNER, C.O.; LONNQUIST, J.H. Cumulative gene effects and the nature of heterosis in maize crosses involving genetically diverse races. Crop Science, v.8. p.97–101, 1968.
CRUZ, I. A lagarta do cartucho na cultura do milho. Sete Lagoas: EMBRAPA CNPMS, 1995. 45p. (Circular Técnica 21).
DAVIS, F.M.; NG, S.S.; WILLIAMS, W.P. Visual rating scales for screening whorl-stage corn for resistance to fall armyworm. Mississippi Agricultural and Forestry Experiment Station, 1992. (Technical Bulletin, 186). FORNASIERI FILHO, D.; CASAGRANDE, A.A.; LARA, F.M. Resistência de
cultivares de milho a S. frugiperda. In: CONGRESSO BRASILEIRO DE ENTOMOLOGIA, 6., Campinas, 1980. Resumos. Campinas, CECORT, CATI, 1980. p.142.
GARDNER, C.O.; EBERHART, S.A. Analysis and interpretation of the variety cross diallel and the related populations. Biometrics, v.22, p.439-452, 1966.
GERALDI, I.O.; MIRANDA FILHO, J.B. Adapted models for the analysis of combining ability of varieies in partial diallel crosses. Revista Brasileira de Genética, v.11, p.419–430, 1988.
GUIMARÃES, P.E.; VIANA, P.A. Estudo da herança da resistência de genótipos de milho ao ataque da lagarta do cartucho. Sete Lagoas: EMBRAPA, CNPMS, 1994. p.201-202. (Relatório Técnico Anual).
Table 6 - Estimates of components of the diallel model and their variances and estimates of general combining ability (gi and gj) for RFA, and PH.
HALLAUER, A.R.; MIRANDA FILHO, J.B. Quantitative genetics in maize breeding. 2.ed. Ames: Iowa State University Press, 1995. 468p. LARA, F.M.; OSUNA, J.A.; ABDELNUR JR., O. Comportamento de genótipos
de milho em relação ao ataque de S. frugiperda e H. Zea. Científica, v.12, p.77-83, 1984.
MARQUES, C.A.S.; CAMARGO, O.B.A.; OSUNA, J.A. Avaliação fenotípica de populações de milho, sob condições de seca para os danos de H. Zea e S. frugiperda, e outras características agronômicas. In: CONGRESSO NACIONAL DE MILHO E SORGO, 16., Belo Horizonte, 1988. Anais: EMBRAPA, CNPMS, 1988. p.327-336.
MIRANDA FILHO, J.B. Inbreeding depression and heterosis. In: COORS, J.G.; PANDEY, S. (Ed.) Genetic and exploitation of heterosis in crops. Madison: ASA. 1999. p.69-80.
MIRANDA FILHO, J.B.; GERALDI, I.O. An adapted model for the analysis of partial diallel crosses. Revista Brasileira de Genética, v.7, p.677–688. 1984.
MIRANDA FILHO, J.B.; VENCOVSKY, R. Analisys of diallel crosses among open pollinated varieties of maize (Zea mays L.). Maydica, v.29, p.217-234. 1984.
NISHIKAWA, M.A.N. Análise genética de populações de milho (Zea mays L.) visando resistência à lagarta do cartucho (Spodoptera frugiperda S.). Piracicaba, 1999. 90p. Tese (Doutorado) - Escola Superior de Agricultura “Luiz de Queiroz”, Universidade de São Paulo.
ORTEGA, A.; VASAL, S.K.; MIHM, J.A.; HERSHEY, C. Breeding for insect resistance in maize. In: MAXWELL, F.G.; JENNINGS, P.R. (Ed.). Breeding plants resistant to insects. New Jork: John Wiley and Sons, 1980. p.371-419.
REGITANO NETO, A.; MIRANDA FILHO, J.B. 1999. Incorporation of exotic germplasm of maize. (Zea mays L.). Genetics and Molecular Biology, v.22, p.702, 1999. Supplement.
Resistance to fall armyworm Plant height
Group I vi hi gi vi hi gi
N1 0 .18 1 -0.126 -0.036 -7.23 4.9 3 1.3 2
N2 0 .30 4 -0.117 0 .03 5 -5.98 -1.93 -4.92
N3 -0.543 0 .21 6 -0.056 2.9 4 3.6 8 5.1 4
N4 -0.212 -0.150 -0.256 -13.48 5.3 5 -1.39
N5 -0.049 -0.050 -0.075 -5.48 -1.83 -4.57
N6 0 .34 6 -0.083 0 .09 0 7.8 1 -5.50 -1.59
N7 0 .70 6 -0.237 0.116 -6.61 -0.54 -3.85
N8 -0.214 0 .20 4 0 .09 7 -5.48 -0.26 -3.00
N9 -0.403 0 .16 5 -0.036 0.1 0 -0.68 -0.63
N1 0 -0.058 0 .02 7 -0.003 -6.48 -4.29 -7.53
N11 0 .17 5 -0.099 -0.012 1.3 5 -0.87 -0.20
N1 2 0.117 -0.077 -0.019 48.1 9 -0.72 23.3 7
N1 3 -0.195 0 .24 5 0 .14 8 -4.40 0.2 3 -1.97
N1 4 0 .63 4 -0.253 0 .06 4 -25.98 23.22 10.2 3
N1 5 -0.526 0 .07 8 -0.185 1.7 7 -4.21 -3.32
N1 6 0 .00 3 -0.063 -0.061 -0.44 -4.05 -4.27
N1 7 -0.274 0 .36 1 0 .22 4 11.94 -3.25 2.7 2
N1 8 -0.039 -0.094 -0.114 22.6 9 -4.11 7.2 3
N1 9 0 .22 5 -0.113 0 .00 0 -23.82 -0.45 -12.3 6
N2 0 -0.179 0 .16 7 0 .07 7 8.6 0 -4.72 -0.42
Variance 0.0395 0.0143 --- 24.9 5 9.0 1
---Group II vj hj gj vj hj gj
E1 -0.332 0 .04 9 -0.116 -21.26 -0.85 -11.4 8
E2 -0.267 0 .08 1 -0.052 0.0 8 -9.83 -9.79
E3 -0.006 -0.094 -0.097 -21.17 5.7 9 -4.79
E4 -0.044 0 .04 0 0 .01 8 -4.63 -0.38 -2.70
E5 0 .00 1 -0.150 -0.149 -38.38 8.5 7 -10.6 2
E6 0 .01 8 0 .18 2 0 .19 1 30.2 8 8.7 4 23.8 8
E7 0.112 -0.125 -0.069 35.1 2 -5.92 11.64
E8 0 .44 8 -0.184 0 .04 0 20.6 6 0.0 7 10.4 0
E9 0 .07 0 0 .20 1 0 .23 6 -0.67 -6.21 -6.55
0 .03 7 0.011 --- 23.3 4 7.0 0
---µ 2 .14 5 186.16
d 0 .16 2 0.1 5
SANTOS, M.X.; PACHECO, C.A.P.; GUIMARÃES, P.E.O.; GAMA, E.E.G.; SILVA, A.E.; OLIVEIRA, A.C. Diallel among twenty eight varieties of maize. Revista Brasileira de Genética. v.17, p.277–282, 1994.
SMITH, M.E; MIHM, J.A.; JEWELL, D.C. Breeding for multiple resistance to temperate, subtropical and tropical maize insect pests at CIMMYT. In: TOWARD INSECT RESISTANCE CORN FOR THE THIRD WORLD: INTERNATIONAL SYMPOSIUM ON METODOLOGIES FOR DEVELOPING HOST PLANT RESISTANCE TO CORN INSECTS, México, D.F., 1989. México, D.F.: CIMMYT, 1989. p.222-234.
SOUZA Jr., C.L. Análise de cruzamentos dialélicos e predição de compostos de milho braquítico. Piracicaba, 1981. 102 p. Dissertação (Mestrado) -Escola Superior de Agricultura “Luiz de Queiroz”, Universidade de São Paulo.
SPRAGUE, G.F.; DAHMS, R.G. Development of crop resistance to insects. Journal of Environmental Quality, v.1, p.28–34, 1972.
VENCOVSKY, R.; BARRIGA, P. Genética biométrica no fitomelhoramento. Ribeirão Preto: Sociedade Brasileira de Genética, 1992. 486p. VIANA, P.A.; GUIMARÃES, P.E.O. Maize resistance to the lesser corn stalk
borer and fall armyworm in Brasil. In: INTERNATIONAL SYMPOSIUM: INSECT RESISTANCE MAIZE. RECENT ADVANCES AND UTILIZATION. 1994. Resumos. México:CIMMYT, 1994.
VIANA, P.A.; POTENZA, M.R. Identificação de fontes de resistência de milho a S. frugiperda. In: CONGRESSO BRASILEIRO DE ENTOMOLOGIA, 13., Recife, 1991. p.531. Resumos. Recife: SEB, 1991. v.2, p.530. WIDSTROM, N.W.; BONDARI, K; McMILLIAN, W.W. Heterosis among insect
resistance maize populations. Crop Science, v.3, p.989–994, 1993.
Table 7 - Estimates of components of the diallel model and their variances and estimates of general combining ability (gi and gj) for GY in two experiments.
WIDSTROM, N.W.; WILLIAMS, W.P.; WISEMAN, B.R.; DAVIS, F.M. Recurrent selection for resistance to leaf feeding by fall armyworm on maize. Crop Science, v.32, p.1171-1174, 1992.
WILLIAMS, W.P.; BUCKLEY, P.M.; DAVIS, F.M. Combining ability for resistance in corn to fall army-warm and southwestern corn borer. Crop Science, v.29, p.913-915, 1989.
WILLIAMS, W.P.; BUCKLEY, P.M.; DAVIS, F.M. Combining ability in maize for fall armyworm and southwestern corn borer resistance based on a laboratory bioassay for larval growth. Theoretical and Applied Genetics, v.90, p.275-278, 1995.
WILLIAMS, W.P.; DAVIS, F.M.; SCOTT, G.E. Resistance of corn to leaf-feeding damage by the fall armywarm. Crop Science, v.18, p.861-863, 1978. WISEMAN, B.R; WIDSTROM, N.W. Comparison of methods of infesting
whorl-stage corn with fall army-worm larvae. Journal of Economical Entomolgy v.73, p.440-442, 1980.
WISEMAN, B.R.; WIDSTROM, N.W. Resistance of corn populations to larvae of the corn earworm (Lepdoptera: Noctuidae). Journal of Economical Entomolgy, v.85, p.601-605, 1992.
WISEMAN, B.R.; DAVIS, F.M.; CAMPBELL; J.E. Mechanical Infestation Device used in Fall Armyworm Plant Resistance Programs. Florida Entomologist, v.63, p.87-92, 1980.
Exp 2 Exp 3
Group I vi hi gi vi hi gi
N1 -2044 442 -579 -1162 65 -515
N2 -811 -409 -815 130 -405 -339
N3 343 308 480 -66 38 5
N4 -236 -242 -360 -366 56 -126
N5 1138 -345 223 719 56 416
N6 -518 151 -107 -143 127 55
N7 -333 -7 -174 185 94 187
N8 118 -77 -18 522 -142 119
N9 877 -300 138 259 -273 -143
N10 -78 -209 -248 -506 380 126
N11 -178 343 254 126 8 72
N12 710 -223 131 -51 -345 -371
N13 -997 87 -411 -1006 302 -200
N14 -1653 876 49 -1188 355 -239
N15 218 118 227 -21 55 44
N16 577 -279 9 -329 84 -80
N17 1324 -277 384 1393 -161 534
N18 863 -234 197 1126 -311 252
N19 221 -253 -142 178 -115 -26
N20 457 533 762 200 129 229
Variance 105826 38215 --- 134501 48570
---Group II vj hj gj vj hj gj
E1 -361 79 -101 -222 113 2
E2 736 -123 244 1011 -314 191
E3 -980 674 184 -1137 354 -213
E4 1027 254 768 433 66 282
E5 -1616 409 -399 -829 139 -275
E6 727 -704 -340 -140 44 -25
E7 175 -381 -294 600 -118 181
E8 550 44 319 1066 -158 374
E9 -258 -251 -380 -781 -127 -517
Variance 99018 29705 --- 125849 37755
---µ 3603 2916
d 289 261
h 1051 (29.2%) 822 (28.2%)