Genetic diversity analysis among pigeonpea genotypes adapted
to South American regions based on microsatellite markers
Adna Cristina Barbosa de Sousa
1, Rodolfo Godoy
2, Danilo Augusto Sforça
1, Tatiana de Campos
1,
Maria Imaculada Zucchi
3, Liana Jank
4, Anete Pereira de Souza
1,5*
1
UNICAMP/Centro de Biologia Molecular e Engenharia Genética, C.P. 6010 – 13083-970 – Campinas, SP – Brasil.
2
EMBRAPA Pecuária Sudeste, Rod. Washington Luiz, SP-310 – 13566-684 – São Carlos, SP – Brasil. 3
IAC – Pólo Apta Sul, Rod. SP 127, km 30, C.P. 28 – 13400-970 – Piracicaba, SP – Brasil. 4
EMBRAPA Gado de Corte – Lab. de Biotecnologia de Plantas, C.P. 154 – 79002-970 – Campo Grande, MS – Brasil.
5
UNICAMP/Inst. de Biologia – Depto. de Biologia Vegetal, C.P. 6109 – 13083-970 – Campinas, SP – Brasil. *Corresponding author <[email protected]>
Edited by: Leonardo Oliveira Medici
ABSTRACT: The pigeonpea [Cajanus cajan (L) Millspaugh] is one of the most important perennial legume crops utilized in the food, fodder, soil conservation, crop-livestock integrated systems, reclaiming of degraded pastures and symbiotic nitrogen fixation. Microsatellite markers were used to estimate the genetic diversity of 77 pigeonpea genotypes selected from the germplasm collections at Embrapa Cattle-Southeast and, to evaluate their transferability to Phaseolus vulgaris and Vigna unguiculata species. The number of alleles per locus ranged from 2 to12, with an average of 5.1 alleles. The PIC values ranged from 0.11 to 0.80 (average 0.49) and the D values from 0.23 to 0.91 (average 0.58). The averages of observed and expected heterozygosity were 0.25 and 0.47, respectively, showing a deficit in heterozygosity. A model-based Bayesian approach implemented in the software STRUCTURE was used to assign genotypes into clusters. A dendrogram was constructed based on the modified Roger’s genetic distances using a neighbor-joining method (NJ). A total of four clusters were assembled by STRUCTURE and a strong tendency of correspondence between the Bayesian clusters in the NJ tree was observed. The genetic distance ranged from 0.09 to 0.62 (average 0.37), showing a low genetic diversity in the pigeonpea genotypes. Transferability of pigeonpea-specific microsatellites revealed a cross-amplification and the presence of polymorphic alleles in P. vulgaris and V. unguiculata.
Keywords: legumes, transferability, microsatellite, germplasm
Introduction
Thepigeonpea [Cajanus cajan (L.) Millspaugh] is one
of the most important perennial legume crops in the tropic and subtropic regions of the world. Because of its multiple usages in food, fodder, soil conservation, crop-livestock in-tegrated systems, reclaiming of degraded pastures and sym-biotic nitrogen fixation, the pigeonpea plays an important role in subsistence agriculture (Reddy et al., 2005).
Because of the potential of the pigeonpea as a forage legume, the Brazilian Agricultural Research Corporation (Embrapa Cattle-Southeast, state of São Paulo-SP) has germplasm collections of selected genotypes with desirable agronomic traits such as high yield, quality of forage and
lowest tannin content (Godoy et al., 1995).Over time,the
selected genotypes showed phenotypic segregation in subse-quent generations. Therefore, these genotypes were self-fer-tilized and subsequently selected in order to obtain inbred
lines(Godoy et al., 1994, 1997). Several studies have been
conducted to characterize genotypes and inbred lines of the pigeonpea and provide basic information for breeding. The genetic variability of a partial set of accessions from this col-lection was assessed using Random Amplification of Poly-morphic DNA (RAPD) molecular markers. Results showed low genetic variability and the need to broaden the genetic
base for use in crop-livestock integrated systems and
reclaim-ing degradedpastures (Godoy et al., 2003)
The knowledge of the genetic variability is very impor-tant in for pigeonpea germplasm collections and pigeonpea breeding programs. Microsatellite markers are quite effective for estimating genetic diversity and genetic relationships and in predicting the genetic value of selected genotypes derived from intraspecific crosses and the performance of their hy-brid progenies (Gaitán-Solís et et al., 2002; Varshney et al., 2005). In this study, we used 43 microsatellite markers to evaluate the genetic diversity of 77 pigeonpea selected geno-types from the Embrapa collection. In addition, we studied cross-species amplification in Phaseolus vulgaris L.and Vigna unguiculata L. Walp.
Materials and Methods
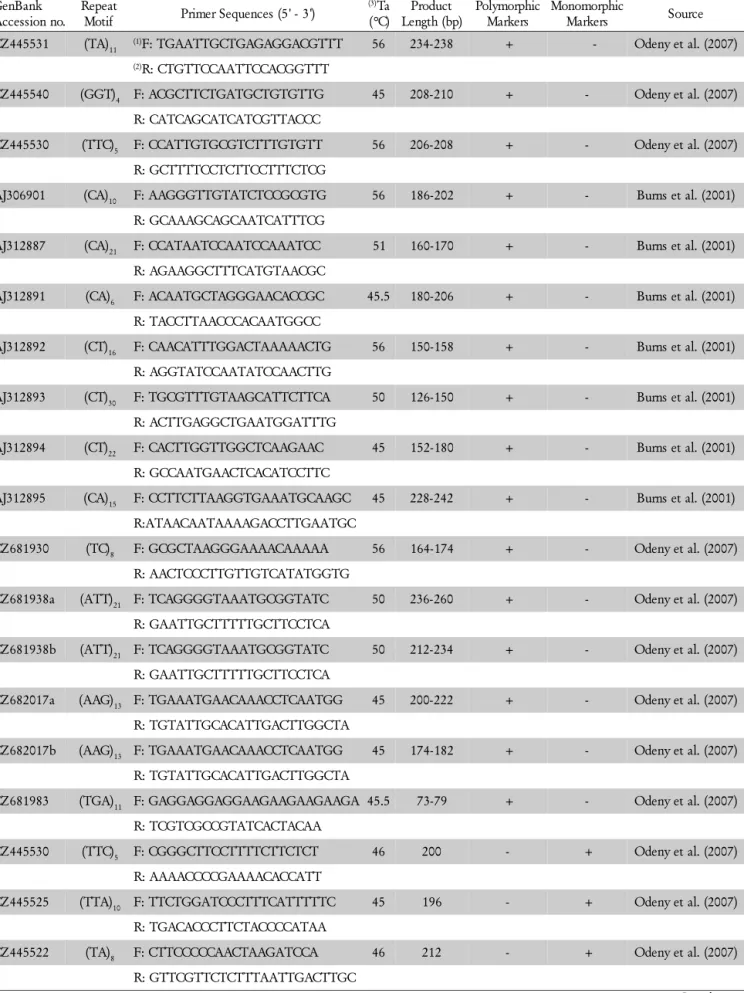
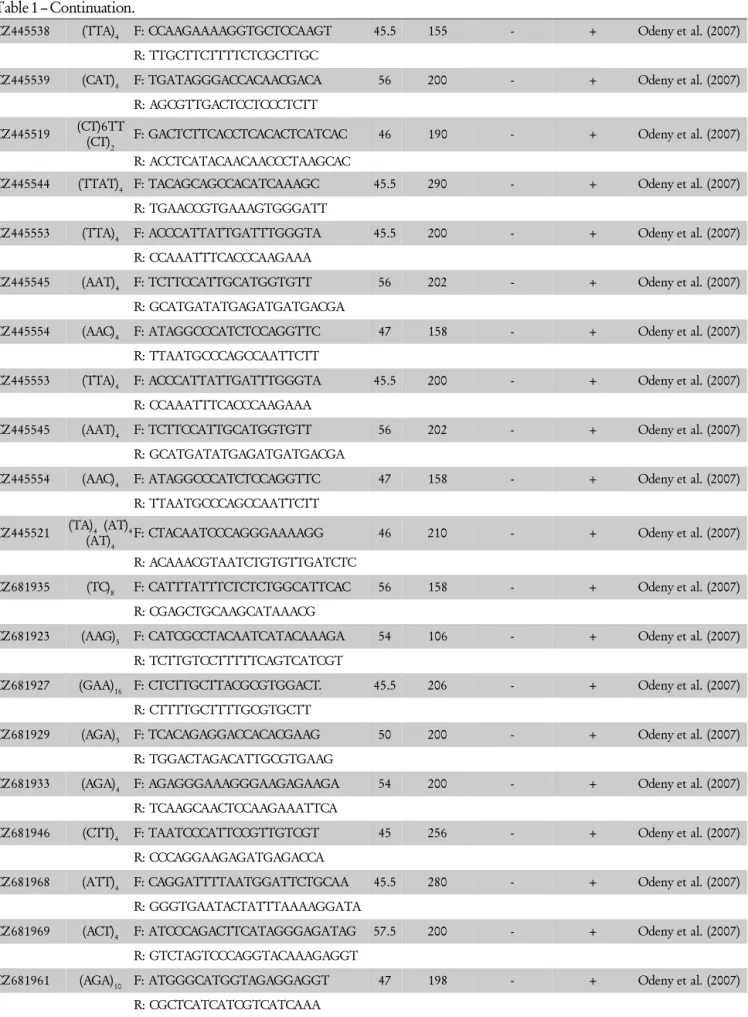
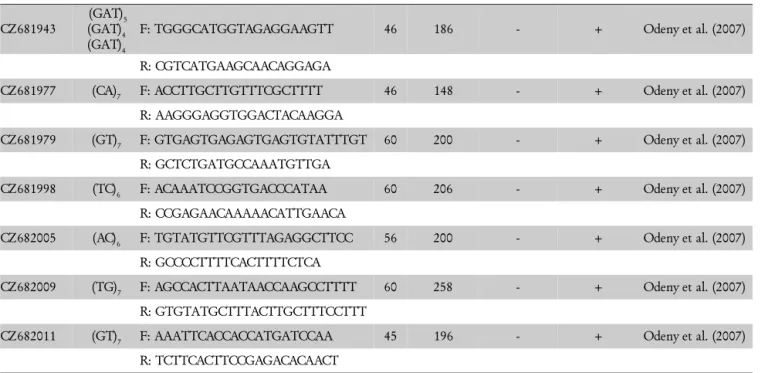
We have selected 43 microsatellite markers described
in the literature (Burns et al., 2001; Odeny et al., 2007)to
analyze 77 pigeonpea genotypes (Table 1) of the Brazil-ian Agricultural Research Corporation (Embrapa Cattle-Southeast) germplasm collection, in São Carlos, SP, Bra-zil. Thirty-nine of them are Brazilian inbred lines, three
are commercial cultivarsand thirty-five came from the
Table 1– Characteristics of 43 pigeonpea microsatellite markers.
Continue...
GenBank Accession no.
Repeat
Motif Primer Sequences (5' - 3')
(3)Ta
(°C)
Product Length (bp)
Polymorphic Markers
Monomorphic
Markers Source
CZ445531 (TA)11 (1)F: TGAATTGCTGAGAGGACGTTT 56 234-238 + - Odeny et al. (2007)
(2)R: CTGTTCCAATTCCACGGTTT
CZ445540 (GGT)4 F: ACGCTTCTGATGCTGTGTTG 45 208-210 + - Odeny et al. (2007)
R: CATCAGCATCATCGTTACCC
CZ445530 (TTC)5 F: CCATTGTGCGTCTTTGTGTT 56 206-208 + - Odeny et al. (2007)
R: GCTTTTCCTCTTCCTTTCTCG
AJ306901 (CA)10 F: AAGGGTTGTATCTCCGCGTG 56 186-202 + - Burns et al. (2001)
R: GCAAAGCAGCAATCATTTCG
AJ312887 (CA)21 F: CCATAATCCAATCCAAATCC 51 160-170 + - Burns et al. (2001)
R: AGAAGGCTTTCATGTAACGC
AJ312891 (CA)6 F: ACAATGCTAGGGAACACCGC 45.5 180-206 + - Burns et al. (2001)
R: TACCTTAACCCACAATGGCC
AJ312892 (CT)16 F: CAACATTTGGACTAAAAACTG 56 150-158 + - Burns et al. (2001)
R: AGGTATCCAATATCCAACTTG
AJ312893 (CT)30 F: TGCGTTTGTAAGCATTCTTCA 50 126-150 + - Burns et al. (2001)
R: ACTTGAGGCTGAATGGATTTG
AJ312894 (CT)22 F: CACTTGGTTGGCTCAAGAAC 45 152-180 + - Burns et al. (2001)
R: GCCAATGAACTCACATCCTTC
AJ312895 (CA)15 F: CCTTCTTAAGGTGAAATGCAAGC 45 228-242 + - Burns et al. (2001)
R:ATAACAATAAAAGACCTTGAATGC
CZ681930 (TC)8 F: GCGCTAAGGGAAAACAAAAA 56 164-174 + - Odeny et al. (2007)
R: AACTCCCTTGTTGTCATATGGTG
CZ681938a (ATT)21 F: TCAGGGGTAAATGCGGTATC 50 236-260 + - Odeny et al. (2007)
R: GAATTGCTTTTTGCTTCCTCA
CZ681938b (ATT)21 F: TCAGGGGTAAATGCGGTATC 50 212-234 + - Odeny et al. (2007)
R: GAATTGCTTTTTGCTTCCTCA
CZ682017a (AAG)13 F: TGAAATGAACAAACCTCAATGG 45 200-222 + - Odeny et al. (2007)
R: TGTATTGCACATTGACTTGGCTA
CZ682017b (AAG)13 F: TGAAATGAACAAACCTCAATGG 45 174-182 + - Odeny et al. (2007)
R: TGTATTGCACATTGACTTGGCTA
CZ681983 (TGA)11 F: GAGGAGGAGGAAGAAGAAGAAGA 45.5 73-79 + - Odeny et al. (2007)
R: TCGTCGCCGTATCACTACAA
CZ445530 (TTC)5 F: CGGGCTTCCTTTTCTTCTCT 46 200 - + Odeny et al. (2007)
R: AAAACCCCGAAAACACCATT
CZ445525 (TTA)10 F: TTCTGGATCCCTTTCATTTTTC 45 196 - + Odeny et al. (2007)
R: TGACACCCTTCTACCCCATAA
CZ445522 (TA)8 F: CTTCCCCCAACTAAGATCCA 46 212 - + Odeny et al. (2007)
Table 1 – Continuation.
Continue...
CZ445538 (TTA)4 F: CCAAGAAAAGGTGCTCCAAGT 45.5 155 - + Odeny et al. (2007)
R: TTGCTTCTTTTCTCGCTTGC
CZ445539 (CAT)4 F: TGATAGGGACCACAACGACA 56 200 - + Odeny et al. (2007)
R: AGCGTTGACTCCTCCCTCTT
CZ445519 (CT)6TT(CT)
2
F: GACTCTTCACCTCACACTCATCAC 46 190 - + Odeny et al. (2007)
R: ACCTCATACAACAACCCTAAGCAC
CZ445544 (TTAT)4 F: TACAGCAGCCACATCAAAGC 45.5 290 - + Odeny et al. (2007)
R: TGAACCGTGAAAGTGGGATT
CZ445553 (TTA)4 F: ACCCATTATTGATTTGGGTA 45.5 200 - + Odeny et al. (2007)
R: CCAAATTTCACCCAAGAAA
CZ445545 (AAT)4 F: TCTTCCATTGCATGGTGTT 56 202 - + Odeny et al. (2007)
R: GCATGATATGAGATGATGACGA
CZ445554 (AAC)4 F: ATAGGCCCATCTCCAGGTTC 47 158 - + Odeny et al. (2007)
R: TTAATGCCCAGCCAATTCTT
CZ445553 (TTA)4 F: ACCCATTATTGATTTGGGTA 45.5 200 - + Odeny et al. (2007)
R: CCAAATTTCACCCAAGAAA
CZ445545 (AAT)4 F: TCTTCCATTGCATGGTGTT 56 202 - + Odeny et al. (2007)
R: GCATGATATGAGATGATGACGA
CZ445554 (AAC)4 F: ATAGGCCCATCTCCAGGTTC 47 158 - + Odeny et al. (2007)
R: TTAATGCCCAGCCAATTCTT
CZ445521 (TA)4 (AT)4
(AT)4 F: CTACAATCCCAGGGAAAAGG 46 210 - + Odeny et al. (2007)
R: ACAAACGTAATCTGTGTTGATCTC
CZ681935 (TC)8 F: CATTTATTTCTCTCTGGCATTCAC 56 158 - + Odeny et al. (2007)
R: CGAGCTGCAAGCATAAACG
CZ681923 (AAG)5 F: CATCGCCTACAATCATACAAAGA 54 106 - + Odeny et al. (2007)
R: TCTTGTCCTTTTTCAGTCATCGT
CZ681927 (GAA)16 F: CTCTTGCTTACGCGTGGACT. 45.5 206 - + Odeny et al. (2007)
R: CTTTTGCTTTTGCGTGCTT
CZ681929 (AGA)5 F: TCACAGAGGACCACACGAAG 50 200 - + Odeny et al. (2007)
R: TGGACTAGACATTGCGTGAAG
CZ681933 (AGA)4 F: AGAGGGAAAGGGAAGAGAAGA 54 200 - + Odeny et al. (2007)
R: TCAAGCAACTCCAAGAAATTCA
CZ681946 (CTT)4 F: TAATCCCATTCCGTTGTCGT 45 256 - + Odeny et al. (2007)
R: CCCAGGAAGAGATGAGACCA
CZ681968 (ATT)4 F: CAGGATTTTAATGGATTCTGCAA 45.5 280 - + Odeny et al. (2007)
R: GGGTGAATACTATTTAAAAGGATA
CZ681969 (ACT)4 F: ATCCCAGACTTCATAGGGAGATAG 57.5 200 - + Odeny et al. (2007)
R: GTCTAGTCCCAGGTACAAAGAGGT
CZ681961 (AGA)10 F: ATGGGCATGGTAGAGGAGGT 47 198 - + Odeny et al. (2007)
Table 1 – Continuation.
CZ681943
(GAT)5 (GAT)4 (GAT)4
F: TGGGCATGGTAGAGGAAGTT 46 186 - + Odeny et al. (2007)
R: CGTCATGAAGCAACAGGAGA
CZ681977 (CA)7 F: ACCTTGCTTGTTTCGCTTTT 46 148 - + Odeny et al. (2007)
R: AAGGGAGGTGGACTACAAGGA
CZ681979 (GT)7 F: GTGAGTGAGAGTGAGTGTATTTGT 60 200 - + Odeny et al. (2007)
R: GCTCTGATGCCAAATGTTGA
CZ681998 (TC)6 F: ACAAATCCGGTGACCCATAA 60 206 - + Odeny et al. (2007)
R: CCGAGAACAAAAACATTGAACA
CZ682005 (AC)6 F: TGTATGTTCGTTTAGAGGCTTCC 56 200 - + Odeny et al. (2007)
R: GCCCCTTTTCACTTTTCTCA
CZ682009 (TG)7 F: AGCCACTTAATAACCAAGCCTTTT 60 258 - + Odeny et al. (2007)
R: GTGTATGCTTTACTTGCTTTCCTTT
CZ682011 (GT)7 F: AAATTCACCACCATGATCCAA 45 196 - + Odeny et al. (2007)
R: TCTTCACTTCCGAGACACAACT
Tropics (ICRISAT) (Table 2). The inbred lines have distinct morphological characteristics such as color of the stem, flow-ers, seeds and pods. These inbred lines were obtained from selfing of genotypes introduced from ICRISAT and have been incorporated to the breeding programs at Embrapa. In addition, cross-amplification evaluations were made using
two other legume species: Phaseolus vulgaris (CAL-143,
IAC-UNA, BAT-93 and JALO-EEP558 varieties) and Vigna
unguiculata (“Fradinho” cultivar), both from the germplasm collection of the Agronomic Institute of Campinas (IAC) (Campinas, SP, Brazil).
Genomic DNA was extracted from freeze-dried leaf samples using the cetyltrimethyl ammonium bromide (CTAB) method with modifications (Faleiro et al., 2003). DNA samples were quantified by comparison with known
quantities of λ phage DNA on a 1% agarose gel.
The PCR was carried out in a total reaction volume of
25 μL containing 0.5 ng of DNA template, 0.8 μM of each
forward and reverse primers, 100 μM of each dNTP (MBI
Fermentas), 1.5 mM MgCl2, 10 mM Tris-HCl, 50 mM KCl
and 0.5 U Taq DNA Polymerase (Invitrogen). AllPCR
am-plifications were performed in a PTC–200 thermal cycler (MJ Research, Waltham, MA/USA) using the following condi-tions: 94ºC for 1 min followed by 30 cycles of 94°C for 1
min, specificannealing temperature for 1 min, 72°C for 1
min, and a final extension of 72°C for 5 min. Amplifica-tion products were genotyped by electrophoresis on 6% de-naturing polyacrylamide gels in 1X TBE buffer using a 10 bp ladder (Invitrogen) as a standard size. The DNA frag-ments were visualized by silver staining according to Creste et al. (2001).
The polymorphism information content (PIC) values
were calculated for estimates of marker informativeness
ac-cording to the equation ofBotstein et al. (1980),
-1
2 2 2
1 1
1
1 2
n
n n
i i j i i j
i
PIC f = = + f f
=
= −
∑ ∑ ∑
−wherefiis the frequency of the ith allele, fj is the frequency of
the jth allele and the summation extends over nalleles. In
order to compare marker efficiencies in varietal identification, the discriminating power (D) was estimated for each primer based on the formula,
1 1 1 1 1 j j k j Np D P N − − = − −
∑
where Nis the number of individuals and pjis the frequency
of the jth pattern (Tessier et al., 1999).
The observed heterozygosity (HO) and the expected
het-erozygosity (HE) were analyzed using the GDA software
(Lewis and Zaykin, 2002).Genetic distance was calculated
from microsatellite marker data using modified Roger’s ge-netic distances. A gege-netic distance matrix was estimated us-ing tools for genetic population analysis (TFPGA v 1.3) (Miller, 1997). Cluster analysis was performed using the neighbor-joining (NJ) method with the DARwin v. 5.0.157
software(Perried and Jacquemound-Collet, 2006). The
reli-ability of the generated dendrogram was also tested by boot-strap analysis using the BooD program with 1000 iterations (Coelho, 2002). The software STRUCTURE version 2.2 (Pritchard et al., 2000) was used to generate a Bayesian infer-ence of the structure of the populations. By this method, a
model of K populations is assumed and samples are
grouped in order to minimize linkage disequilibrium and to maximize conformity to Hardy-Weinberg equilibrium across all analyzed loci. As a preliminary step, analysis was
per-formed a single time for each K value ranging from 2 to 20.
1000replicates for burn-in and 10,000 replicates during
analy-sis. The most probable number of K was calculated based
onEvanno et al. (2005)using an ad hoc statistic ΔK, which
represents the rate of change in log probability of the data
between successive K values rather than the log probability
of the data.
Results and Discussion
Of the 43 microsatellite markers, 16 were polymorphic (Table 3). A total of 83 putative alleles were obtained from the 16 microsatellite markers. The number of alleles ranged from 2 to12, with an average of 5.1 alleles per locus (Table 3). Screening of 77 pigeonpea genotypes with these 16 mark-ers indicated low polymorphism information content. The PIC values ranged from 0.11 to 0.80 with an average of 0.49. The D values ranged from 0.23 to 0.91 with an average of
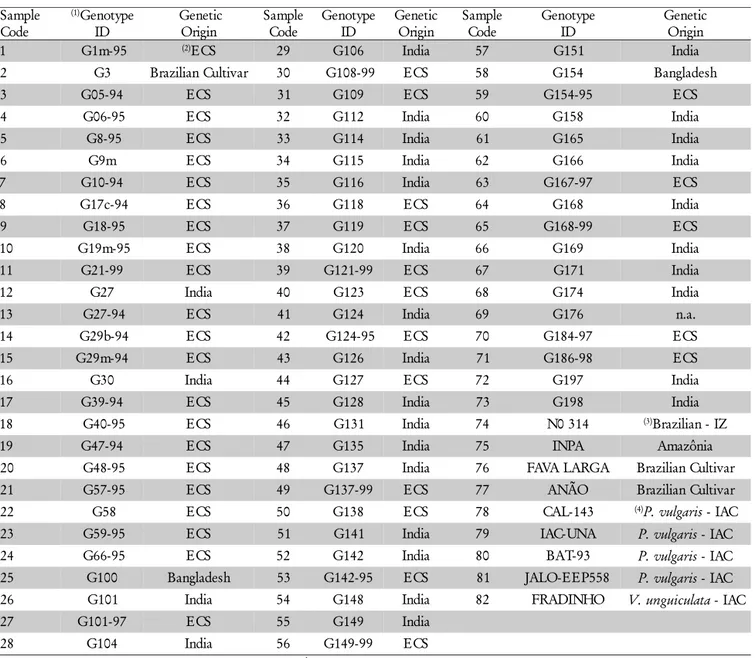
Table 2 – Information of Cajanus cajan, Phaseolusvulgaris and Vigna unguiculata genotypes evaluated with microsatellite markers.
1Genotype ID: Unidade de Execução de Pesquisa de Âmbito Estadual (UEPAE). 2ECS: Embrapa Cattle-Southeast. 3IZ: Institute of Animal Husbandry. 4IAC: Agronomic Institute of Campinas.
Sample Code
(1)Genotype ID
Genetic Origin
Sample Code
Genotype ID
Genetic Origin
Sample Code
Genotype ID
Genetic Origin
1 G1m-95 (2)ECS 29 G106 India 57 G151 India
2 G3 Brazilian Cultivar 30 G108-99 ECS 58 G154 Bangladesh
3 G05-94 ECS 31 G109 ECS 59 G154-95 ECS
4 G06-95 ECS 32 G112 India 60 G158 India
5 G8-95 ECS 33 G114 India 61 G165 India
6 G9m ECS 34 G115 India 62 G166 India
7 G10-94 ECS 35 G116 India 63 G167-97 ECS
8 G17c-94 ECS 36 G118 ECS 64 G168 India
9 G18-95 ECS 37 G119 ECS 65 G168-99 ECS
10 G19m-95 ECS 38 G120 India 66 G169 India
11 G21-99 ECS 39 G121-99 ECS 67 G171 India
12 G27 India 40 G123 ECS 68 G174 India
13 G27-94 ECS 41 G124 India 69 G176 n.a.
14 G29b-94 ECS 42 G124-95 ECS 70 G184-97 ECS
15 G29m-94 ECS 43 G126 India 71 G186-98 ECS
16 G30 India 44 G127 ECS 72 G197 India
17 G39-94 ECS 45 G128 India 73 G198 India
18 G40-95 ECS 46 G131 India 74 N0 314 (3)Brazilian - IZ
19 G47-94 ECS 47 G135 India 75 INPA Amazônia
20 G48-95 ECS 48 G137 India 76 FAVA LARGA Brazilian Cultivar
21 G57-95 ECS 49 G137-99 ECS 77 ANÃO Brazilian Cultivar
22 G58 ECS 50 G138 ECS 78 CAL-143 (4)P. vulgaris - IAC
23 G59-95 ECS 51 G141 India 79 IAC-UNA P. vulgaris - IAC
24 G66-95 ECS 52 G142 India 80 BAT-93 P. vulgaris - IAC
25 G100 Bangladesh 53 G142-95 ECS 81 JALO-EEP558 P. vulgaris - IAC
26 G101 India 54 G148 India 82 FRADINHO V. unguiculata - IAC
27 G101-97 ECS 55 G149 India
28 G104 India 56 G149-99 ECS
0.58. The highest PIC and D values ware found in locus
CZ681938a which contains 8 alleles. The observed (HO) and
expected heterozygosity (HE) values ranged from 0.01 to 0.53
(average 0.25) and 0.01 to 0.82 (average 0.47), respectively, indicating high heterozygote deficiency. The low variability in these collections may be due to a narrow genetic base of the original germplasm collection or pre-selection of these genotypes based on agronomic characteristics, mainly related to the production of dry matter (Godoy et al., 2004).
All polymorphic markers were tested for
cross-amplifica-tion in P. vulgaris (CAL-143, IAC-UNA, BAT-93 and
JALO-EEP558) and V.unguiculata (Fradinho) (Table 4). Thirteen
microsatellite markers (CZ445540, CZ445530, AJ306901, AJ312887, AJ312891, AJ312892, AJ312893, AJ312894, AJ312895, CZ681930, CZ681938a, CZ681938b and CZ681983) amplified in at least one bean species. Six
and CZ681930) were successfully amplified in P. vulgaris and
V. unguiculata, indicating very good transferability. Non-spe-cific amplification of the loci CZ445531, CZ682017a and CZ682017b was observed between species. Eight markers (AJ306901, AJ312891, AJ312892, AJ312893, AJ312894, CZ681930, CZ681938a and CZ681938b) revealed
polymor-phism between the Phaseolus and Vigna genotypes. These
results suggest considerable sequence conservation within the primer regions flanking microsatellite loci. The high level of cross-species amplification and the observed polymorphic al-leles suggest that they can be used for inter- and intraspecific studies. This level of amplification efficiency is similar to that
Table 3 – Characteristics of pigeonpea microsatellite loci, including number of alleles, PIC, D, HO and HE values.
1Number of alleles in pigeonpea. 2PIC - Polymorphism information content. 3D - Discriminating power. 4H
O - Observed heterozygosity. 5H
E - Expected heterozygosity.
GenBank Accession no. (1)Alelle number (2)PIC (3)D (4)H
O
(5)H E
CZ445531 2 0.29 0.36 0.01 0.01
CZ445540 2 0.29 0.35 0.33 0.27
CZ445530 2 0.11 0.23 0.01 0.10
AJ306901 2 0.32 0.41 0.19 0.30
AJ312887 4 0.51 0.62 0.20 0.52
AJ312891 4 0.32 0.43 0.29 0.25
AJ312892 5 0.49 0.56 0.28 0.51
AJ312893 12 0.61 0.72 0.42 0.55
AJ312894 7 0.69 0.73 0.36 0.72
AJ312895 5 0.60 0.75 0.29 0.66
CZ681930 6 0.66 0.78 0.29 0.70
CZ681938a 8 0.80 0.91 0.53 0.82
CZ681938b 8 0.68 0.78 0.32 0.71
CZ682017a 8 0.74 0.82 0.21 0.77
CZ682017b 2 0.26 0.35 0.01 0.01
CZ681983 4 0.48 0.57 0.23 0.54
Average 5.1 0.49 0.58 0.25 0.47
Table 4 – Characteristics of pigeonpea-specific microsatellite markers transferable to Phaseolus vulgaris and Vignaunguiculata.
Alleles observed for each locus are displayed in base pairs (bp). (-) No amplification.
GenBank Accession no. Vigna unguiculata Phaseolus vulgaris
FRADINHO CAL-143 IAC-UNA BAT-93 JALO-EEP558
CZ445531 - - - -
-CZ445540 208/208 208/208 208/208 208/208 208/208
CZ445530 208/208 208/208 208/208 208/208 208/208
AJ306901 200/200 198/198 186/200 200/200 200/200
AJ312887 160/160 - 160/160 160/160 160/160
AJ312891 180/206 206/206 206/206 206/206 206/206
AJ312892 - 154/154 154/156 154/156
-AJ312893 130/130 128/128 128/146 128/146 130/130
AJ312894 166/166 - 166/166 166/166 166/168
AJ312895 242/242 242/242 242/242 242/242 242/242
CZ681930 164/164 166/166 166/166 172/172 164/164
CZ681938a 252/252 260/260 252/252 252/252
-CZ681938b 220/228 228/228 228/228 224/228
-CZ682017a - - - -
-CZ682017b - - - -
observed by Gepts et al. (2008) and Gupta et al. (2008), where chickpea and Azuki bean microsatellite markers were used to amplify DNA from other related legume species such as
Vigna and Phaseolus, respectively.
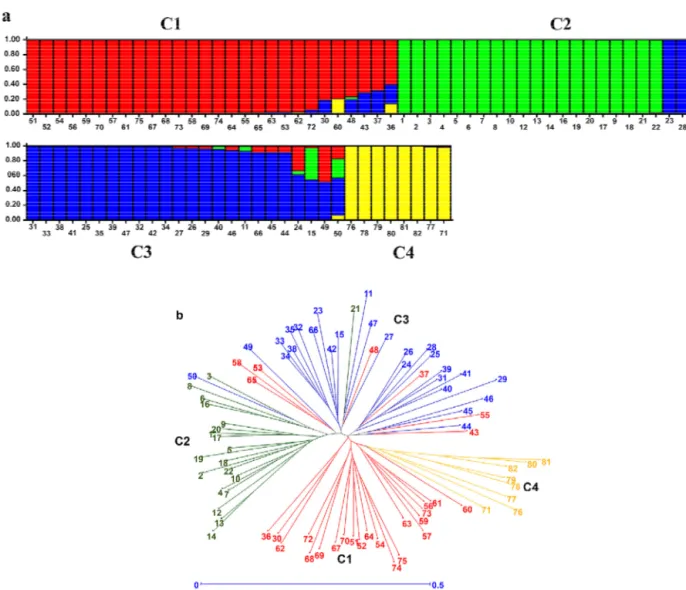
STRUCTURE analysis coupled with computation of
Evanno ΔK statistics suggested a primary partition of
pigeonpea and genotypes of the P. vulgaris and V.
unguiculata into four clusters (K = 4). This analysis can help to identify clusters of genetically similar genotypes. Thus, the subpopulations from the STRUCTURE analysis were
grouped into four clusters (C): C1, C2, C3, and C4(Figure
1a). Cluster C1 is comprised of the 28 pigeonpea genotypes, which were collected in India (G141, G142, G148, G149, G151, G165, G171, G174, G198, G176, NO 314, G168, G149, G166, G197, G158, G137, G126, G119 and G118), Bangladesh (G154) and the Brazilian inbred lines (G154-95, G142-95, G149-99, G184-97, G168-99, G167-97 and
G108-99). Cluster C2 includes 18 pigeonpea Brazilian inbred lines obtained from the breeding program of Embrapa Cattle-Southeast (G1m-95, G05-94, G06-95, G8-95, G9m, G10-94, G17c-94, G19m-95, G27-94, G29b-94, G47-94, G48-95, G39-94, G18-95, G40-G39-94, G57-95 and G58) the cultivar G3-Guandu Mandarim and 2 pigeonpea genotypes from India (G30 and G27). These Brazilian inbred lines were selected for use in crop-livestock integrated systems and reclaiming degraded pastures. The field data confirmed that these geno-types are closely related. Cluster C3 consisted of 26 pigeonpeas, which were collected in India (104, G114, G120, G124, G116, G135, G112, G115, G101, G106, G131, G169 and G128), Bangladesh (G100) and the Brazil inbred lines (G124-95, G121-99, G101-97, G21-99, G137-99, G109, G123, G127, G138, G59-95, G66-95 and G29m-94). Clus-ters C1 and C3 had mixed origins (India, Bangladesh and Brazil inbred lines). These results indicate the presence of
different gene pools among these clusters. Cluster C4 con-tained two pigeonpea cultivars (Fava Larga and Anão), the
inbred line G186-98 and the four varieties of P. vulgaris
(CAL-143, IAC-UNA, BAT-93 and JALO-EEP558) and one
V. unguiculata cultivar (Fradinho).
The phylogenetic NJ tree, which was constructed based on the modified Roger’s genetic distance matrix, was colored according to STRUCTURE results (Figure 1b). Furthermore, a strong tendency of correspondence between the Bayesian clusters in the NJ tree was observed. Clusters C1 and C3
comprised thepigeonpeagenotypes from India, Bangladesh
and some Brazilian inbred lines. Cluster C1 include 18 Bra-zilian inbred lines. Cluster C4 includes the 2 cultivars, the G186-98 Brazilian inbred line of the pigeonpea and all
geno-types of Phaseolus and Vigna. Genotypes of pigeonpea
which were self-fertilized (by controlled pollination, and sub-sequently selected in order to obtain inbred lines) grouped together (G27 and G27-94, G168 and G168-99, G154 and G154-95, G149 and G149-99, G142 and G142-95, G124 and G124-95, G101 and G101-97), except G137 and G137-99.
The pigeonpeagenotypeG137-99 presented a heterozygote
profile. Although pigeonpea is considered an autogamous species, in the presence of pollinators, the cross-pollination can occur, ranging from 3% to 26%. Consequently, a per-centage of heterozygous strains can be observed, even if it is a low percentage (Reddy et al., 2004). The bootstrap value of the center point of the group (82.0%) indicates the ro-bustness of the genetic relationship depicted by the dendro-gram (Figure 1b). The genetic distances among the 77 geno-types of pigeonpea ranged from 0.09 to 0.62 with an aver-age of 0.39. The lower genetic distances were found among the genotypes of cluster C2, such as G06-95 and G9m (0.09). These two genotypes have similar stem color (green) and thickness (10mm) (Godoy et al., 2004; Provazi et al., 2007). The largest genetic distances were found among the geno-types G1m-95 (cluster 2) and G158 (0.62) (cluster 1). Ge-netic distances between clusters C1 and C3 were higher than the C2 cluster revealing moderate diversity among these geno-types. The cultivars Fava Larga and Anão were grouped in a distinct cluster (C4) with 0.42 genetic distance between them. The cluster analysis based on modified Roger’s genetic dis-tances shows the narrowing of the genetic basis among geno-types.
Knowledge of the genetic diversity in germplasm collec-tions is fundamental for further breeding programs to fully exploit existing diversity by genotypes selection. As evident from the clustering of genotypes, it is clear that these microsatellite markers are efficacious. The pigeonpea is an important crop of the Phaseoleae tribe, which has limited genomic resources. As microsatellite markers are highly poly-morphic, reproducible, co-dominant in nature and distrib-uted throughout the genome, they have become the ideal marker system for genetic analysis and breeding applications.
Conclusions
The microsatellite markers revealed low genetic diversity among genotypes of pigeonpea, especially between the Bra-zilian inbred lines selected for use in crop-livestock integrated
systems and reclaiming degraded pastures. The modified Roger’s genetic distances revealed the presence of genetically close genotypes.
Pigeonpea-specific microsatellite markers were transferable to P. vulgaris and V. unguiculata. The transferable loci ex-hibited polymorphism among some genotypes. Transferabil-ity studies of microsatellite loci from other cultures can be highly advantageous.
Acknowledgements
To FAPESP, Project 05/51010-0) and fellowship to Sousa, A. C. B. (06/52953-8), and to CNPq for the fellowship awarded to Souza, A. P.
References
Burns, M.J.; Edwards, K.J.; Newbury, H.J.; Ford-Lloyd, B.V.; Baggott, C.D. 2001. Development of simple sequence repeat (SSR) markers for the assessment of gene flow and genetic diversity in pigeonpea (Cajanus cajan). Molecular Ecology Notes 1: 283-285.
Botstein, D.; White, R.L.; Skolnick, M.; Davis, R.W. 1980. Construction of a genetic linkage map in man using restriction fragment length polymorphisms. American Journal of Human Genetics 32: 314-331.
Coelho, A.S.G. 2002. BooD: assessment of errors associated with estimates of distances/genetic similarities across the bootstrap procedure with variable number of markers. UFG, Goiânia, GO, Brazil (in Portuguese). (CD-ROM).
Creste, S.; Tulmann Neto, A.; Figueira, A. 2001. Detection of single sequence repeat polymorphisms in denaturing polyacrylamide sequencing gels by silver staining. Plant Molecular Biology Reporter 19: 299-306.
Evanno, G.; Regnaut, S.; Goudet, J. 2005. Detecting the number of clusters of individuals using the software STRUCTURE: a simulation study. Molecular Ecology 18: 2611-2620.
Faleiro, F.G.; Faleiro, A.S.G.; Cordeiro, M.C.R. Karia, T.K. 2003. DNA extraction methodology from leaves of native central Brazilian region species to operate molecular analysis. Boletim Técnico da Embrapa Cerrados, Brasília, DF, Brazil 92: 1-5. (in Portuguese). Gaitàn-Solìs, E.; Duque, M.C.; Edwards, K.J.; Tohme, J. 2002.
Microsatellite repeats in common bean (Phaseolus vulgaris): isolation, characterization, and cross-species amplication in
Phaseolus ssp. Crop Science 42: 2128-2136.
Gepts, P.; Francisco, J.L.A.; Everaldo, B.; Matthew, W.B.; Rosana, B.; William, B.; Incoronata, G.; Gina, H.; James, K.; Patricia, L.; Phillip, M.; Maeli, M.; Peter, P.; Andrea, P.H.; Timothy, P.; Federico, S.; Francesa, S.; Kangfu, Y. 2008. Genomics of Phaseolus beans, a major source of dietary protein and micro-nutrients in the tropics. p. 113-143. In: Moore, P.H.; Ming, R., eds. Genomics of tropical crop plants. Springer, NewYork, NY, USA.
Gupta, S.K.; Souframanien, J.; Gopakrishna, T. 2008. Construction of a genetic linkage map of black gram, Vigna mungo (L.) Hepper, based on molecular markers and comparative studies. Genome 51: 628-637.
Godoy, R.; Batista, L.A.R.; Souza, F.H.D.; Primavesi, A.C. 2003. Description of selected Pigeon-pea (Cajanus cajan (L.) Millsp) pure lines. Revista Brasileira de Zootecnia 32: 546-555. (in Portuguese, with abstract in English).
Godoy, R.; Fushita, A.T.; Dübbern De Souza, F.H. 2004. Description of eleven pigeonpea pure lines selected in São Carlos, SP. Revista Brasileira de Zootecnia 33: 2206-2213. (in Portuguese, with abstract in English).
Godoy, R.; Batista, L.A.R.; Negreiros, G.F. 1994. Agronomic evaluation and selection of germplasm of pigeonpea forage (Cajanus cajan
Godoy, R.; Batista, L.A.R.; Negreiros, G.F. 1995. Agronomic evaluation of pigeonpea forage (Cajanus cajan (L.) Millsp). Revista Brasileira de Zootecnia 23: 730-742. (in Portuguese, with abstract in English). Godoy, R.; Batista, L.A.R.; Negreiros, G.F. 1997. Agronomic evaluation and selection of germplasm of pigeonpea forage (Cajanus cajan
(L.) Millsp from the India. Revista Brasileira de Zootecnia 26: 447-453. (in Portuguese, with abstract in English).
Lewis, P.; Zaykin, D. 2002. Genetic Data Analysis (GDA): computer program for the analysis of allelic data: version 1.1 (d12). Available at: http://alleyn.eeb.uconn.edu/gda/. [Accessed Sep. 22, 2009]. Miller, M.P. 1997. Tools for Population Genetic Analysis (TFPGA) 1.3:
A windows program for the analysis of allozyme and molecular population genetic data. (Computer software distributed by author). Odeny, D.A.; Ayashree, B.; Ferguson, M.; Hoisington, D.; Crouch, J.; Gebhardt. 2007. Development, characterization and utilization of microsatellite markers in pigeonpea. Plant Breeding 126: 130-136. Perrier, X.; Jacquemound-Collet, J.P. DARwin software. Available at: http://www.darwin.cirad.fr/darwin. 2006. [Accessed Jul. 12, 2008]. Pritchard, J.K.; Stephens, M.; Donnelly, P. 2000. Inference of population structure using multilocus genotype data. Genetics 155: 945-959. Provazi, M.; Camargo, L.H.G.; Santos, P.M.; Godoy, R. 2007. Botanical description of selected pigeonpea pure lines. Revista Brasileira de Zootecnia 36: 328-334. (in Portuguese, with abstract in English).
Reddy, L.J.; Chandra, S.; Pooni, H.; Branmel, P.J. 2004. Rate of outcrossing in pigeonpea under intercropped conditions. p. 324-502. In: Bramel, P.J., ed. Assessing the risk of losses in biodiversity in traditional cropping systems: a case study of pigeonpea in Andhra Pradesh. International Crops Research Institute for the Semi-Arid Tropics. Patancheru, Andhra Pradesh, India.
Reddy, L.J.; Upadhyaya, H.D.; Gorda, C.L.L.; Sube, S. 2005. Development of core collection in pigeonpea [Cajanus cajan (L.) Millspaugh] using geographic and qualitative morphological descriptors. Genetic Resources and Crop Evolution 52: 1049-1056.
Tessier, C.; David, J.; Boursiquot, P.; Charrieir, A.J.M. 1999. Optimizations of the choice of molecular markers for varietal identification in
Vitis vinifera L. Theoretical and Applied Genetics98: 171-177. Varshney, R.K.; Graner, A.; Sorrells, M.E. 2005. Genic microsatellite
markers in plants: features and applications. Trends Biotechnology 23: 48-55.