Weight of preterm newborns during
the first twelve weeks of life
1Maternidade Odete Valadares, Fundação Hospitalar do Estado de Minas Gerais
and Hospital Universitário, Universidade Federal de Minas Gerais, Belo Horizonte, MG, Brasil
2Departamento de Pediatria, Universidade Federal de Minas Gerais,
Belo Horizonte, MG, Brasil
3Departamento de Estatística, Instituto de Ciências Exatas,
Universidade Federal de Minas Gerais, Belo Horizonte, MG, Brasil
4Maternidade Odete Valadares, Fundação Hospitalar do Estado de Minas Gerais,
Belo Horizonte, MG, Brasil L.M. Anchieta1,
C.C. Xavier2,
E.A. Colosimo3
and M.F. Souza4
Abstract
A longitudinal and prospective study was carried out at two state-operated maternity hospitals in Belo Horizonte during 1996 in order to assess the weight of preterm appropriate-for-gestational-age new-borns during the first twelve weeks of life. Two hundred and sixty appropriate-for-gestational-age preterm infants with birth weight <2500 g were evaluated weekly. The infants were divided into groups based on birth weight at 250-g intervals. Using weight means, somatic growth curves were constructed and adjusted to Count’s model. Absolute (g/day) and relative (g kg-1 day-1) velocity curves were
obtained from a derivative of this model. The growth curve was characterized by weight loss during the 1st week (4-6 days) ranging from 5.9 to 13.3% (the greater the percentage, the lower the birth weight), recovery of birth weight within 17 and 21 days, and increas-ingly higher rates of weight gain after the 3rd week. These rates were proportional to birth weight when expressed as g/day (the lowest and the highest birth weight neonates gained 15.9 and 30.1 g/day, respec-tively). However, if expressed as g kg-1 day-1, the rates were inversely
proportional to birth weight (during the 3rd week, the lowest and the highest weight newborns gained 18.0 and 11.5 g kg-1 day-1,
respec-tively). During the 12th week the rates were similar for all groups (7.5 to 10.2 g kg-1 day-1). The relative velocity accurately reflects weight
gain of preterm infants who are appropriate for gestational age and, in the present study, it was inversely proportional to birth weight, with a peak during the 3rd week of life, and a homogeneous behavior during the 12th week for all weight groups.
Correspondence L.M. Anchieta
Rua Tupis, 426, Apto. 1104 30190-060 Belo Horizonte, MG Brasil
E-mail: [email protected]
Received May 8, 2002 Accepted February 18, 2003
Key words •Premature infants
•Growth curves
Introduction
Preterm neonates are born before matu-ration of the physiological systems that are essential for extrauterine life. Their major problems result from the functional immatu-rity of these systems. One of the roles played by neonatologists and intensive care units is to support these immature systems through health care strategies designed to overcome some of the limitations. These developments in intensive care have led to a significant decrease in neonatal mortality rates, such as 4.6% in the United States (1) and 13.6% in Brazil (2). In the past 30 years, no other medical field has demonstrated such a marked decrease in mortality and morbidity, although the prematurity rate, ranging from 6 to 10% in the United States, has not shown signifi-cant changes in the past 40 years (3).
An essential aspect of neonatal care is growth assessment, since from intrauterine to extrauterine life the maternal nutrition source is interrupted and energy expenditure increases, making it difficult to achieve a positive energy balance sufficient to pro-mote growth.
In addition, it is possible that the intra-uterine growth rate under optimum condi-tions is not an adequate and probably not even an “ideal” parameter for predicting the growth of preterm newborns under adverse clinical conditions.
The study by Dancis et al. (4) is still a reference for the assessment of preterm in-fant growth in current neonatal care. Other studies (5-12) have used several methodolo-gies to evaluate preterm infant growth. The assessment of weight gain dynamics during the first weeks of postnatal life in preterm newborns has provided valuable data (10,13-15).
The objective of the present study was to examine body weight as a growth indicator using a longitudinal and prospective approach to current neonatal care conditions, taking into account the methodological differences
that hamper comparisons between studies, basically because of markedly diverse infant populations and neonatal care changes pri-marily due to developments in nutrition.
Material and Methods
The subjects of this study were appropri-ate-for-gestational-age preterm infants (16) with birth weight <2500 g, born at Odete Valadares Maternity (Hospital Foundation of the State of Minas Gerais) (MOV/ FHEMIG) and at the University Hospital (Federal University of Minas Gerais, HC/ UFMG), from January to December 1996, whose mothers or guardians consented to take part in the study. This investigation was approved by the Medical Ethics Committee of UFMG on May 31st, 1996.
Gestational age was preferentially esti-mated based on information given by the mothers about the date of their last menstrual period, accepted as correct and confirmed, whenever possible, by ultrasonography per-formed before 20 weeks of gestation. When mothers were not sure about the date and no ultrasonography was available, gestational age was confirmed by clinical and neuro-logical examination (17), accepting a differ-ence of as much as two weeks. In the absdiffer-ence of this information, clinical and neurological examinations were used.
Exclusion criteria were congenital infec-tions and/or severe congenital malforma-tions, multiple birth, severe neurological dis-orders, adverse clinical progression prevent-ing measurements or interferprevent-ing with paren-teral and/or enparen-teral nutrition, drug and sub-stance abuse by the mother, enteral nutrition started after the first week of life, and death during the study.
life (12 weeks). The maximum tolerance accepted for these records regarding time was up to three hours of life at birth, ± 1 day on days 3 and 7, and ± 2 days from day 14 to 84. Clinical progression and fluid and en-ergy intake were monitored at the same in-tervals.
Birth weight was recorded in the neona-tal care room by a trained professional (nurse or physician) using a standardized technique. The remaining measurements were made by the researchers in the morning, one hour before the first meal. During outpatient fol-low-up, weight was recorded in the after-noon, always at the same time. Children were weighed naked and scales were cali-brated. If the infant was using an endotra-cheal tube for assisted ventilation and/or venipuncture material, the equipment weight was subtracted based on a previously estab-lished chart. Electronic pediatric scales were used (Filizola Baby scale, São Paulo, SP, Brazil; 15-kg capacity and 5-g sensitivity) and were calibrated every 6 months.
The nutritional recommendations for preterm infants at both hospitals were based on routine nutritional care and were planned to provide a calorie intake of 120-130 cal kg-1
day-1 and a fluid intake of 180-200 ml kg-1
day-1 by the end of the 2nd week of life. The
infants were kept warm in incubators with or without a thermal tunnel and heat loss was estimated, with appropriate adjustments of fluid rates. Parenteral nutrition, when indi-cated, was introduced on the 3rd day of life and babies were weaned when enteral intake was approximately 80 cal kg-1 day-1. The
enteral diet was introduced as early as pos-sible as minimal enteral nutrition, preferably with milk from the baby’s mother. The stan-dardized diets at the hospitals are raw or pasteurized human milk, formulas for term and preterm infants and semi-elemental for-mulas for special cases. During outpatient follow-up, breast-feeding was always the first choice, and relactation was attempted at the institutions for high-risk infants who were
unable to breast-feed for a long period of time. If supplementation or use of artificial milk was necessary due to difficulty in breast-feeding, the mothers were instructed to use term infant formula whenever possible.
Statistical model
Growth may be defined as the process by which the individuals change in size and shape during a certain period of time. This phenomenon is studied by making sequen-tial measurements in the same individual at regular intervals and using serial data to establish behavioral patterns. The longitudi-nal growth data alongitudi-nalysis requires specific statistical methodologies that involve adjust-ment of nonlinear models to the parameters. Adjusting growth curves to longitudinal data involves the description and summary of the growth process with a limited number of parameters. These parameters character-ize the growth pattern and have the same meaning for all individuals, thus allowing comparisons between individuals and groups. The main contribution of the statistical study was to obtain mathematical models representing the behavior of somatic growth and growth velocity data. The Epi Info soft-ware, version 6.0, was used for weight meas-urement analysis by calculating the mean and standard deviation.
The literature reports some mathematical models to explain the behavior of growth curves. Hauspie (18) published an excellent review of these models, and some models were selected from his study bearing in mind simplicity and constant use in problems such as the following:
1a. Second order polynomial: y = b0 + b1
*time + b2 *time2
1b. Third order polynomial: y = b0 + b1 *time
+ b2 *time2 + b3 *time3
2. Logistic: y = p + alpha
3. Monomolecular (Jenss-Baykey): y = alpha + p *time - exp(b0 + b1 *time)
4. Count: y = alpha + p *time + b0
*LN(time + 1)
The regression models cited above were adjusted by the least squares method using statistical software (SPSS). Observe that models 2 and 3 have nonlinear parameters and require special routines to be adjusted, whereas models 1a, 1b and 4 have linear parameters and routines for their adjustment are available in all statistical softwares and Excel worksheets. Parameters were estimated considering all sampling values as well as only the means of each recording time.
All predicted curves closely followed the observed curves. However, only Count’s curve demonstrated a decrease in the second reading time (3 days), as shown in Figure 1. A numerical criterion extensively used to discriminate nonlinear regression models is the adjusted coefficient of determination (R2
A) (19) expressed as follows:
2 2
A
n-1
R =1- (1-R ) n-p
where n: sample size, p: number of model parameters, R2: adjusted coefficient of deter-mination by least squares.
Count’s model showed the best behavior according to this criterion, and was chosen based on its strengths: it satisfactorily fol-lows the behavior observed in growth curves, and it was the only model that decreased at the second recording time (3 days); it is easy to estimate because it has linear parameters; it has the best performance according to the numerical criterion (predicted value close to the observed value).
To assess weight gain velocity, a funda-mental clinical aspect in monitoring and un-derstanding preterm infant growth dynam-ics, two analyses were used in the present study: absolute velocity, i.e., daily weight
gain, and relative velocity, or daily weight gain/kg weight.
Absolute velocity was calculated based on the mathematical equation derivative of the model, which explains the behavior of longitudinal weight data. Therefore, for Count’s model we have:
growth rate = p b0 time 1 +
+
Using the estimated values, velocity curves were obtained for the seven catego-ries.
Results
Of 270 infants included in the study 260 were followed-up (loss of 3.7%); 179 (68.8%) of the 260 neonates were born at MOV/ FHEMIG. The distribution of infants by sex showed a slight predominance of males, i.e., 137 (52.7%).
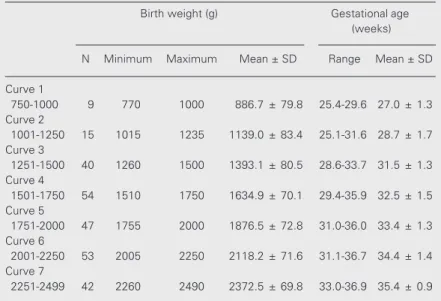
A weight development curve was con-structed for each of the seven birth weight categories the preterm infants were divided into. Table 1 shows the upper and lower limits and mean weight and gestational age at birth. Weekly mean weight values were used to construct the curves for longitudinal analy-sis of weight development of preterm infants who were appropriate for gestational age showing weight and chronological age. Count’s model was applied, as demonstrated in Figure 2. Growth dynamics is shown in a clear-cut manner and weight loss, stabiliza-tion and gain of all curves are graphically similar.
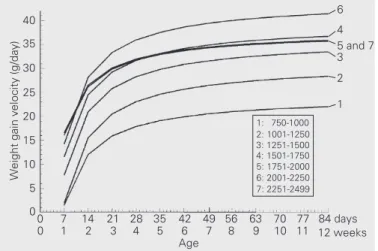
(curve 6) gained virtually twice the weight as the small ones (curve 1) along the follow-up period (for instance, weight gain was 33.3 and 15.9 g/day for infants in curves 6 and 1, respectively, during the 3rd week, and 41.4 and 22.1 g/day for the same curves during week 12).
Figure 4 presents mean weight gain ve-locity as g kg-1 day-1, showing a marked
increase from the 1st to the 4th week (up to the 3rd week) in all seven curves. Neverthe-less, curves 1 and 2 present gains of 17.9 and 18.1 g kg-1 day-1, respectively, during the 3rd
week, and curve 7 shows a gain of 11.5 g kg-1 day-1. Later there was a drop, and at the
end of the follow-up period, by week 12, weight gain was 10.2 g kg-1 day-1 in curve 1,
and 7.5 g kg-1 day-1 in curve 7. Note that
curves 1 and 2 are overlapping, showing a closely similar weight gain in g kg-1 day-1
between the two infant categories.
Another way to evaluate growth dynam-ics is to consider the somatic growth and weight gain velocity (g kg-1 day-1) curves
when observed in relation to corrected age. As an example, Figure 5 shows the curves for the smallest newborns (curve 1) and for the largest newborns (curve 7). Adequate-for-gestational-age newborns for curve 1 pre-sented a mean gestational age of 27 weeks at birth, and those for curve 7 presented a mean gestational age at birth of 35 weeks. The newborns of curve 1 had a higher weight gain velocity per kg compared to the larger newborns and that later the smaller new-borns tended to approximate and reach the weight of the larger newborns.
Figure 6 illustrates the growth dynamics for all the birth weight categories of ad-equate-for-gestational-age preterm new-borns, showing that weight gain velocity, when expressed as g kg-1 day-1, is inversely
proportional to birth weight. There was a clear trend for lower birth weight infants to approximate and reach the weight of larger newborns, in agreement with literature data (20-22).
With respect to nutritional support, it can be seen that the newborns of curve 1 only reached a mean calorie intake of 120 cal kg-1
day-1 (23,24) starting at six weeks of life
(42nd day), those of curve 2 did so after five weeks (35th day), those of curve 3 after three weeks (21st day), and those of curve 4 after two weeks (14th day). The newborns of curve 5 were already feeding on demand (understood here as ingestion of the enteral diet controlled by the wish and need of the newborn itself) during the second week of life, and those of curves 6 and 7 did so during the first week of life. In addition, the begin-ning of the enteral diet was more delayed the lower the birth weight, with a median of 5 days for the newborns of curves 1 and 2, of 3 days for those of curve 3, of 2 days for those of curve 4, and of 1 day for those of curves 5, 6 and 7. The median time of use of parenteral nutrition ranged from 5 to 14 days and its beginning ranged from 3 to 5 days of life for the various curves.
Discussion
Count’s model demonstrated growth dy-namics in a clear manner, indicating a period of weight loss during the 1st week of life (5-6 days) for all curves, a birth weight recovery period between the 2nd and 3rd week (17-24 days), followed by a weight gain period. Somatic growth dynamics was graphically similar for all infant categories (Figure 2). The weight development of appropriate-for-gestational-age preterm infants in this study was similar to that described by most authors (5-12) for preterm infants with no intrauter-ine growth retardation with respect to the biphasic nature of the weight curve, time and duration of the initial weight loss and effect of birth weight on weight gain.
4000 Weight (g) 2500 3000 2000 1500 1000
0 3 7 14 21 28 35 42 49 56 63 70 77 84 days
0 1 2 3 4 5 6 7 8 9 10 11 12 weeks
Age
Observed mean for the 7 strata
2nd order polynomial 3rd order polynomial Monomolecular (Jenss-Baykey) Count
3500
Figure 1. Comparison of the mathematical models evaluated in terms of the observed mean.
Predicted values of the models:
Figure 4. Mean daily weight gain velocity per kg (g kg-1 day-1) of
ad-equate-for-gestational-age preterm newborns by birth weight category.
Weight gain velocity (g kg
-1 day -1) 20
18 16 10 8 0 14 12 6 4 2
0 7 14 21 28 35 42 49 56 63 70 7784 days
0 1 2 3 4 5 6 7 8 9 10 1112 weeks
Age
1 and 2
6 4 3 7 5 1: 750-1000 2: 1001-1250 3: 1251-1500 4: 1501-1750 5: 1751-2000 6: 2001-2250 7: 2251-2499
Figure 2. Mean weight of preterm newborns by birth weight category adjusted by the method of Count.
0 3 7 14 21 28 35 42 49 56 63 70 77 84 days
0 1 2 3 4 5 6 7 8 9 10 11 12 weeks
Age
6 and 7
5 4 3 2 1 Weight (g) 4500 4000 3500 3000 2500 2000 1500 1000 500 1: 750-1000 2: 1001-1250 3: 1251-1500 4: 1501-1750 5: 1751-2000 6: 2001-2250 7: 2251-2499
Weight gain velocity (g/day)
40
5 and 7 35 30 25 20 15 10 5 0 3 4 6 2 1
0 7 14 21 28 35 42 49 56 63 70 77 84 days
0 1 2 3 4 5 6 7 8 9 10 11 12 weeks
Age 1: 750-1000 2: 1001-1250 3: 1251-1500 4: 1501-1750 5: 1751-2000 6: 2001-2250 7: 2251-2499
Figure 3. Mean daily weight gain velocity (g/day) of preterm newborns by birth weight category.
Figure 5. Growth dynamics of adequate-for-gestational-age preterm new-borns (curves 1 and 7): somatic growth and velocity with respect to corrected age.
Figure 6. Growth dynamics of adequate-for-gestational-age preterm newborns: somatic growth and velocity with respect to corrected age.
1: 750-1000 2: 1001-1250 3: 1251-1500 4: 1501-1750 5: 1751-2000 6: 2001-2250 7: 2251-2499
Somatic growth (weight, g)
6200 20
Velocity (g kg
-1 day -1) 5400 4600 3800 3000 2200 1400 600 15 10 5 0
27 29 31 33 35 37 39 41 43 45 47
Corrected age (weeks)
1 2 34
5 6 7
Somatic growth (weight, g)
6200 20
Velocity (g kg
-1 day -1) 5400 4600 3800 3000 2200 1400 600 15 10 5 0
27 29 31 33 35 37 39 41 43 45 47
Corrected age (weeks)
1: 750-1000 g 7: 2251-2499 g
1
the present paper reported weight gain ve-locity curves.
Mean daily weight gain velocities (Fig-ure 3) were proportional to birth weight, that is, the larger the infants, the greater the mean weight gain velocities (g/day), and these in-fants gained practically twice the weight gained by smaller infants in g/day. When clinical progression is efficient, there is a marked speeding up from the 1st to the 2nd week of life and, later on, a gradual increase up to week 7, after which weight gain becomes stable. It is important to carefully interpret these velocity curves in order not to have a false impression of little weight gain by smaller infants when compared with larger ones.
The mean weight gain velocities in g kg-1
day-1 (Figure 4) were inversely proportional
to birth weight, and greater in lower birth weight babies. Speeding up of this rate was observed within the first four weeks of life, with a maximum peak on the 3rd week. Therefore, this is the period of greater weight gain. It is interesting to note that this type of growth dynamics, i.e., growth recovery, might not be perceived when the somatic growth curve is used to monitor weight gain. How-ever, this is the critical growth period, when the clinician should be aware of the nutri-tional management of preterm infants.
When comparing somatic growth (Figure 2) and its respective relative velocity (Figure 4), we observed that the group of smaller children at birth (curve 1), with a mean weight loss of 13.3%, presented a recovery dynamics with a higher relative velocity peak, gaining 18 g kg-1 day-1 (Figure 4). It is clear
that the highest birth weight group (curve 7), which was also the group of neonates that lost less weight (5.9%), had the lowest rela-tive weight gain peak (11.5 g kg-1 day-1).
Certainly, due to their birth weight, gesta-tional age and clinical progression, their growth dynamics was closer to that of term infants (20). Yet, on the 12th week, there was a converging movement of all curves, with weight gain ranging from 10.2 g kg-1
day-1 to 7.5 g kg-1 day-1 in the lower or higher
weight categories, respectively, and low birth weight infants tended to get closer to and achieve the weight of larger infants, as also reported in the literature (20-22).
For the younger gestational age groups (lower birth weight) the first weeks of post-natal life seem to be the period of expression of their own growth recovery dynamics. The catch-up growth in this study was demon-strated by the characteristics of relative weight gain velocity (g kg-1 day-1). Some
studies (20-22) have demonstrated the oc-currence of this catch-up growth up to the first months after the predicted date of deliv-ery, i.e., 40 weeks of corrected age.
It is important to observe that weight category stratification is compatible with the objective of demonstrating growth dynam-ics among preterm infants with birth weight ranging from 750 to 2499 g. Nonetheless, the groups thus composed could present graphically distinct results, such as velocity curve 6 higher than curve 7, curve 4 higher than curve 5, and curve 7 overlapping curve 5 (Figure 3) due to individual and clinical progression characteristics. Similar findings
Table 1. Distribution of adequate-for-gestational-age preterm newborns by weight category and gestational age at birth.
Birth weight (g) Gestational age
(weeks)
N Minimum Maximum Mean ± SD Range Mean ± SD
Curve 1
750-1000 9 770 1000 886.7 ± 79.8 25.4-29.6 27.0 ± 1.3
Curve 2
1001-1250 15 1015 1235 1139.0 ± 83.4 25.1-31.6 28.7 ± 1.7
Curve 3
1251-1500 40 1260 1500 1393.1 ± 80.5 28.6-33.7 31.5 ± 1.3
Curve 4
1501-1750 54 1510 1750 1634.9 ± 70.1 29.4-35.9 32.5 ± 1.5
Curve 5
1751-2000 47 1755 2000 1876.5 ± 72.8 31.0-36.0 33.4 ± 1.3
Curve 6
2001-2250 53 2005 2250 2118.2 ± 71.6 31.1-36.7 34.4 ± 1.4
Curve 7
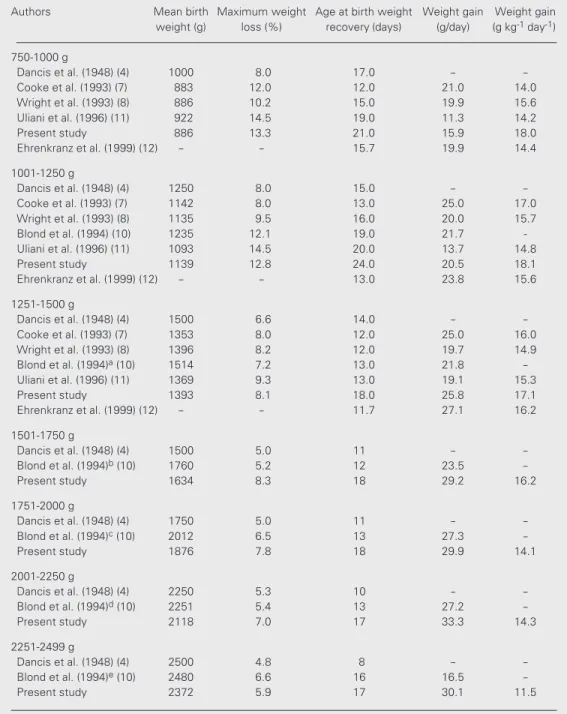
Table 2. Weight gain dynamics of preterm newborns.
Authors Mean birth Maximum weight Age at birth weight Weight gain Weight gain
weight (g) loss (%) recovery (days) (g/day) (g kg-1 day-1)
750-1000 g
Dancis et al. (1948) (4) 1000 8.0 17.0 -
-Cooke et al. (1993) (7) 883 12.0 12.0 21.0 14.0
Wright et al. (1993) (8) 886 10.2 15.0 19.9 15.6
Uliani et al. (1996) (11) 922 14.5 19.0 11.3 14.2
Present study 886 13.3 21.0 15.9 18.0
Ehrenkranz et al. (1999) (12) - - 15.7 19.9 14.4
1001-1250 g
Dancis et al. (1948) (4) 1250 8.0 15.0 -
-Cooke et al. (1993) (7) 1142 8.0 13.0 25.0 17.0
Wright et al. (1993) (8) 1135 9.5 16.0 20.0 15.7
Blond et al. (1994) (10) 1235 12.1 19.0 21.7
-Uliani et al. (1996) (11) 1093 14.5 20.0 13.7 14.8
Present study 1139 12.8 24.0 20.5 18.1
Ehrenkranz et al. (1999) (12) - - 13.0 23.8 15.6
1251-1500 g
Dancis et al. (1948) (4) 1500 6.6 14.0 -
-Cooke et al. (1993) (7) 1353 8.0 12.0 25.0 16.0
Wright et al. (1993) (8) 1396 8.2 12.0 19.7 14.9
Blond et al. (1994)a (10) 1514 7.2 13.0 21.8
-Uliani et al. (1996) (11) 1369 9.3 13.0 19.1 15.3
Present study 1393 8.1 18.0 25.8 17.1
Ehrenkranz et al. (1999) (12) - - 11.7 27.1 16.2
1501-1750 g
Dancis et al. (1948) (4) 1500 5.0 11 -
-Blond et al. (1994)b (10) 1760 5.2 12 23.5
-Present study 1634 8.3 18 29.2 16.2
1751-2000 g
Dancis et al. (1948) (4) 1750 5.0 11 -
-Blond et al. (1994)c (10) 2012 6.5 13 27.3
-Present study 1876 7.8 18 29.9 14.1
2001-2250 g
Dancis et al. (1948) (4) 2250 5.3 10 -
-Blond et al. (1994)d (10) 2251 5.4 13 27.2
-Present study 2118 7.0 17 33.3 14.3
2251-2499 g
Dancis et al. (1948) (4) 2500 4.8 8 -
-Blond et al. (1994)e (10) 2480 6.6 16 16.5
-Present study 2372 5.9 17 30.1 11.5
Weight range: a1375-1625 g; b1625-1875 g; c1875-2125 g; d2125-2375 g; e2375-2625 g. The number after
the year of each citation identifies its position in the reference list. The present study was carried out from January to December 1996.
were also observed for velocity curves in g kg-1 day-1 (Figure 4).
When postnatal progression of preterm infants is studied, several variables limit com-parison of different groups of children, among
other published studies, as demonstrated in Table 2.
In our study, infants with a birth weight range of 750-1000 g, 1001-1250 g and 1251-1500 g (although the samples for the first two categories were quite small) presented a mean birth weight similar to that of other studies. However, despite the fact that their weight loss percentage was similar to that of other studies, the subjects took longer to recover their birth weight. The mean caloric intake of these infants was low compared to the current recommendations of energy sup-ply (23,24), and this reduction might be re-lated to later introduction of enteral nutrition which was slowly and gradually increased, and to a possible clinical instability of the infants, making their nutritional management difficult.
The infants with birth weight within the 1501-1750 g and 1751-2000 g ranges pre-sented mean birth weights close to those of other studies, and these newborns also took longer to recover their birth weight, and regained weight at the hospital. However, their weight loss rate was similar to that of other reports. Although an enteral diet was introduced earlier, the infants achieved an adequate energy supply only as of the 2nd week of life, and this fact might be associ-ated with a more gradual increase in diet or clinical instability of infants during the first two weeks of life.
For infants with birth weight between 2001-2250 g and 2251-2499 g the weight
loss rate was similar to that reported in other studies, but the mean time to achieve birth weight was longer than in other studies. An enteral diet was introduced early, with an appropriate energy supply as of the first week. It is important to highlight that for both weight categories, by the 14th day of life 50% of the infants were followed at outpatient clinics, and consequently their growth was also determined by other vari-ables, such as socioeconomic factors. Fur-thermore, the infants who were kept hospi-talized, and who were possibly ill, presented a lower growth rate.
We conclude that relative velocity better describes the weight dynamics of preterm infants, mainly of those with lower birth weight. The present study provides informa-tion on relative weight gain velocity which, if expressed as g kg-1 day-1, was inversely
proportional to birth weight, demonstrating that lower birth weight infants gained more weight, and the velocity peak in all birth weight categories occurred during the 3rd week of life.
The growth curves presented here should not be considered to be optimal. The results obtained apply to the population studied; however, these curves could be useful to better understand the postnatal growth of preterm newborns, to identify factors that interfere with growth (mainly the attention that should be paid to the nutritional man-agement of these newborns), and to contri-bute to future studies.
References
1. Arias E & Smith BL (2003). Deaths: Preliminary Data for 2001. National Vital Statistics Report. National Center for Health Statis-tics, Hyattsville, MD, USA, 51 (5).
2. Ministério da Saúde (2003). http://www.datasus.gov.br. Accessed March 25, 2003.
3. Kipikasa J & Bolognese RJ (1997). Obstetric management of pre-maturity. In: Fanaroff PA & Martin RJ (Editors), Neonatal; Perinatal Medicine Diseases of the Fetus and Infant. 6th edn. Mosby, St. Louis, MO, USA, 264-284.
4. Dancis J, O’Connell JR & Holt LE (1948). A grid for recording the
weight of premature infants. Journal of Pediatrics, 33: 570-572. 5. Brosius KK, Ritter DA & Kenny JD (1984). Postnatal growth curve of
the infant with extremely low birth weight who was fed enterally. Pediatrics, 74: 778-782.
6. Fenton TR, McMillan DD & Sauve RS (1990). Nutrition and growth analysis of very low birth weight infants. Pediatrics, 86: 378-383. 7. Cooke RJ, Ford A, Werkman, S, Conner C & Watson D (1993).
Postnatal growth in infants born between 700 and 1,500 g. Journal of Pediatric Gastroenterology and Nutrition, 16: 130-135.
postnatal growth grids for very low weight infants. Pediatrics, 91: 922-926.
9. Itabashi K, Takeuchi T, Hayashi T, Okuyama K, Kuriya N & Otani Y (1994). Postnatal reference growth curves for very low birth weight infants. Early Human Development, 37: 151-160.
10. Blond MH, Gold F, Kadiry LA, Rondeau C, Marchand S & Guérois M (1994). Croissance pondérale post natale du prématuré: on peut continuer à utilisier les courbes de référence de Dancis (1948). Archives de Pédiatrie, 1: 1079-1084.
11. Uliani ACCA, Carvalho R & Barros Filho AA (1996). Evolução ponderal de recém-nascidos de muito baixo peso. Jornal de Pediatria, 72: 388-393.
12. Ehrenkranz RA, Younes N, Lemons JA et al. (1999). Longitudinal growth of hospitalized very low birth weight infants. Pediatrics, 104: 280-289.
13. Greco L, Capasso A, De Fusco C & Paludetto R (1990). Pulsatile weigth increases in very low birthweight babies appropriate for gestational age. Archives of Disease in Childhood, 65: 373-376. 14. Ozkan H, Uguz A & Haberal S (1997). Postnatal weight velocity
patterns in very low birthweight infants. Indian Journal of Pediatrics, 64: 383-388.
15. Pauls J, Bauer K & Versmold H (1998). Postnatal body weight curves for infants below 1,000 g birth weight receiving early enteral and parenteral nutrition. European Journal of Pediatrics, 157: 416-421. 16. Lubchenco LO, Hansman C, Dressler M & Boyd E (1963).
Intrauter-ine growth as estimated from liveborn birth-weight data at 24 to 42
weeks of gestation. Pediatrics, 32: 793-800.
17. Ballard JL, Khoury JC, Wedig K, Wang L, Eilers-Walsman BL & Lipp R (1991). New Ballard score, expanded to include extremely prema-ture infants. Journal of Pediatrics, 119: 417-423.
18. Hauspie RC (1989). Mathematical models for the study of individual growth patterns. Revue d’Epidemiologie et de Santé Publique,37: 461-476.
19. Draper NR & Smith H (1981). Applied Regression Analysis. 2nd edn. Wiley, New York.
20. Brandt I (1986). Growth dynamics of low-birth-weight infants with emphasis on the perinatal period. In: Falkner F & Tanner JM (Edi-tors), Humam Growth. 2nd edn. Plenum Press, New York, 415-475. 21. Altigani M, Murphy JF, Newcombe RG & Gray OP (1989). Catch up growth in preterm infants. Acta Paediatrica Scandinavica. Supple-ment, 357: 3-19.
22. Xavier CC, Abdallah VOS, Silva BR, Mucillo G, Jorge SM & Barbieri MA (1995). Crescimento de recém-nascidos pré-termo. Jornal de Pediatria,71: 22-27.
23. American Academy of Pediatrics Committee on Nutrition (1985). Nutritional needs of low-birth-weight infants. Pediatrics, 75: 976-986.