i
ANA PAULA BORONI MOREIRA
EFEITOS DO CONSUMO DE AMENDOIM COM
DIFERENTES TEORES DE ÁCIDO GRAXO OLÉICO NA
PERMEABILIDADE INTESTINAL E ENDOTOXEMIA EM
HOMENS COM EXCESSO DE PESO
VIÇOSA
MINAS GERAIS - BRASIL
2013
Dedico
aos meus amados pais, Vicente e Rita, e aos meus
AGRADECIMENTOS
A Deus por tornar tudo possível.
À Universidade Federal de Viçosa e ao Departamento de Nutrição e Saúde, pela oportunidade de realização da graduação, mestrado e doutorado.
À Coordenação de Aperfeiçoamento de Pessoal de Nível Superior (CAPES), pela concessão da bolsa de doutorado, à Fundação de Amparo à Pesquisa do Estado de Minas Gerais (FAPEMIG) e ao Conselho Nacional de Desenvolvimento Científico e Tecnológico (CNPq), pelo financiamento do projeto de pesquisa.
Ao Peanut Institute pelo valoroso convênio que possibilitou a realização dessa pesquisa.
À minha querida orientadora Profª. Rita de Cássia Gonçalves Alfenas, pela confiança em me acolher como sua orientanda, atenção, carinho, apoio e pelas preciosas oportunidades de crescimento pessoal e profissional.
À Profª. Maria do Carmo Gouveia Peluzio, que muito contribuiu na minha formação durante o mestrado e para meu ingresso no doutorado. Obrigada por todo o apoio ao longo desses anos e pelo grande empenho na realização das análises.
À Profª. Neuza Maria Brunoro Costa, pela parceria, sugestões tão oportunas ao longo da pesquisa e participação na banca de qualificação.
Ao Prof. Leandro Licursi de Oliveira, pela atenção, orientação quanto à metodologia para análise do lipopolissacarídeo e pela participação na banca de doutorado.
Ao Prof. Richard Mattes, da Purdue University, pela oportunidade e preciosas contribuições para o enriquecimento do trabalho.
À Profª. Regiane Lopes de Sales, pela amizade, por compartilhar experiências do Projeto Amendoim e participação na banca de doutorado
À Profª. Eliene da Silva Martins Viana, pela participação na banca de doutorado.
Ao Prof. Łukasz Grześkowiak, pela prontidão e ensinamentos proferidos sobre microbiota intestinal.
À Profª. Angela Aparecida Barra, por gentilmente ter aceitado participar como suplente da banca de doutorado.
À Alessandra Barbosa Ferreira Machado, pelo carinho e apoio.
Ao Eduardo Pereira, pelo valioso auxílio nas análises de permeabilidade intestinal.
Aos demais professores e funcionários do Departamento de Nutrição e Saúde pelos ensinamentos e colaborações.
À equipe do Laboratório de Análises Clínicas, em especial ao Alexandre Azevedo Novello, e aos técnicos do setor de diagnóstico por imagem, Wanderson Luís Batista, Divino Paulo de Carvalho e Daniela Almeida Duarte, pelos serviços prestados e por serem tão amáveis e receptivos.
À Fundação Ezequiel Dias pela avaliação da qualidade dos amendoins quanto à presença de aflatoxinas.
À técnica de enfermagem, Maria Aparecida Viana Silva, pelo compromisso, carinho e ótimo trabalho.
Aos voluntários, por terem permitido que essa pesquisa acontecesse.
À Raquel Duarte Moreira Alves, pela amizade, pelo exemplo de organização e ótima companhia diária. Obrigada pelos conhecimentos compartilhados e pelo valioso auxílio nas análises estatísticas.
À Tatiana Fiche Salles Teixeira, pela amizade, presença e dedicação. Seu empenho foi essencial para a realização desse trabalho. Tati e Raquel, o mérito desse trabalho, compartilho com vocês!
À Viviane Silva Macedo, Fernanda Fonseca Rocha e Laís Emília da Silva, pelo carinho, dedicação e pela disponibilidade em sempre ajudar, especialmente nos momentos mais difíceis.
À Ceres Mattos, Crislaine Almeida, Damiana Diniz, Fernanda Vidigal, Flávia Galvão, José Luiz Rocha, Júlia Carraro, Luciana Cardoso, Luis Fernando Moraes, Mário Flávio Lima, Patrícia Feliciano, Vanessa Reis e Winder Tadeu Ton, pelas contribuições, carinho e momentos inesquecíveis nos laboratórios.
A todos os meus colegas de Pós-Graduação, pelo ótimo tempo de convívio e de estudos.
Aos meus sobrinhos Mariane, Arthur, Guilherme, Alice, Pedro e Manuela por trazerem alegria e leveza.
Ao Bruno, pelo amor, carinho, paciência, incentivo e companheirismo.
BIOGRAFIA
Ana Paula Boroni Moreira nasceu em 21 de junho de 1980 no município de Ponte Nova, Minas Gerais.
Em março de 2000, iniciou o curso de graduação em Nutrição na Universidade Federal de Viçosa (MG), concluindo-o em julho de 2004. Foi bolsista de Iniciação Científica do PIBIC/CNPq durante o período de agosto de 2002 a julho de 2003, atuando em pesquisa sobre o avaliação de carotenóides em vegetais comercializados na microrregião de Viçosa, Minas Gerais.
Em agosto de 2004, ingressou no Curso de Pós-Graduação Stricto
Sensu em Ciência da Nutrição da Universidade Federal de Viçosa (MG),
atuando na linha de pesquisa „Dietética e Qualidade de Alimentos‟, obtendo o título de mestre em julho de 2006.
Em outubro de 2006, ingressou na Universidade Presidente Antônio Carlos (UNIPAC) - campus Magnus (Barbacena) e campus VI (Juiz de Fora), onde permaneceu até novembro de 2007 e lecionou as disciplinas Avaliação Nutricional, Dietoterapia, Terapia Nutricional, Nutrição Materno-Infantil, Tópicos Especiais em Nutrição, Nutrição Experimental, Marketing em Alimentação e Supervisão de Estágio.
Entre novembro de 2007 a julho de 2009, atuou em prática clínica no Hospital Nossa Senhora das Dores no município de Ponte Nova, Minas Gerais.
Entre março de 2008 a fevereiro de 2009, realizou um curso de especialização (Latu Sensu) pelo Grupo de Apoio de Nutrição Enteral e Parenteral (GANEP) na área de nutrição clínica multiprofissional.
Em agosto de 2008, ingressou na Faculdade de Ciências Biológicas e da Saúde (FACISA/UNIVIÇOSA), onde permaneceu até fevereiro de 2010 e lecionou disciplinas relacionadas à área de Nutrição Cllínica.
LISTA DE ABREVIATURAS
ALT: alanine aminotransferase AP: alkaline phosphatase
AST: aspartate aminotransferase ANOVA: analysis of variance BMI: body mass index CI: conicity index
CD14: co-receptor of toll-like receptor 4 CT: control group
CVP: conventional peanut group
DEXA: dual-energy X-ray absorptiometry EU/ml: endotoxin units per milliliter GGT: gamma-glutamyltransferase HDL: high-density-lipoprotein
HOMA-B: homeostasis model assessment of beta cell function HOMA-IR: homeostasis model assessment of insulin resistance HOP: high-oleic peanut group
hsCRP: high-sensitivity C-reactive protein
IAC-505: high-oleic peanut developed by the Instituto Agronômico de Campinas IAC-886: convencional peanut developed by the Instituto Agronômico de Campinas
IDF: International Diabetes Federation IL: interleukin
iNOS: inducible nitric oxide synthase
IPAQ: International Physical Activity Questionnaire IRS: insulin receptor substrate
LAL: Limulus Amebocyte Lysate
LBP: lipopolysaccharide-binding protein LPS: lipopolysaccharide
L/M: lactulose/mannitol ratio
piAUC: positive incremental area under the curve REE: resting energy expenditure
RMANOVA: repeated measures two-way ANOVA SAD: sagital abdominal diameter
SEM: standard error of the mean SI: sagittal index
TAG: triacylglycerols
TEE: total energy expenditure TLR4: toll-like receptors 4
TNF-α: tumor necrosis factor alpha VLDL: very-low-density-lipoprotein %M: mannitol excretion
SUMÁRIO
RESUMO ... xi
ABSTRACT ... xiv
1. INTRODUÇÃO GERAL ... 1
2. OBJETIVOS ... 5
2.1. Objetivo Geral ... 5
2.2. Objetivos Específicos ... 5
3. RESULTADOS ... 6
3.1. Artigo 1: Higher plasma lipopolysaccharide concentrations are associated with less favorable phenotype in men with similar BMI and total adiposity ... 6
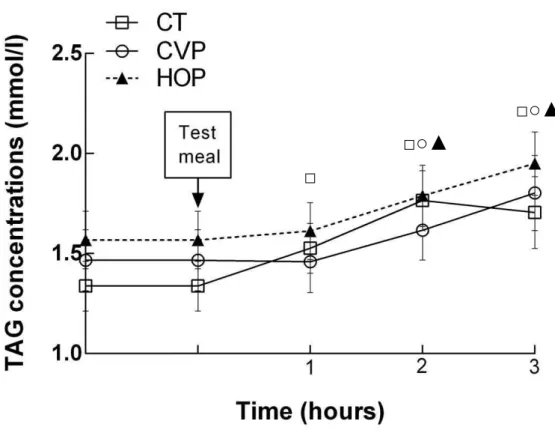
3.2. Artigo 2: A high-fat meal containing conventional or high-oleic peanuts is associated with delayed triglyceridemia and lower 3h postprandial lipopolysaccharide concentrations in overweight/obese men ... 24
3.3. Artigo 3: Effect of a hypocaloric diet containing peanut cultivars differing in oleic acid content on intestinal permeability and endotoxemia……….47
4. CONSIDERAÇÕES FINAIS ...71
5. ANEXOS ...72
Anexo 1: Termo de Consentimento Livre e Esclarecido ... 72
RESUMO
MOREIRA, Ana Paula Boroni, D.Sc., Universidade Federal de Viçosa, setembro de 2013. Efeitos do consumo de amendoim com diferentes teores de ácido graxo oléico na permeabilidade intestinal e endotoxemia em homens com excesso de peso. Orientadora: Rita de Cássia Gonçalves Alfenas. Coorientadoras: Maria do Carmo Gouveia Peluzio, Neuza Maria Brunoro Costa e Josefina Bressan.
estão apresentados em três artigos, sendo os dois primeiros com dados transversais e o terceiro com dados de intervenção. Artigo 1: Higher plasma lipopolysaccharide concentrations are associated with less favorable phenotype in men with similar BMI and total adiposity - Sessenta e sete homens, com IMC médio de 29.7 ± 0.3 kg/m2 foram incluídos. Os voluntários com valores de LPS plasmático ≥ 0.9 EU/mL apresentaram maior DAS, percentual de gordura do tronco, percentual de gordura androide, massa de gordura androide, maiores concentrações de insulina e ALT e maiores índices
Homeostasis Model Assessment of Insulin Resistance (IR) e
HOMA-Beta em relação aos homens com menor concentração de LPS. LPS se correlacionou positivamente com percentual de gordura do tronco, percentual de gordura androide, massa de gordura androide, insulina, AST, fosfatase alcalina, HOMA-IR e HOMA-B. Os resultados sugerem que uma maior concentração de LPS se associa a um fenótipo menos favorável, caracterizado por maior adiposidade central, menor sensibilidade à insulina e comprometimento da função das células beta pancreáticas. Artigo 2: A high-fat meal containing conventional or high-oleic peanuts is associated with
ABSTRACT
MOREIRA, Ana Paula Boroni, D.Sc., Universidade Federal de Viçosa, September, 2013. Effects of consumption of peanut with different oleic fatty acid content on intestinal permeability and endotoxemia in overweight and obese men. Adviser: Rita de Cássia Gonçalves Alfenas. Co-Advisers: Maria do Carmo Gouveia Peluzio, Neuza Maria Brunoro Costa and Josefina Bressan.
sectional studies and the third article, the results of an intervention study. Article 1: Higher plasma lipopolysaccharide concentrations are associated with less favorable phenotype in men with similar BMI and total adiposity – Sixty-seven men with mean BMI of 29.7 ± 0.3 kg/m2 were
evaluated. Men with median plasma LPS ≥ 0.9 EU/mL presented higher SAD,
trunk fat percentage, android fat percentage and mass, insulin and ALT concentrations, homeostasis model assessment of insulin resistance (HOMA-IR), and of beta cell function (HOMA-B) than those with lower plasma LPS. LPS correlated positively with trunk fat percentage, android fat percentage and mass, insulin, AST, ALT, alkaline phosphatase concentrations, HOMA-IR, and HOMA-B. Our results suggest that higher plasma LPS concentration is associated with a less favorable phenotype characterized by higher central adiposity, lower insulin sensitivity, and beta cell function impairment. Article 2:
A high-fat meal containing conventional or high-oleic peanuts is associated with delayed triglyceridemia and lower 3h postprandial
lipopolysaccharide concentrations in overweight/obese men - Sixty-five men were evaluated and assigned to one of the three experimental groups: conventional peanuts (CVP, n=21), high-oleic peanuts (HOP, n=23) or control (CT, n=21). After the consumption of the high-fat test meal LPS concentrations were lower in CVP (0.7 ± 0.5 EU/ml) and HOP (1.0 ± 0.9 EU/ml) groups compared to CT (1.6 ± 1.2 EU/ml) at 3 h postprandial. Triacylglycerols and insulin concentrations increased in all groups. However, triacylglycerols started to increase only after 2 h in CVP and HOP groups while in the CT group the increase was at 1 h postprandial. LPS correlated positively with triacylglycerols. Insulin returned to basal concentrations at 3 h only in CVP and HOP groups. The acute consumption of peanuts delayed the increase in triacylglycerols and favoured the quicker return of insulin to basal concentrations, especially in the CVP group. Our results suggest that the consumption of conventional or high-oleic peanuts may help to reduce the risk of endotoxemia and metabolic disorders. Article 3:Effect of a hypocaloric diet containing peanut cultivars differing in oleic acid content on intestinal permeability and endotoxemia
1 1. INTRODUÇÃO GERAL
O lipopolisacarídeo (LPS) constitui um dos principais componentes da membrana externa de bactérias gram-negativas. A administração de pequenas doses dessa endotoxina na circulação pode induzir respostas imunes e ativar vias que levam à inflamação, inibindo a sinalização insulínica e promovendo ganho de peso (Cani et al., 2007; Manco et al., 2010). Estudos têm evidenciado que indivíduos obesos e diabéticos apresentam maiores concentrações de LPS na circulação (Creely et al., 2007; Basu et al., 2011; Pussinen et al., 2011; Harte et al., 2012). Mais recentemente, tem sido sugerido que a dieta pode desempenhar um papel importante no desenvolvimento da endotoxemia e entre os fatores dietéticos a ingestão excessiva de lipídio tem se destacado (Ghanim et al., 2010; Laugerette et al., 2011).
Ao mesmo tempo que o intestino é um reservatório de LPS, ele também atua como uma barreira à sua passagem para a corrente sanguínea. Assim, maiores concentrações de LPS na circulação podem sugerir a ocorrência de permeabilidade intestinal aumentada. Tem sido proposto que uma ingestão excessiva de lipídio pode promover a passagem de LPS pelo intestino por meio de dois mecanismos: permeabilidade intestinal aumentada (Cani et al., 2008; Cani & Delzenne, 2009; Suzuki & Hara, 2010) e excessiva formação de quilomícrons, capazes de incorporarem partículas de LPS em sua estrutura, com subsequente acesso ao sistema circulatório (Ghoshal et al., 2009; Laugerette et al., 2011; Clemente-Postigo et al., 2012). Além do conteúdo total de lipídio, o perfil de ácidos graxos da dieta também pode influenciar a endotoxemia. O ácido graxo oléico, por exemplo, estimulou em animais a formação de quilomicrons e consequentemente o aumento de LPS na circulação (Ghoshal et al., 2009). Por outro lado, o ácido oléico não alterou a função de barreira, uma vez que não modificou as tight junctions in vitro (Usami et al., 2001).
graxo oléico possui, em media, 81%. Verifica-se ainda na semente, a presença de fibra alimentar, vitaminas antioxidantes, ácido fólico, magnésio, potássio, proteína vegetal, alto teor de arginina e compostos bioativos como, por exemplo, o resveratrol (Kris-Etherton et al., 1999; Griel et al., 2004; Ros et al., 2010).
Estudos clínicos apontam que a ingestão do amendoim tende a manter o peso corporal entre os consumidores, apesar do seu alto aporte calórico (Bes-Rastrollo et al., 2007; Flores-Mateo et al., 2013). O aumento da saciação/saciedade e do metabolismo basal, aumento da atividade antioxidante, melhoria na sensibilidade à insulina e redução de vários marcadores inflamatórios têm sido apontados como possíveis responsáveis por esse papel exercido pelo amendoim (Pérez-Jiménez et al., 2002; Alper & Mattes, 2003; Jiang et al., 2002; Mattes et al., 2008). É provável que o controle do peso corporal também esteja relacionado à menor bioacessibilidade dos lipídios do amendoim (Ellis et al., 2004; Flores-Mateo et al., 2013), o que pode ter implicações para a absorção de LPS.
Estudos sobre a permeabilidade intestinal e a endotoxemia metabólica em seres humanos são escassos na literatura. Considerando que ainda não foi publicado nenhum trabalho em que se avaliou o efeito do consumo do amendoim na integridade intestinal e na concentração plasmática de LPS, verifica-se a necessidade da condução de pesquisas para se avaliar os efeitos desta oleaginosa em tais parâmetros e daí na manifestação de doenças em humanos. Também são necessários estudos para se avaliar o efeito do consumo de amendoim rico em ácido graxo oléico em humanos, visando à identificação de estratégias dietéticas capazes de promover o aumento da integridade da mucosa intestinal e redução da endotoxemia, atenuando os possíveis efeitos deletérios do excesso de peso.
REFERÊNCIAS BIBLIOGRÁFICAS
2. Basu S, Haghiac M, Surace P et al. (2011) Pregravid obesity associates with increased maternal endotoxemia and metabolic inflammation.
Obesity 19, 476-482.
3. Bes-Rastrollo M, Wedick NM, Martinez-Gonzalez MA et al. (2009) Prospective study of nut consumption, long-term weight change, and obesity risk in women. Am J Clin Nutr 89, 1913–1919.
4. Cani PD, Amar J, Iglesias MA et al. (2007) Metabolic Endotoxemia Initiates Obesity and Insulin Resistance. Diabetes 56, 1761-1772.
5. Cani PD, Bibiloni R, Knauf C et al. (2008) Changes in gut microbiota control metabolic endotoxemia-induced inflammation in high-fat dieteinduced obesity and diabetes in mice. Diabetes 57, 1470-1481. 6. Cani PD & Delzenne NM (2009) Interplay between obesity and
associated metabolic disorders: new insights into the gut microbiota. Curr
Opin Pharmacol 9, 737–743.
7. Clemente-Postigo M, Queipo-Ortuño MI, Murri M et al. (2012) Endotoxin increase after fat overload is related to postprandial hypertriacylglycerolmia in morbidly obese patients. J Lipid Res 53, 973-978.
8. Creely SJ, McTernan PG, Kusminski CM et al. (2007) Lipopolysaccharide activates an innate immune system response in human adipose tissue in obesity and type 2 diabetes. Am J Physiol
Endocrinol Metab 292, E740–E747.
9. Ellis PR, Kendall CW, Ren Y et al. (2004) Role of cell walls in the bioaccessibility of lipids in almond seeds. Am J Clin Nutr 80, 604–613. 10. Flores-Mateo G, Rojas-Rueda D, Basora J et al. (2013) Nut intake and
adiposity: meta-analysis of clinical trials. Am J Clin Nutr 97, 1346–1355. 11. Ghanim H, Sia CL, Upadhyay M et al. (2010) Orange juice neutralizes
the proinflammatory effect of a high-fat, high-carbohydrate meal and prevents endotoxin increase and toll-like receptor expression. J Clin Nutr
91, 940–949.
12. Ghoshal S, Witta J, Zhong J et al. (2009) Chylomicrons promote intestinal absorption of lipopolysaccharides. J Lipid Res 50, 90–97.
14. Harte AL, Varma MC, Tripathi G et al. (2012) High fat intake leads to acute postprandial exposure to circulating endotoxin in type 2 diabetic subjects. Diabetes Care 35, 375-382.
15. Jiang R, Manson JE, Stampfer MJ et al. (2002) Nut and peanut butter consumption and risk of type 2 diabetes in women. JAMA 288, 2554– 2560.
16. Kris-Etherton PM, Pearson TA, Wan Y et al. (1999) High-monounsaturated fatty acid diets lower both plasma cholesterol and triacylglycerol concentrations. Am J Clin Nutr 70, 1009-1015.
17. Laugerette F, Vors C, Peretti N et al. (2011) Complex links between dietary lipids, endogenous endotoxins and metabolic inflammation.
Biochimie 93, 39-45.
18. Manco M, Putignani L & Bottazzo GF (2010) Gut microbiota, lipopolysaccharides, and innate immunity in the pathogenesis of obesity and cardiovascular risk. Endocr Rev 31, 817-844.
19. Mattes RD, Kris-Etherton PM & Foster GD (2008) Impact of peanuts and tree nuts on body weight and healthy weight loss in adults. J Nutr 138, 1741S-1745S.
20. Pérez-Jiménez F, López-Miranda J & Mata P (2002) Protective effect of dietary monounsaturated fat on arteriosclerosis: beyong colesterol.
Atherosclerosis 163, 385-398.
21. Pussinen PJ, Havulinna AS, Lehto M et al. (2011) Endotoxemia is associated with an increased risk of incident diabetes. Diabetes Care 34, 392-397.
22. Ros E, Tapsell LC & Sabate J (2010). Nuts and berries for heart health.
Curr Atheroscler Rep 12, 397–406.
23. Suzuki T & Hara H (2010) Dietary fat and bile juice, but not obesity, are responsible for the increase in small intestinal permeability induced through the suppression of tight High-fat diet and endotoxemia junction protein expression in LETO and OLETF rats. Nutr Metab 12, 7–19.
24. Usami M, Muraki K, Iwamoto M et al. (2001) Effect of eicosapentaenoic acid (EPA) on tight junction permeability in intestinal monolayer cells.
2. OBJETIVOS
2.1. Objetivo Geral:
Avaliar os efeitos do consumo de amendoim convencional e de amendoim rico em ácido graxo oléico na integridade da mucosa intestinal e na endotoxemia metabólica em homens com excesso de peso.
2.2. Objetivos Específicos:
1) Avaliar a relação entre concentração plasmática de lipopolissacarídeo versus
distribuição de gordura corporal e parâmetros bioquímicos indicativos de desordens metabólicas.
2) Avaliar o efeito agudo do consumo de amendoim convencional e de amendoim rico em ácido graxo oléico:
Nos níveis de lipopolissacarídeo pós-prandiais; Nos níveis de triacilgliceróis pós-prandiais; Na glicemia e insulinemia pós-prandiais.
3) Avaliar os efeitos do consumo durante 4 semanas de amendoim convencional e de amendoim rico em ácido graxo oléico:
Na glicemia e insulinemia de jejum e pós-prandiais; Na resistência insulínica;
Nos níveis de lipopolissacarídeo em jejum e pós-prandial; Nos níveis de triacilgliceróis de jejum e pós-prandiais; No colesterol total, HDL, LDL e VLDL em jejum;
Nos biomarcadores (proteína C reativa, aspartato aminotransferase, alanina aminotransferase, gama-glutamil transferase e fosfatase alcalina) em jejum;
Na permeabilidade intestinal;
Nos parâmetros antropométricos (peso, circunferência da cintura e diâmetro abdominal sagital);
3. RESULTADOS
3.1. Artigo 1: Higher plasma lipopolysaccharide concentrations are
associated with less favorable phenotype in men with similar BMI and
total adiposity (Autores: Ana Paula Boroni Moreira, Raquel Duarte Moreira
Alves, Tatiana Fiche Salles Teixeira, Viviane Silva Macedo, Richard Mattes, Josefina Bressan, Neuza Maria Brunoro Costa, Maria do Carmo Gouveia Peluzio, Rita de Cássia Gonçalves Alfenas).
ABSTRACT
Lipopolysaccharide (LPS) from the outer membrane of gram-negative bacteria might be an inflammation trigger in adipose tissue. It has been proposed recently that there is a link between adipose tissue distribution and blood LPS. However, the number of studies about this topic is scarce requiring further investigation in humans. This study explored the association between plasma LPS concentration and body fat distribution as well biochemical parameters that may indicate the occurrence of metabolic disorders. Sixty-seven young adult men (body mass index (BMI) 29.7 ± 0.3 kg/m2) were evaluated. Anthropometry, body composition and body fat distribution, blood pressure, energy expenditure, physical activity level, dietary intake, and biochemical parameters were assessed. Men with median plasma LPS ≥ 0.9 EU/mL presented higher sagital abdominal diameter, trunk fat percentage, android fat percentage and mass, insulin and alanine aminotransferase concentrations, homeostasis model assessment of insulin resistance (HOMA-IR), and of beta cell function (HOMA-B) than those with lower plasma LPS. LPS correlated positively with trunk fat percentage, android fat percentage and mass, insulin, aspartate aminotransferase, alanine aminotransferase, and alkaline phosphatase concentrations, HOMA-IR, and HOMA-B. Our results suggest that higher plasma LPS concentration is associated with a less favorable phenotype characterized by higher central adiposity, lower insulin sensitivity, and beta cell function impairment.
Key words: Lipopolysaccharide, abdominal obesity, insulin, homeostasis model
1. INTRODUCTION
Adipose tissue functions extend the storage of fat. The endocrine, paracrine and autocrine signals secreted by adipose tissue regulate the metabolism of other cells. Both the lack (lipoatrophy) and the excess of adipose tissue are detrimental to metabolic equilibrium, which is also dependent on the functionality of this tissue. It has been proposed that each person may have a threshold level of adiposity beyond which dysfunctionality occurs. In this case, integration of different biochemical pathways, especially lipogenesis, lypolisis and fatty acid oxidation are disturbed, with an impact on whole physiology (Vásquez-Vela et al., 2008).
Hyperglycemia, dyslipidemia, and hypertension are metabolic disorders that often occur together and characterize a phenotype frequently associated with obesity (Vásquez-Vela et al., 2008; Virtue & Vidal-Puig, 2008). However, obesity per se (body mass index (BMI) higher than 30 kg/m2) is not necessarily associated with these metabolic disorders in clinical practice (Montague &
O‟Rahilly, 2000). It may require the co-occurrence of insulin resistance (Reaven, 1991; Shanik et al., 2008; Ding & Lund, 2011; Lupattelli et al., 2013).
Body fat distribution and adipocyte size rather than total adiposity are key physical characteristics that influence the functionality of adipose tissue and occurrence of insulin resistance. Visceral fat mass, in particular, is a strong and independent predictor of adverse health outcomes of obesity (Vásquez-Vela et al., 2008; Klöting et al., 2010; Ledoux et al., 2010). One of the mechanistic explanations is that expansion of visceral adipose tissue mass without adequate support of vascularization might lead to hypoxia, which in turn, activates signaling to recruit immune cells. Macrophage infiltration and subsequent increased expression of inflammatory molecules, such as tumor necrosis factor alpha (TNF-α), would impair the downstream signaling of the insulin receptor, creating resistance to insulin action (Klöting et al., 2010; Könner et al., 2011). Thus, inflammatory activation links insulin resistance and visceral adiposity (Brook et al., 2013; Trøseid et al., 2013).
LPS is capable of influencing adipogenesis. Chronic infusion of low-doses of LPS induces adiposity gain, as well as chronic inflammation, insulin resistance, hyperglycemia and dyslipidemia in mice (Cani et al., 2007). Later, Muccioli et al. (2010) reported that LPS may serve as a master switch to control adipose tissue metabolism in vivo and ex vivo through inhibition of cannabinoid-driven adipogenesis. There are also data showing that LPS suppress adipogenesis in 3T3-L1 preadipocytes (Wang et al., 2013). Thus, it remains poorly understood if LPS induces or inhibits adipogenesis and how this may affect metabolic control. LPS might trigger inflammation in adipose tissue since expression of TLR4 has been identified in adipose tissue and isolated adipocytes (Shi et al., 2006). In addition, LPS infusion has been shown to alter expression of inflammatory markers in subcutaneous adipose tissue and to cause insulin resistance in humans (Mehta et al., 2010).
The findings of higher blood LPS concentrations in obese and diabetics patients compared to apparently healthy/lean subjects (Creely et al., 2007; Miller et al., 2009; Devaraj et al., 2009; Pussinen et al., 2011; Liang et al., 2013; Trøseid et al., 2013) raises the possibility that adipose tissue functionality and expansion may be affected by LPS concentration. However, evidence of the relationship between adipose tissue distribution and circulating concentrations of LPS are emerging (Trøseid et al., 2013) and requires further investigation in humans.
2. EXPERIMENTAL METHODS
Subjects
Written advertisements and social network were used for recruitment. One hundred and fifty men were screened. The inclusion criteria were: BMI between 26-35 kg/m2, age between 18-50 years, non-smoker, no food allergy, and ethanol consumption lower than 168g/week. Body weight changes over 3 kg, following weight loss diet, the use of drugs that affect the biochemical parameters evaluated in the study, and presence of acute or chronic diseases were the exclusion criteria. Sixty-seven young adult men were included in the study (mean age 27.1 ± 0.9 years).
The study was approved by the Ethical Committee in Human Research from Federal University of Viçosa, Brazil (protocol number 185/2011). All subjects signed a written informed consent. After an overnight fasting, the evaluations were performed using standardized protocols and environmental conditions.
Anthropometrics and body composition
Anthropometric data and body composition were assessed by a single trained technician. Neck circumference was measured at the middle point of the
neck‟s height (Vasques et al., 2009). Waist circumference was measured at the midpoint between the iliac crest and the last rib. The sagital abdominal diameter (SAD) was measured with an abdominal caliper (Holtain Kahn Abdominal Caliper®). With the subject in the supine position waist circumference was at the same point. Hip circumference was measured at the largest point between the waist and thigh. Thigh circumference was measured at the midpoint between the inguinal crease and the proximal border of the patella. The subject remained standing, and with the right leg slightly bent (Vasques et al., 2009). The conicity index (CI) and the sagittal index (SI) were calculated according to Valdez et al. (1993) and Kahn et al. (1996), respectively.
CI = waist circumference (cm) / 0.109 x √weight (kg) / height (cm) SI = SAD (cm) / thigh circumference (cm)
region is the area between the ribs and the pelvis, and is totally enclosed by the trunk region. The gynoid region includes the hips and upper thighs, and overlaps both the leg and trunk regions.
Energy expenditure
Subjects were instructed to abstain from caffeine and alcohol consumption, to refrain from heavy physical activity, and to maintain a regular sleep-wake schedule (8 hours/night) during the 72-hours before test day. Respiratory gas exchange was measured over 30 minutes under fasting conditions by indirect calorimetry using a ventilated respiratory canopy (Deltatrac II, MBM-200; Datex Instrumentarium Corporation) in compliance with the manufacturer guidelines. Then, the resting energy expenditure (REE) was obtained. The subject‟s daily energy requirement was calculated by multiplying the measured REE by a physical activity factor (WHO, 2001). The physical activity factor was determined through the Portuguese version of International Physical activity Questionnaire (IPAQ) validated by Pardini et al. (2001).
Dietary intake assessment
Subjects provided three-day food records (two non-consecutive week days and one weekend day). A dietitian reviewed the food records with the subjects to check for errors or omissions. All the food records were analyzed by the same dietitian using software Dietpro 5.2i (Agromídia, Viçosa, Brazil).
Biochemical analysis
Blood samples were drawn from an antecubital vein after a 12-hour overnight fasting. Plasma-EDTA and serum were separated from blood through centrifugation (2.200 x g, 15 min, 4°C) and stored at -80ºC.
LDL and VLDL concentrations were calculated according to the Friedewald et al. (1972) formula. Serum insulin concentrations were analyzed through electrochemiluminescence immunoassay (Elecsys-Modular E-170, Roche Diagnostics Systems). The homeostasis model assessment of insulin resistance (HOMA-IR) and homeostasis model assessment of beta cell function (HOMA-B) were calculated according to Matthews et al. (1985).
Plasma LPS concentrations were determined through a chromogenic method using a Limulus Amebocyte Lysate (LAL) commercial kit (Hycult Biotech, The Netherlands). Undiluted plasma samples were heated at 75ºC for 5 min to neutralize endotoxin inhibitors. Aliquots (50 µl) of plasma and standards were added to the pyrogen-free microplate. The LAL reagent (50 µl) was added in each well. After 30 min of incubation, absorbance was read at 405 nm (Multiskan Go, Thermo Scientific, USA). When the optical density of the standards 10 and 4 EU/ml differed by less than 10%, the reaction was interrupted by adding 50 µl of stop solution (acetic acid) and absorbance was read again. As absorbance is directly proportional to the concentration of endotoxin, a standard curve was used to calculate LPS concentration in the samples. The concentration of LPS was expressed as endotoxin units per milliliter (EU/ml).
Statistical analysis
3. RESULTS
General subjects’ characteristics
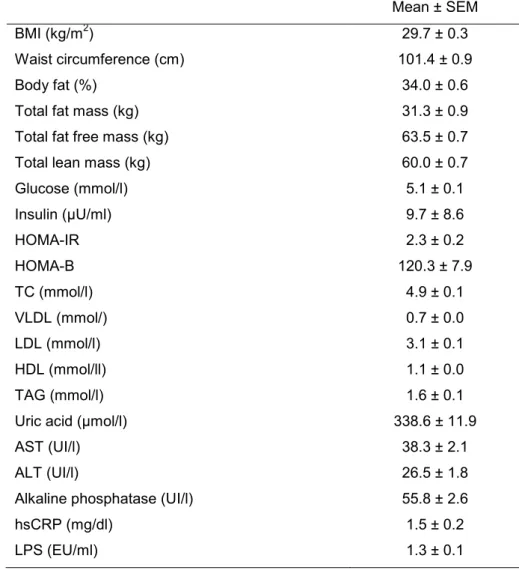
Table 1. Anthropometric, body composition, and biochemical characteristics of
the study participants (n=67)
Mean ± SEM
BMI (kg/m2) 29.7 ± 0.3
Waist circumference (cm) 101.4 ± 0.9
Body fat (%) 34.0 ± 0.6
Total fat mass (kg) 31.3 ± 0.9
Total fat free mass (kg) 63.5 ± 0.7
Total lean mass (kg) 60.0 ± 0.7
Glucose (mmol/l) 5.1 ± 0.1
Insulin (µU/ml) 9.7 ± 8.6
HOMA-IR 2.3 ± 0.2
HOMA-B 120.3 ± 7.9
TC (mmol/l) 4.9 ± 0.1
VLDL (mmol/) 0.7 ± 0.0
LDL (mmol/l) 3.1 ± 0.1
HDL (mmol/ll) 1.1 ± 0.0
TAG (mmol/l) 1.6 ± 0.1
Uric acid (µmol/l) 338.6 ± 11.9
AST (UI/l) 38.3 ± 2.1
ALT (UI/l) 26.5 ± 1.8
Alkaline phosphatase (UI/l) 55.8 ± 2.6
hsCRP (mg/dl) 1.5 ± 0.2
LPS (EU/ml) 1.3 ± 0.1
BMI: body mass index; HOMA-IR: homeostasis model assessment of insulin resistance; HOMA-B: homeostasis model assessment of beta cell function; TC: total cholesterol; TAG: triacylglycerols; AST: aspartate aminotransferase; ALT: alanine aminotransferase; hsCRP: high-sensitivity C-reactive protein; LPS: lipopolysaccharide.
Characterization of subjects below and above median LPS concentration
Plasma LPS was classified as above/equal or below the median (0.9 EU/ml) concentrations presented by the subjects. The subjects´ anthropometrics, body composition; clinical and biochemical characteristics; and energy intake, macronutrient, and dietary fiber consumption are shown in Tables 2, 3, and 4.
energy intake, macronutrient, and fiber was similar between them (p>0.05). Blood pressure, physical activity level, and daily energy requirements were not significantly different between groups (data not shown).
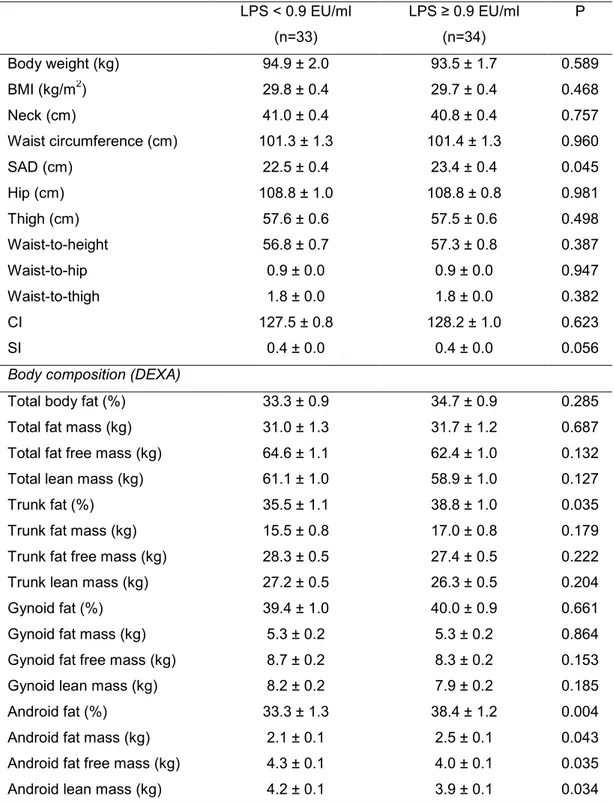
Table 2. Anthropometric and body composition characteristics1 of excessive body weight men according to plasma LPS concentration
LPS < 0.9 EU/ml
(n=33)
LPS ≥ 0.9 EU/ml (n=34)
P
Body weight (kg) 94.9 ± 2.0 93.5 ± 1.7 0.589
BMI (kg/m2) 29.8 ± 0.4 29.7 ± 0.4 0.468
Neck (cm) 41.0 ± 0.4 40.8 ± 0.4 0.757
Waist circumference (cm) 101.3 ± 1.3 101.4 ± 1.3 0.960
SAD (cm) 22.5 ± 0.4 23.4 ± 0.4 0.045
Hip (cm) 108.8 ± 1.0 108.8 ± 0.8 0.981
Thigh (cm) 57.6 ± 0.6 57.5 ± 0.6 0.498
Waist-to-height 56.8 ± 0.7 57.3 ± 0.8 0.387
Waist-to-hip 0.9 ± 0.0 0.9 ± 0.0 0.947
Waist-to-thigh 1.8 ± 0.0 1.8 ± 0.0 0.382
CI 127.5 ± 0.8 128.2 ± 1.0 0.623
SI 0.4 ± 0.0 0.4 ± 0.0 0.056
Body composition (DEXA)
Total body fat (%) 33.3 ± 0.9 34.7 ± 0.9 0.285
Total fat mass (kg) 31.0 ± 1.3 31.7 ± 1.2 0.687
Total fat free mass (kg) 64.6 ± 1.1 62.4 ± 1.0 0.132
Total lean mass (kg) 61.1 ± 1.0 58.9 ± 1.0 0.127
Trunk fat (%) 35.5 ± 1.1 38.8 ± 1.0 0.035
Trunk fat mass (kg) 15.5 ± 0.8 17.0 ± 0.8 0.179
Trunk fat free mass (kg) 28.3 ± 0.5 27.4 ± 0.5 0.222
Trunk lean mass (kg) 27.2 ± 0.5 26.3 ± 0.5 0.204
Gynoid fat (%) 39.4 ± 1.0 40.0 ± 0.9 0.661
Gynoid fat mass (kg) 5.3 ± 0.2 5.3 ± 0.2 0.864
Gynoid fat free mass (kg) 8.7 ± 0.2 8.3 ± 0.2 0.153
Gynoid lean mass (kg) 8.2 ± 0.2 7.9 ± 0.2 0.185
Android fat (%) 33.3 ± 1.3 38.4 ± 1.2 0.004
Android fat mass (kg) 2.1 ± 0.1 2.5 ± 0.1 0.043
Android fat free mass (kg) 4.3 ± 0.1 4.0 ± 0.1 0.035
Android lean mass (kg) 4.2 ± 0.1 3.9 ± 0.1 0.034 1
Data are represented as mean ± standard error of the mean (SEM).
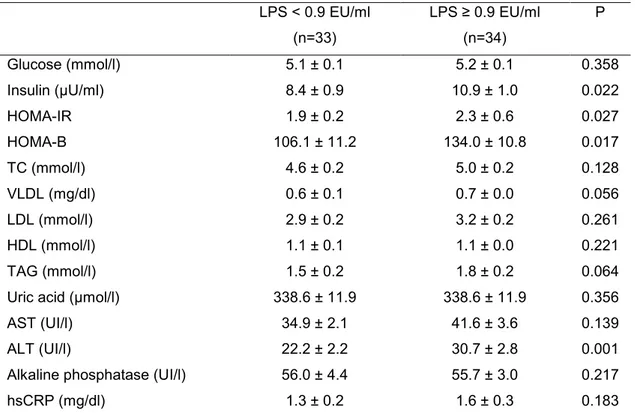
Table 3. Clinical and biochemical characteristics1 of excessive body weight men according to plasma LPS concentration
LPS < 0.9 EU/ml
(n=33)
LPS ≥ 0.9 EU/ml (n=34)
P
Glucose (mmol/l) 5.1 ± 0.1 5.2 ± 0.1 0.358
Insulin (µU/ml) 8.4 ± 0.9 10.9 ± 1.0 0.022
HOMA-IR 1.9 ± 0.2 2.3 ± 0.6 0.027
HOMA-B 106.1 ± 11.2 134.0 ± 10.8 0.017
TC (mmol/l) 4.6 ± 0.2 5.0 ± 0.2 0.128
VLDL (mg/dl) 0.6 ± 0.1 0.7 ± 0.0 0.056
LDL (mmol/l) 2.9 ± 0.2 3.2 ± 0.2 0.261
HDL (mmol/l) 1.1 ± 0.1 1.1 ± 0.0 0.221
TAG (mmol/l) 1.5 ± 0.2 1.8 ± 0.2 0.064
Uric acid (µmol/l) 338.6 ± 11.9 338.6 ± 11.9 0.356
AST (UI/l) 34.9 ± 2.1 41.6 ± 3.6 0.139
ALT (UI/l) 22.2 ± 2.2 30.7 ± 2.8 0.001
Alkaline phosphatase (UI/l) 56.0 ± 4.4 55.7 ± 3.0 0.217
hsCRP (mg/dl) 1.3 ± 0.2 1.6 ± 0.3 0.183
1
Data are represented as mean ± standard error of the mean (SEM).
LPS: lipopolysaccharide; HOMA-IR: homeostasis model assessment of insulin resistance; HOMA-B: homeostasis model assessment of beta cell function; TC: total cholesterol; TAG: triacylglycerols; AST: aspartate aminotransferase; ALT: alanine aminotransferase; hsCRP: high-sensitivity C-reactive protein. P value significant at p < 0.05.
Table 4. Energy intake, macronutrient, and dietary fiber consumption1 of excessive body weight men according to plasma LPS concentration
LPS < 0.9 EU/ml
(n=33)
LPS ≥ 0.9 EU/ml (n=34)
P
Energy (kcal/day) 2726.9 ± 137.6 2863.2 ± 95.1 0.118
Carbohydrate (%) 52.7 ± 1.1 51.8 ± 1.0 0.579
Protein (%) 16.7 ± 0.6 16.4 ± 0.4 0.741
Fat (%) 30.7 ± 1.0 31.7 ± 0.9 0.430
Dietary fiber (g/day) 27.6 ± 2.4 26.9 ± 1.3 0.224 1
Correlation between LPS concentration, fat distribution, and biochemical variables
Correlations were computed between LPS and the outcome variables. Significant associations are reported (Table 5). Plasma LPS concentration correlated positively with trunk fat percentage, android fat mass, and percentage. In addition, plasma LPS concentration correlated positively with serum insulin, AST, ALT, alkaline phosphatase, HOMA-IR, and HOMA-B. The other biochemical parameters as well as anthropometric, body composition, REE, and dietary intake data were not significantly correlated with LPS concentrations.
Table 5. Correlation coefficient between plasma LPS concentration, body composition, and biochemical variables
LPS
r p
Trunk fat (%) 0.26 0.033
Android fat mass (kg) 0.26 0.034
Android fat (%) 0.34 <0.004
Insulin (µU/ml) 0.28 0.021
HOMA-IR 0.27 0.029
HOMA-B 0.30 0.013
AST (UI/l) 0.26 0.030
ALT (UI/l) 0.41 <0.001
Alkaline phosphatase (UI/l) 0.25 0.048
4. DISCUSSION
The impact of total adiposity and of different locations of fat depots over metabolic abnormalities is difficult to characterize (Item & Konrad, 2012). However, considering subjects with similar BMI is still possible to identify those
considered „metabolically healthy obese‟ from the „at risk‟ subjects. Visceral
adipose tissue, degree insulin sensitivity, and expression of inflammatory markers are determinants for the distinction of these categories (Messier et al., 2010). Since LPS is involved in inflammatory activation and may influence intra-abdominal fat expansion (Lam et al., 2011) we investigated whether LPS concentrations could be used to discriminate the phenotype presented by obese individuals with similar BMI and total adiposity.
The data reveal that, despite having similar weight, BMI, waist circumference, and total body fat, subjects with higher plasma LPS concentrations presented a less favorable phenotype than subjects with lower
LPS concentration. The „less favorable phenotype‟ was basically characterized
by higher android and trunk adiposity, higher fasting insulin, HOMA-IR and HOMA-B, and ALT.
associated with android and trunk fat (central region) reinforces the possible influence of LPS on fat distribution. Unfortunately, the use of BMI, waist circumference, SAD and measurement of adiposity using DEXA does not allow proper discrimination between subcutaneous and visceral adipose tissue at the central location.
Nevertheless, Trøseid et al. (2013) presented evidences that plasma LPS concentrations were more strongly correlated with intra-abdominal fat than with subcutaneous fat volumes. The mechanisms underlying this association are unclear. The cross-sectional nature of studies, including ours, does not allow determination of whether visceral depots increase due to excessive energy intake or to higher gut-derived LPS, and also whether a higher degree of insulin resistance arises before or after visceral adiposity accumulation. Since subjects from the present study had similar energy and macronutrient intakes, it is possible that higher LPS concentrations influence the accumulation of central fat and insulin resistance. A current hypothesis holds that translocation of gut-derived molecules to adipose tissue localized in close proximity to the gut, such as mesenteric fat, would trigger macrophage infiltration and inflammation, which in turn would stimulate expansion of this visceral depot (Lam et al., 2011; Trøseid et al., 2013). The downstream signaling of the insulin receptor can be impaired by inflammatory signals, which can be directly induced by LPS stimulation (Shanik et al., 2008; Ding & Lund, 2011). Mesenteric fat expresses higher concentrations of proinflammatory chemokines than other sites of adipose tissue in obese mice (Yu et al., 2006). It is also still unclear if inflammatory activation occurs before or after specific adipose tissue expansion and insulin resistance establishment.
2006). The pathophysiological sequence of events that leads to insulin resistance considering regional fat distribution and an interactive influence of LPS remains to be established in humans.
Of note, we were expecting that the prevalence of metabolic syndrome would be higher in the group with higher LPS concentration. However, the prevalence did not differ (data not shown) between groups. As the volunteers are young adults, it is possible that the less favorable phenotype associated with higher LPS concentrations would increase the prevalence of metabolic syndrome in the long term. Longitudinal studies would be of great interest to test this hypothesis.
Finally, we verified that AST, ALT, and alkaline phosphatase enzymes were positively associated with plasma LPS, even though the mean values observed remained within normal ranges. AST and ALT are markers of liver injury (Lee et al., 2007). Since liver is responsible for circulating LPS clearance, higher LPS concentrations may negatively influence hepatic cells and increase the release of hepatic enzymes (Tuin et al., 2006; Manco et al., 2010). The infusion of LPS in animals increases ALT and AST blood concentrations (Coimbra et al., 2005). The correlation between alkaline phosphatase and LPS may be explained by the function of this enzyme in the dephosphorylation of the LPS, reducing by 100 times the toxicity of lipid A (Schromm et al., 1998; Bates et al., 2007).
5. REFERENCES
1. Abbasi F, Blasey C & Reaven GM (2013) Cardiometabolic risk factors and obesity: does it matter whether BMI or waist circumference is the index of obesity? Am J Clin Nutr 98, 637-640.
2. Alberti KG, Zimmet P, Shaw J, IDF Epidemiology Task Force Consensus Group (2005) The metabolic syndrome: a new worldwide definition.
Lancet 366, 1059 –1062.
3. Bates JM, Akerlund J, Mittge E et al. (2007) Intestinal alkaline phosphatase detoxifies lipopolysaccharide and prevents inflammation in response to the gut microbiota. Cell Host Microbe 2, 371–382.
4. Brook JS, Lee JY, Finch SJ et al. (2013) Physical factors, personal characteristics, and substance use: associations with obesity. Subst Abus 34, 273-276.
5. Calori G, Lattuada G, Piemonti L et al. (2011) Prevalence, metabolic features, and prognosis of metabolically healthy obese italian individuals: the cremona study. Diabetes Care 34, 210-215.
6. Cani PD, Amar J, Iglesias MA et al. (2007) Metabolic endotoxemia initiates obesity and insulin resistance. Diabetes 56, 1761-1772.
7. Clemente-Postigo M, Queipo-Ortuño MI, Murri M et al. (2012) Endotoxin increase after fat overload is related to postprandial hypertriacylglycerolmia in morbidly obese patients. J Lipid Res 53, 973-978.
8. Coimbra R, Porcides RD, Melbostad H et al. (2005) Nonspecific phosphodiesterase inhibition attenuates liver injury in acute endotoxemia. Surg Infect 6, 73-85.
9. Cornier M-A, Després J-P, Davis N et al. (2011) Assessing adiposity: a scientific statement from the american heart association. Circulation 124, 1996-2019.
10. Creely SJ, McTernan PG, Kusminski CM et al. (2007) Lipopolysaccharide activates an innate immune system response in human adipose tissue in obesity and type 2 diabetes. Am J Physiol
Endocrinol Metab 292, E740–E747.
12. Devaraj S, Dasu MR, Park SH et al. (2009) Increased levels of ligands of Toll-like receptors 2 and 4 in type 1 diabetes. Diabetologia 52, 1665-1668.
13. Ding S & Lund PK (2011) Role of intestinal inflammation as an early event in obesity and insulin resistance. Curr Opin Clin Nutr Metab Care
14, 328-333.
14. Friedewald WT, Levy RI & Fredrickson DS (1972) Estimation of the concentration of low-density lipoprotein cholesterol in plasma, without use of the preparative ultracentrifuge. Clin Chem 18, 499-502.
15. Item F & Konrad D (2012) Visceral fat and metabolic inflammation: the portal theory revisited. Obes Rev 13, 30-39.
16. Kahn HS, Austin H, Williamson DF et al. (1996) Simple anthropometric indices associated with ischemic heart disease. J Clin Epidemiol 49, 1017-1024.
17. Klöting N, Fasshauer M, Dietrich A et al. (2010) Insulin-sensitive obesity.
Am J Physiol Endocrinol Metab 299, E506-E515.
18. Könner AC & Brüning JC (2011) Toll-like receptors: linking inflammation to metabolism. Trends Endocrinol Metab 22, 16-23.
19. Lam YY, Mitchell AJ, Holmes AJ et al. (2011) Role of the gut in visceral fat inflammation and metabolic disorders. Obesity (Silver Spring) 19, 2113-2120.
20. Ledoux S, Coupaye M, Essig M et al. (2010) Traditional anthropometric parameters still predict metabolic disorders in women with severe obesity. Obesity 18, 1026-1032.
21. Lee RP, Lin NT, Chao YFC et al. (2007) High-density lipoprotein prevents organ damage in endotoxemia. Res Nurs Health 30, 250–260. 22. Liang H, Hussey SE, Sanchez-Avila A et al. (2013) Effect of
lipopolysaccharide on inflammation and insulin action in human muscle.
PLoS One 8, e63983.
23. Lupattelli G, Vuono SD, Boni M et al. (2013) Insulin resistance and not BMI is the major determinant of early vascular impairment in patients with morbid obesity. J Atheroscler Thromb.
25. Matthews DR, Hosker JP, Rudenski AS et al. (1985) Homeostasis model assessment: insulin resistance and beta-cell function from fasting plasma glucose and insulin concentrations in man. Diabetologia 28, 412-419. 26. Mehta NN, McGillicuddy FC, Anderson PD et al. (2010) Experimental
endotoxemia induces adipose inflammation and insulin resistance in humans. Diabetes 59,172-181.
27. Messier V, Karelis AD, Prud'homme D et al. (2010) Identifying metabolically healthy but obese individuals in sedentary postmenopausal women. Obesity 18, 911-917.
28. Miller MA, McTernan PG, Harte AL et al. (2009) Ethnic and sex differences in circulating endotoxin levels: a novel marker of atherosclerotic and cardiovascular risk in a British multi-ethnic population. Atherosclerosis 203, 494–502.
29. Montague CT & O'Rahilly S (2000) The perils of portliness: causes and consequences of visceral adiposity. Diabetes 49, 883-888.
30. Muccioli GG, Naslain D, Backhed F et al. (2010) The endocannabinoid system links gut microbiota to adipogenesis. Mol Syst Biol 6, 392.
31. Pardini R, Matsudo SMM, Araújo T et al. (2001) Validação do questionário internacional de nível de atividade física (IPAQ - versão 6): estudo piloto em adultos jovens brasileiros. Rev Bras Ciên Mov 9, 45-51. 32. Pussinen PJ, Havulinna AS, Lehto M et al. (2011) Endotoxemia is
associated with an increased risk of incident diabetes. Diabetes Care 34, 392-397.
33. Reaven GM (1991) Insulin resistance and compensatory hyperinsulinemia: role in hypertension, dyslipidemia, and coronary heart disease. Am Heart J 121, (4 Pt 2): 1283-1288.
34. Schromm AB, Brandenburg K, Loppnow H et al. (1998) The charge of endotoxin molecules influences their conformation and IL-6-inducing capacity. J Immunol 161, 5464-5471.
35. Shanik MH, Xu Y, Skrha J et al. (2008) Insulin resistance and hyperinsulinemia: is hyperinsulinemia the cart or the horse? Diabetes Care 31, S262-S268.
37. Trøseid M, Nestvold TK, Rudi K et al. (2013). Plasma lipopolysaccharide is closely associated with glycemic control and abdominal obesity: evidence from bariatric surgery. Diabetes Care 36, 3627-3632.
38. Tuin A, Huizinga-Van der Vlag A, van Loenen-Weemaes AMMA et al.
(2006) On the role and fate of LPS-dephosphorylating activity in the rat liver. Am J Physiol Gastrointest Liver Physiol 290, G377-G385.
39. Valdez R, Seidell JC, Ahn YI et al. (1993) A new index of abdominal adiposity as an indicator of risk for cardiovascular disease. A crosspopulation study. Int J Obes Relat Metab Disord 17, 77-82.
40. Vasques ACJ, Rosado LEFPL, Rosado GP et al. (2009) Habilidade de indicadores antropométricos e de composição corporal em identificar a resistência à insulin. Arq Bras Endocrinol Metab 53, 72-79.
41. Vázquez-Vela MEF, Torres N, Tovar AR (2008) White adipose tissue as endocrine organ and its role in obesity. Arch Med Res 39, 715-728. 42. Virtue S & Vidal-Puig A (2008) It's not how fat you are, it's what you do
with it that counts. PLoS Biol 6, e237.
43. Wang L, Li L, Ran X et al. (2013) Lipopolysaccharides reduce adipogenesis in 3T3-L1 adipocytes through activation of NF-κB pathway and downregulation of AMPK expression. Cardiovasc Toxicol.
44. World Health Organization (2001) Food and nutrition technical report series: human energy requirements. Joint FAO/WHO/UNU Expert Consultation. Rome: WHO.
45. Yu R, Kim CS, Kwon BS et al. (2006) Mesenteric adipose tissue-derived monocyte chemoattractant protein-1 plays a crucial role in adipose tissue macrophage migration and activation in obese mice. Obesity (Silver
3.2. Artigo 2: A high-fat meal containing conventional or high-oleic
peanuts is associated with delayed triglyceridemia and lower 3h
postprandial lipopolysaccharide concentrations in overweight/obese men
(Artigo apresentado no exame de qualificação, em 29 de abril de 2013. Autores: Ana Paula Boroni Moreira, Tatiana Fiche Salles Teixeira, Raquel Duarte Moreira Alves, Maria do Carmo Gouveia Peluzio, Neuza Maria Brunoro Costa, Josefina Bressan, Leandro Licursi de Oliveira, Richard Mattes, Rita de Cássia Gonçalves Alfenas).
ABSTRACT
1. INTRODUCTION
Lipopolysaccharide (LPS), also known as endotoxin, is the major component of the outer membrane of gram-negative bacteria. LPS activates immune cells and inflammatory pathways (Moreira & Alfenas, 2012). Chronic and systemic exposure to slightly increased LPS concentrations may induce subclinical chronic inflammation. Consequently, insulin signalling can be inhibited leading to insulin resistance. Higher blood LPS concentrations have been observed in obese and diabetics compared to healthy subjects (Creely et al., 2007; Thuy et al., 2008; Devaraj et al., 2009; Pussinen et al., 2011), suggesting an association between LPS concentrations and metabolic disorders such as insulin resistance.
The gut is a substantive source of LPS. Its translocation from the gut into the circulatory system is favoured by high-fat consumption (Erridge et al., 2007; Amar et al., 2008; Ghanim et al., 2009; Laugerette et al., 2011a; Moreira et al., 2012a). LPS has a lipidic region, known as lipid A (Raetz & Whitfield, 2002) that can be incorporated into chylomicrons during fat digestion and absorption (Vreugdenhil et al., 2003; Ghoshal et al., 2009). During its passage to the bloodstream, chylomicrons can accumulate in the intercellular space, which may impair intestinal barrier function and favour LPS translocation (Tso & Balint, 1986; Kvietys et al., 1991; Shen et al., 2009; Salim & Soderholm, 2011). Thus, the regular consumption of high-fat diets can lead to excessive and prolonged chylomicronemia, which in turn may increase exposure to extra-hepatic LPS (Ghoshal et al., 2009).
2013) indicates that there is a need to clarify the effect of the consumption of oleic acid rich foods on LPS concentrations and other biochemical parameters. Dietary factors such as phytochemicals (Ghanim et al., 2009; Ghanim et al., 2010; Deopurkar et al., 2010) and probiotics/prebiotics (Cani et al., 2007; De Bandt et al., 2011) are associated with lower endotoxemia, besides leading to a better metabolic profile and lower inflammatory markers, suggesting that the LPS concentration reduction could be a target in chronic diseases management. Studies evaluating the influence of food and/or specific nutrients in blood LPS concentrations can help to identify nutritional strategies to ameliorate postprandial endotoxemia and its metabolic complications.
Consumption of high-fat foods may not necessarily enhance endotoxin absorption if they present other nutritional advantages such as favourable fatty acid and fiber profile. Although peanuts have a high-fat content, its consumption has been associated with health benefits, including reduction of the risk for cardiovascular disease and type 2 diabetes (Bes-Rastrollo et al., 2009; Ghadimi et al., 2010; Mattes & Dreher, 2010; Reis et al., 2012). This has been attributed to its content of mostly unsaturated fatty acids, protein, dietary fiber, an array of vitamins and minerals, and bioactive substances (Bansode et al., 2012). Regular consumption of peanuts may reduce lipemia despite its high-fat content (Alper & Mattes, 2003). The reduced lipemia induced by peanuts may be associated with lower endotoxemia.
Therefore, the aims of the study were to evaluate the impact of acute consumption of two peanut cultivars differing in monounsaturated fatty acids (conventional and high-oleic peanut) content on postprandial endotoxemia in overweight and obese men and to determine its influence on postprandial lipemia and insulinemia.
2. EXPERIMENTAL METHODS
Subjects
diseases other than obesity, and eating disorders were considered exclusion criteria. Sixty-five men were included in the study. This study was conducted according to the guidelines laid down in the Declaration of Helsinki and all procedures involving human subjects were approved by the Ethical Committee in Human Research from Federal University of Viçosa, Brazil (protocol number 185/2011). All subjects provided written informed consent.
Study design
Sixty five men were randomized into three experimental groups: conventional peanuts (CVP, n=21), high-oleic peanuts (HOP, n=23), or control group (CT, n=21). Subjects were instructed not to consume alcohol, to refrain from heavy physical activity and to maintain a regular sleep-wake schedule (8 hours/night) during the three days prior to the experimental day. In addition, a standardized meal was given to the volunteers to be consumed the night before the test. This meal consisted of instant noodles (Nissin®), parmesan cheese (Santa Amália Alimentos®), and 200 ml of fruit juice (Sucos Tial®). It provided 731 kcal, 119 g of carbohydrate, 14 g of protein, and 23 g of fat. Volunteers attended the laboratory after a 10 h fast for all evaluations.
Anthropometrics, body composition and energy expenditure
Body weight, height, waist circumference, body composition and resting energy expenditure (REE) were assessed in the fasting state. Body fatness was measured through bioimpedance (model TBF-300, Tanita Corp., Arlington Heights, IL, USA). REE was measured for 30 min by indirect calorimetry (Deltatrac II, MBM-200; Datex-Engstrom Instrumentarium Corporation, Helsinki, Finland) following the protocol described by Alves et al. (2013).
Test meal
After initial evaluations in the fasting state, volunteers received the test meal. It was consumed within 15 min and consisted of a strawberry shake and 56 g of control biscuits or roasted conventional 886) or high-oleic (IAC-505) peanuts with skins.
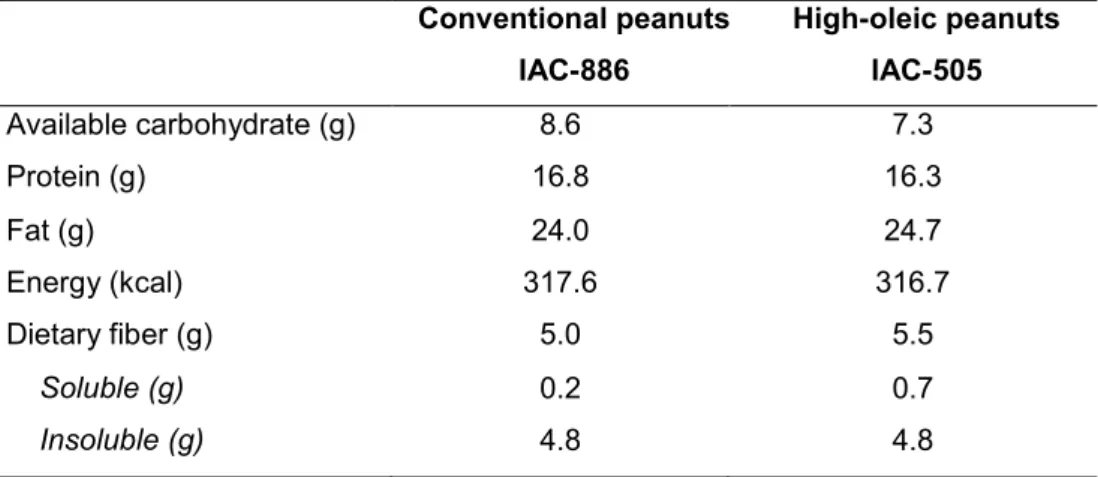
physical activity factor was determined through the International Physical activity Questionnaire (IPAQ) (Pardini et al., 2001). The meal provided similar volume and macronutrient contribution (35% carbohydrates, 16% proteins, and 49% fat). For the total group, this corresponded to a mean of 38.2 g of fat and 702 kcal. The minimum and maximum quantity of fat provided was 29.9 g and 50 g respectively, but it always represented 49% of the total energy of the meal. The shake was prepared with powder for preparation of a strawberry flavored drink (Nesquik®, Nestlé), whole milk powder (Indústria de Milho Anchieta Ltda), soybean oil (Leve®, IMCOPA S/A.), whey protein isolate (Bem Vital®), water, and ice. The nutrient composition of both types of peanuts was analyzed according to validated methods (AOAC, 1997; AOAC, 2003) (Table 1). The control biscuits were developed to provide similar quantities of macronutrients, fiber, and energy density to the mean composition of peanuts. The composition of the biscuits was also analyzed (AOAC, 1997; AOAC, 2003). The ingredients used to prepare the biscuits were: eggs, whey protein isolate (Bem Vital®), whole wheat flour (Vitao Alimentos Integrais), margarine (Sadia S/A.), hydrogenated vegetable shortening (Vida Alimentos Ltda), soybean oil (Leve®, IMCOPA S/A.), dietary fiber supplement (Bem Vital®), sesame seed (Yoki Alimentos S/A.), wheat bran (Granum Alimentos Integrais), salt (Cisne®), and powder yeast (Yoki Alimentos S/A). The fatty acid composition of peanuts and biscuits are shown in Table 2. The fatty acid methyl esters were determined by gas chromatography (Shimadzu, Japan) according to Folch et al. (1957) and Hartman & Lago (1973).
Table 1. Nutritional composition of 56 g of the conventional and high-oleic peanuts
Conventional peanuts IAC-886
High-oleic peanuts IAC-505
Available carbohydrate (g) 8.6 7.3
Protein (g) 16.8 16.3
Fat (g) 24.0 24.7
Energy (kcal) 317.6 316.7
Dietary fiber (g) 5.0 5.5
Table 2. Fatty acids composition (%) of the conventional peanuts, high-oleic
peanuts and control biscuits (Mean values and standard deviation)
(-): not detected.
Biochemical analysis
A catheter was introduced into an antecubital vein of the volunteers after REE measurement. Blood was collected in the fasting state and after 1, 2, and 3 h postprandially. Plasma-EDTA and serum were separated from blood through centrifugation (2.200 x g, 15 min, 4°C) and stored at -80ºC.
Serum glucose, total cholesterol, HDL, TAG, uric acid, aspartate aminotransferase (AST), alanine aminotransferase (ALT), gamma-glutamyltransferase (GGT) and alkaline phosphatase were analyzed through enzymatic colorimetric methods using commercial kits (Quibasa - Química Básica, Brazil) in a autoanalyzer (COBAS MIRA Plus; Roche Diagnostic Systems). High-sensitivity C-reactive protein (hsCRP) was also analyzed by a
Fatty acid Conventional Peanuts IAC 886 High-oleic Peanuts IAC 505 Control biscuits
Lauric acid (C12:0) - - 0.43 ± 0.19
Palmitic acid (C16:0) 8.78 ± 0.07 5.23 ± 0.14 12.76 ± 0.75
Heptadecanoic acid (C17:0) 0.46 ± 0.00 0.18 ± 0.00 0.27 ± 0.00
Stearic acid (C18:0) 2.14 ± 0.06 2.08 ± 0.07 8.08 ± 0.36
Elaidic acid (C18:1n9t) - - 7.11 ± 0.29
Oleic acid (C18:1n9) 50.96 ± 0.47 81.47 ± 1.03 35.16 ± 0.49
Linolelaidic acid (C18:2n6t) - - 0.96 ± 0.03
Linoleic acid (C18:2n6) 31.93 ± 0.21 3.87 ± 0.03 32.48 ± 1.19
Arachidic acid (C20:0) 0.82 ± 0.03 1.19 ± 0.02 0.53 ± 0.02
Gamma-Linolenic acid (C18:3n6) - - 0.16 ± 0.00
Eicosenoic acid (C20:1n9) 0.82 ± 0.03 1.45 ± 0.02 1.06 ± 0.07
Alpha-Linolenic acid (C18:3n3) 0.28 ± 0.03 0.44 ± 0.03 1.44 ± 0.16
Behenic acid (C22:0) 2.59 ± 0.19 2.68 ± 0.17 -
Erucic acid (C22:1n9) - 0.17 ± 0.02 -
Lignoceric acid (C24:0) 1.46 ± 0.05 1.65 ± 0.00 -
Total SFA 16.25 ± 0.40 13.01 ± 0.40 22.07 ± 1.31
Total MUFA 51.78 ± 0.50 83.09 ± 1.06 36.21 ± 0.56
Total PUFA 32.21 ± 0.23 4.30 ± 0.06 34.08 ± 1.35
commercial kit (Quibasa - Química Básica, Brazil) in an autoanalyzer by an immunotubidimetric assay.
LDL and VLDL concentrations were calculated according to Friedewald et al. (1972). Serum insulin concentrations were analyzed through electrochemiluminescence immunoassay (Elecsys-Modular E-170, Roche Diagnostics Systems). The homeostasis model assessment of insulin resistance (HOMA-IR) was calculated according to Matthews et al. (1985).
Fasting and postprandial plasma LPS concentrations were determined through a chromogenic method using a Limulus Amebocyte Lysate (LAL) commercial kit (Hycult Biotech, The Netherlands). Undiluted plasma samples were heated at 75ºC for 5 min to neutralize endotoxin inhibitors. Aliquots (50 µl) of plasma and standards were added to the pyrogen-free microplate. The LAL reagent (50 µl) was added in each well. After 30 min of incubation, absorbance was read at 405 nm (Multiskan Go, Thermo Scientific, USA). When the optical density of the standards 10 and 4 EU/ml differed by less than 10%, the reaction was interrupted by adding 50 µl of stop solution (acetic acid) and absorbance was read again. As absorbance is directly proportional to the concentration of endotoxin, a standard curve was used to calculate LPS concentration in the samples. The concentration of LPS was expressed as endotoxin units per milliliter (EU/ml).
Statistical analysis
Statistical analyses were performed with SAS software, version 9.2 (SAS Institute, Cary, NC, USA). Parametric and non-parametric tests were used based on normality testing (Shapiro-Wilk) and variance homogeneity (Levene) tests. A 5% level of significance was adopted. Data are represented as mean and standard error of the difference between means (SED) and delta (Δ = postprandial value – fasting value). Anthropometric, body composition, energy expenditure, and biochemical fasting variables from the three groups were compared using ANOVA with post hoc Tukey´s test or using Kruskal-Wallis with
post hoc Dunn´s test as appropriate. Repeated measures two-way ANOVA
was used to evaluate the associations between variables. After data analysis, the statistical power of the comparisons was calculated and values superior to 99% were found, confirming that the number of volunteers was sufficient to ensure the statistical power needed.
3. RESULTS
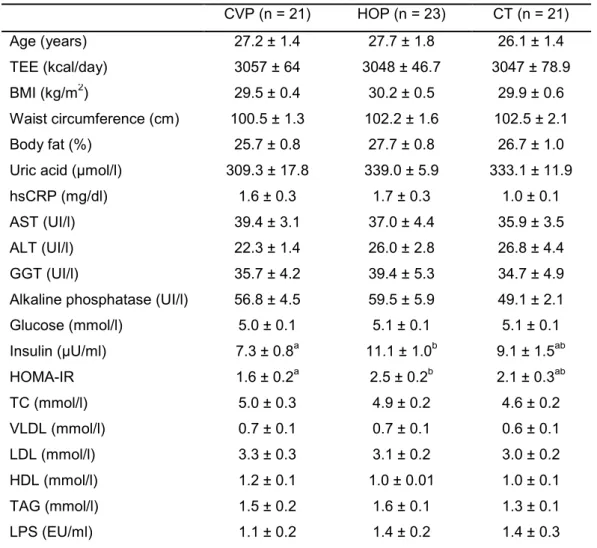
Baseline characterization
Table 3. Characterization of total energy expenditure, anthropometric, body composition, and biochemical variables from experimental groups in fasted state (Mean values and standard error of the difference between means)
CVP (n = 21) HOP (n = 23) CT (n = 21)
Age (years) 27.2 ± 1.4 27.7 ± 1.8 26.1 ± 1.4
TEE (kcal/day) 3057 ± 64 3048 ± 46.7 3047 ± 78.9
BMI (kg/m2) 29.5 ± 0.4 30.2 ± 0.5 29.9 ± 0.6
Waist circumference (cm) 100.5 ± 1.3 102.2 ± 1.6 102.5 ± 2.1
Body fat (%) 25.7 ± 0.8 27.7 ± 0.8 26.7 ± 1.0
Uric acid (µmol/l) 309.3 ± 17.8 339.0 ± 5.9 333.1 ± 11.9
hsCRP (mg/dl) 1.6 ± 0.3 1.7 ± 0.3 1.0 ± 0.1
AST (UI/l) 39.4 ± 3.1 37.0 ± 4.4 35.9 ± 3.5
ALT (UI/l) 22.3 ± 1.4 26.0 ± 2.8 26.8 ± 4.4
GGT (UI/l) 35.7 ± 4.2 39.4 ± 5.3 34.7 ± 4.9
Alkaline phosphatase (UI/l) 56.8 ± 4.5 59.5 ± 5.9 49.1 ± 2.1
Glucose (mmol/l) 5.0 ± 0.1 5.1 ± 0.1 5.1 ± 0.1
Insulin (µU/ml) 7.3 ± 0.8a 11.1 ± 1.0b 9.1 ± 1.5ab
HOMA-IR 1.6 ± 0.2a 2.5 ± 0.2b 2.1 ± 0.3ab
TC (mmol/l) 5.0 ± 0.3 4.9 ± 0.2 4.6 ± 0.2
VLDL (mmol/l) 0.7 ± 0.1 0.7 ± 0.1 0.6 ± 0.1
LDL (mmol/l) 3.3 ± 0.3 3.1 ± 0.2 3.0 ± 0.2
HDL (mmol/l) 1.2 ± 0.1 1.0 ± 0.01 1.0 ± 0.1
TAG (mmol/l) 1.5 ± 0.2 1.6 ± 0.1 1.3 ± 0.1
LPS (EU/ml) 1.1 ± 0.2 1.4 ± 0.2 1.4 ± 0.3
Different letters in the same line indicate statistical difference (p≤0.05) between groups (ANOVA or