Quim. Nova, Vol. 35, No. 3, 473-476, 2012
Artigo
*e-mail: ejnassar@unifran.br
†In Memoriam
SYNTHESIS OF INDIUM TIN OXIDE NANOPARTICLES BY A NONHYDROLYTIC SOL-GEL METHOD
Gabriel M. Silva†, Emerson H. de Faria, Eduardo J. Nassar*, Katia J. Ciuffi e Paulo S. Calefi
Universidade de Franca, Av. Dr. Armando Salles Oliveira, 201, 14404-600, Franca - SP, Brasil
Recebido em 31/3/11; aceito em 20/9/11; publicado na web em 6/12/11
Indium tin oxide nanoparticles were synthesized in two different sizes by a nonhydrolytic sol-gel method. These powders were then transformed into ITO via an intermediate metastable state at between 300 and 600 ºC. The presence of characteristic O-In-O and O-Sn-O bands at 480 and 670 cm-1 confirmed the formation of ITO. The X-ray diffraction patterns indicated the preferential formation
of metastable hexagonal phase ITO (corundum type) as opposed to cubic phase ITO when the reflux time was less than 3 h and the heat treatment temperature was below 600 ºC. Particle morphology and crystal size were examined by scanning electron microscopy.
Keywords: ITO; sol-gel nonhydrolitic; nanoparticles.
INTRODUCTION
ITO is a mixed indium and tin oxide whose composition may vary depending on its application, but which typically consists of 80 to 90% indium oxide with the remainder corresponding to tin IV oxide. This material shows very good conductivity and transmission performance allied to excellent stability, reproducibility and morphology. It has optical and electronic applications in devices such as solar cells, gas sensors, organic electroluminescent devices, functional glasses, ther-mal mirrors and solid electrolyte cells. In thin film form, it possesses high electrical conductivity and transparency in the visible region, combined with low electrical resistance.1-3
ITO particles have been obtained by various techniques, such as thermal hydrolysis, thermal decomposition, spray pyrolysis, and coprecipitation.4-7 However, these methods have not proved very successful in obtaining nanometric particles due to the high degree of agglomeration presented by the oxide. Other methods that have been used include direct precipitation, co-precipitation, and hydro-thermal methods, but these do not allow for control of the particle size distribution.
New techniques for obtaining metal oxides with controlled morphological characteristics have recently been developed. Among these techniques, the sol-gel method stands out for its advantages, such as the possibility of obtaining high purity materials using simple equipment.7-12 Another advantage of the sol-gel method is the ability to process the material in the form of thin films, which, in the par-ticular case of ITO, is the only technique that allows for deposition on relatively large substrates at a feasible cost.13,14
The sol-gel methodology comprises wet and dry routes. One of the dry routes is the sol-gel method for nonhydrolytic gels (NHG), developed in the 1990s as an alternative to the hydrolytic sol-gel route.7-10 One of the advantages of the NHG method is the greater homogeneity achieved for heterometallic oxides, not easily achieved by the hydrolytic sol-gel route due to the different reactivities of their alkoxides.9-12 Promising results have been obtained through the NGH method, which not only allows for greater reproducibility but also involves the use of less expensive precursors, thus representing lower costs and better quality.9-11,15,16
The nonhydrolytic sol-gel process used in this work is an adapta-tion of the NGH method used by other research groups.7,8,10,12,15 The
process is run in an open system, with an inert atmosphere produced by means of constant bubbling of argon, using the oxygen donor itself as a solvent.9,11,15,16
This work studied the synthesis of ITO in xerogel form, using the nonhydrolytic sol-gel process. The parameters studied were influence of reflux time and heat treatment temperature. The samples obtained were characterized by thermogravimetric analyses (TG/DTG and DTA), infrared absorption spectroscopy (FTIR), X-ray diffraction (XRD), and scanning electron microscopy (SEM).
EXPERIMENTAL
The ITO was prepared by keeping 27 mmol of InCl3 and 3 mmol of SnCl4 in 100 mL of ethanol anhydrous under reflux for 5 h in an argon atmosphere, similarly to the procedure employed in other stu-dies conducteds by our group.9,10 To study the effect of reflux time, aliquots of the material were removed at 1 h intervals. The xerogel was obtained by evaporation of the solvent and presented the greenish hue typical of InOOH and In(OH)3.1 To study the temperature of ITO formation, after determining the mass loss temperatures based on the TG and DTG curves, the xerogel obtained after 4 h of reflux was heat-treated for 2 h at 300, 530, 600 and 850 ºC. For the study of the reflux time, the materials were kept at 600 ºC for 2 h. The resultant materials were then characterized by XRD, FTIR and SEM.
The thermal analyses (TG/DTG and DTA) were carried out with an SDT Q600 -imultaneous DTA-TGanalyzer (TA Instruments), applying a heating rate of 20 ºC/min. The X-ray diffractograms were obtained on a Rigaku Miniflex diffractometer with Cu Kα
(λ = 1.54 Å) monochromatic radiation, at a scan step of 0.02º. The infrared absorption spectra were measured in a Bomem MB 100 spectrophotometer with Fourier transform using KBr pellets. The SEM micrographs were obtained in the structural characterization laboratory of DEMa-UFSCar, using a Philips XL 30 FEG scanning electron microscope.
RESULTS AND DISCUSSION
Silva et al.
474 Quim. Nova
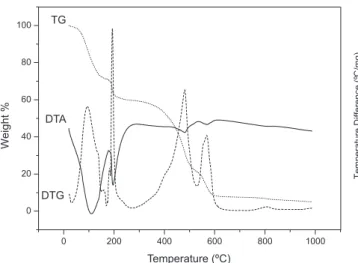
dehydroxylation and conversion of the hydroxides into oxides. The last stage, centered at 800 ºC, can be attributed to particle growth or phase change, as reported by Li et al..17 The percentage of mass loss between 35 and 250 ºC representeds 40.02%, and that above 480 ºC correspondeds to 54.64%. In the initial system, the precursors InCl3 and SnCl2 comprise 7.97% of the weight, whereas ethanol compriseds 92.02% of the weight. Therefore, one mol of chloride produced ½ mol of oxide, namely the In2O3:Sn final product, and theoretically the final residue would be ITO, accounting for 4.15% of the initial weight. The experimental TG curve evidenceds a final residue corresponding to 5.35 and 94.65% of total weight loss, which was in agreement with the theoretical value. The powder yielded by the heat treatment at 850 ºC was yellowish, typical of the cubic phase of ITO.1,18
The DTG curve can provide the speed of the decomposition as a function of the decomposed fraction. The first and second stages have decomposition speeds (0.49 and 0.40, respectively) that are lower than those of the third and four stages (0.72). This lower speed value can be ascribed to the large amount of solvent that is evaporated, as discussed for the DTA curve.
The DTA curve displays broad endothermic peaks. There is a reduction in the area under these peaks, which is consistent with the amount of decomposed material. The first peak has the largest area and can be ascribed to solvent evaporation. The decrease in the area of other peaks may be due to decomposition of the residual organic molecules and dehydroxylation accompanied by loss of water.
Figure 2 shows the infrared absorption spectra of the samples used to examine the effect of the heat treatment. The bands at 1615 and 3435/3450 cm-1 indicated the presence of water and/or ethanol adsorbed. The bands at 486, 875 and 1405 cm-1, which were attributed to HO-In=O, In-OH and Sn-OH, respectively, disappeared when the samples were treated at temperatures above 300 ºC. The intensity of the band at 1100 cm-1, which appeared in the spectrum of the sample treated at 530 ºC and diminished in the spectra of samples treated at higher temperatures, was attributed to the In-OH surface groups. The spectra of the samples treated at 530, 600 and 850 ºC showed the characteristic bands of crystalline In2O3. The appearance of bands in the regions of 1510 to 1750 and 3740 to 3860 cm-1 in the spectra of samples treated at 530 and 600 ºC, and disappearance for sample trea-ted at 850 ºC, indicatrea-ted the formation of intermediate material. Taken together this evidence leads us to propose that the transformation of oxihydroxide into oxide begins at temperatures below 300 ºC.1,3,19-21 Table 1 depicts the attributions of the bands observed in the spectra. The materials heat-treated at 530, 600 and 850 ºC were charac-terized by X-ray diffraction (Figure 3).
Figure 1. Thermogravimetric analysis of the xerogel in a nitrogen atmosphere
Table 1. Assignment of the FTIR bands of the samples employed in the study
of the effect of heat treatment1,3,18,22
Assignment band (cm-1)
xerogel 300 ºC 530 ºC 600 ºC 850 ºC
HO-In=O 486 483
ITO 449 456 477
540 540 540
564 566 570 603 600 609
In-OH 875 875
H2O(adsorbed) 1615 1615
In-OH(surface groups) 1100 1100
Sn-OH 1405
In-OH 1512 1518
1546 1546
1648 1651 1699 1699 1693
1740 1740 1740
OH(alcohol and/or water) 3450 3450 3435
In-OH and/or Sn-OH 3746 3746 3746
3833 3833 3833 3860 3860 3860
Figure 2. Infrared absorption spectra of samples treated at different tempe-ratures: (a) without heat treatment, (b) at 300 ºC, (c) at 530 ºC, (d) at 600 ºC, and (e) at 850 ºC
Synthesis of indium tin oxide nanoparticles by a nonhydrolytic sol-gel method 475 Vol. 35, No. 3
Figure 3. X-ray diffractograms of the samples treated at 530, 600 and 850 ºC Figure 4. X-ray diffractograms of the samples with different reflux times, treated at 600 ºC
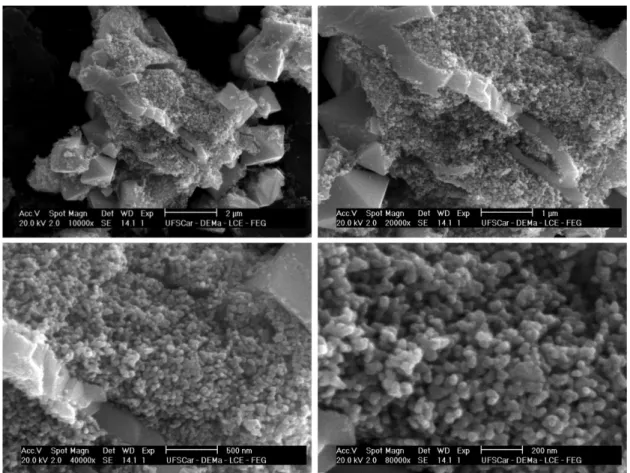
Figure 5. SEM micrographs, with different magnitudes, of the ITO xerogel obtained after 4 h of reflux and heat-treated at 600 ºC cubic phase ITO involved the formation of hexagonal and metastable
In2O3 at temperatures between 480 and 600 ºC.21
The absence of lines characteristic of InOOl17 indicates the non-formation of this material. The presence of fine lines in the diffrac-togram indicates the high crystallinity of the materials.
Figure 4 shows the X-ray diffractograms of samples subjected to different reflux times.
The materials obtained from 1 and 2 h of reflux showed peaks characteristic of cubic and hexagonal (metastable) In2O3, while the materials obtained with longer reflux times showed only peaks related to the cubic phase.17,18,21,22
The results obtained in this study are consistent with those re-ported by Yu et al.,21 who concluded that if the reaction time is short or the heat treatment temperature insufficient, the end product is a mixture of cubic and hexagonal In2O3.
Scanning electron microscopy was used to study the particle morphology of ITO. Figure 5 shows micrographs, in different mag-nitudes, of the sample treated at 600 ºC.
Silva et al.
476 Quim. Nova
the nanoparticles resemble those obtained by Han et al.,23 who used a combination of the sol-gel and combustion methods. The cuboid--shaped nanoparticles were approximately 40 nm by SEM, but the ITO particles can be calculated using the Scherrer equation, on the basis of XRD results. The crystallite size of the crystal planes (222) and (440) was 43 and 46 nm, respectively, consistent with SEM results.
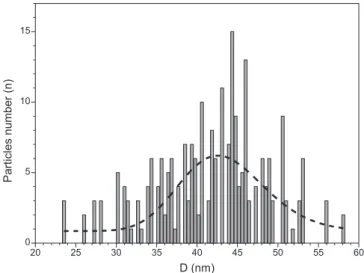
Figure 6 depicts typical size distributions for the samples. The maximal distributions agree with the values obtained by the Scherrer equation.
CONCLUSION
Indium tin oxide nanoparticles were prepared by the no-nhydrolytic sol-gel method, resulting in a solid of high crystallinity and color characteristic of ITO. The results indicated that 3 h of reflux and heat treatment below 500 ºC lead to the formation of the mixed oxide. This low temperature, allied with the low cost of the precursors (chlorides) and the fact that the synthesis without thermal treatment produces a colloidal suspension of precursor of ITO, opens up new prospects for the large-scale use of this method to produce films at lower costs than the traditional methods.
ACKNOWLEDGMENTS
The authors gratefully acknowledge the financial support of the Figure 6. Typical size distributions for the ITO xerogel obtained after 4 h of reflux and heat-treated at 600 ºC. The line is just a guide to facilitate visua-lization of particle size distribution (n > 235 for the samples)
Brazilian research funding agencies Fundação de Amparo à Pesquisa do Estado de São Paulo (FAPESP), Conselho Nacinonal de Desen-volvimento Científico e Tecnológico (CNPq), and Coordenação de Aperfeiçoamento de Pessoal de Nível Superior (CAPES).
REFERENCES
1. Pramanik, N. C.; Das, S.; Biswas, P. K.; Mater. Lett.2002, 26, 671. 2. Ba, J.; Rohlfing, D. F.; Feldhoff, A.; Brezesinski, T.; Djerdj, I.; Wark,
M.; Niederberger, M.; Chem. Mater.2006, 18, 2848. 3. Ho, W. H.; Yen, S. K.; Thin Solid Films. 2006, 498, 80. 4. Xu, H.; Yu, A.; Mater. Lett.2007, 61, 4043.
5. Jang, H. D.; Seong, C. M.; Chang, H. K.; Kim, H. C.; Current Applied Physics2006, 6, 1044.
6. Song, J. E.; Lee, D. K.; Kim, H. W.; Kim, Y. I.; Kang, Y. S.; Colloids Surf. A2005, 257, 539.
7. Bouget, L.; Corriu, R. J. P.; Leclercq, D.; Mutin, P. H.; Vioux, A.; J. Non-Cryst. Solids1998, 242, 81.
8. Mutin, P. H.; Vioux, A.; Chem. Mater.2009, 21, 582.
9. de Lima, O. J.; Aguirre, D. P.; Oliveira, D. C.; Silva, M. A.; Mello, C.; Leite, C. A. P.; Sacco, H. C.; Ciuffi, K. J.; J. Mater. Chem.2001, 11, 2476.
10. Vioux, A.; Chem. Mater. 1997, 9, 2292.
11. Caetano, B. L.; Rocha, L. A.; Molina, E.; Rocha, Z. N.; Ricci, G.; Calefi, P. S.; de Lima, O. J.; Mello, C.; Nassar, E. J.; Ciuffi, K. J.; Appl. Catal. A2006, 311, 122.
12. Niederberger, M.; Acc. Chem. Res.2007, 40, 793.
13. De, A.; Biswas, P. K.; Manara, J.; Mater. Charact.2007, 58, 629. 14. Legnani, C.; Lima, S. A. M.; Oliveira, H. H. S.; Quirino, W. G.;
Macha-do, R.; Santos, R. M.; Davolos, M. R.; Achete, C. A.; Cremona, M.; Thin Solid Films.2007, 516, 193.
15. Acosta, S.; Corriu, R. J. P.; Leclercq, D.; Lefèvre, P.; Mutin, P. H.; Vioux, A.; J. Non-Cryst. Solids1994, 170, 234.
16. Nassar, E. J.; Pereira, P. F. S.; Nassor, E. C. O.; Avila, L. R.; Ciuffi, K. J.; Calefi, P. S.; J. Mater. Sci. 2007, 42, 2244.
17. Yang, H.; Zhao, H.; Dong, H.; Yang, W.; Chen, D.; Mater. Res. Bull.
2009, 44, 1148.
18. Lee, J-S.; Choi, S-C.; J. Eur. Ceram. Soc.2005, 25, 3307. 19. Lin, S-E.; Wei, W-C. J.; J. Am. Ceram. Soc.2008, 28, 1121.
20. Neri, G.; Bonavita, A.; Micali, G.; Rizzo, G.; Pinna, N.; Niederberger, M.; Ba, J.; Sens. Actuators, B2008, 130, 222.
21. Yu, D.; Wang, D.; Qian, Y.; J. Solid State Chem.2004, 177, 1230. 22. Li, S.; Qiao, X.; Chem, J.; Wang, H.; Jia, F.; Qiu, X.; J. Cryst. Growth
2006,289, 151.