Titanium Dioxide Nanoparticles: Synthesis, X-Ray Line Analysis and Chemical Composition
Study
Hossein Mahmoudi Chenaria*, Christoph Seibelb,c, Dirk Hauschildb,c, Friedrich Reinertb,c, Hossein
Abdollahiand
Received: April 08, 2016; Revised: July 25, 2016; Accepted: August 26, 2016
TiO2 nanoparticleshave been synthesized by the sol-gel method using titanium alkoxide and isopropanolas a precursor. The structural properties and chemical composition of the TiO2 nanoparticles
were studied usingX-ray difraction, scanning electron microscopy, and X-ray photoelectron spectroscopy.The X-ray powder difraction pattern conirms that the particles are mainly composed of
the anatase phase with the preferential orientation along [101] direction. The physical parameters such as strain, stress and energy density were investigated from the Williamson- Hall (W-H) plot assuming a uniform deformation model (UDM), and uniform deformation energy density model (UDEDM). The W-H analysis shows an anisotropic nature of the strain in nanopowders. The scanning electron microscopy image shows clear TiO2 nanoparticles with particle sizes varying from 60 to 80nm. The results of mean particle size of TiO2 nanoparticles show an inter correlation with the W-H analysis and SEM results. Our X-ray photoelectron spectroscopy spectra show that nearly a complete amount of titanium has reacted to TiO2.
Keywords: TiO2;Nanoparticles;X-ray analysis;SEM;XPS
* e-mail: [email protected] and [email protected]
1. Introduction
Nanometer-scale materials have recently attracted
considerable scientiic attention because of their beneicial
high surface to volume ratio and therefore unique chemical, electronic, and physical properties. In particular TiO2 nanoparticles are in the focus of research and thus many reports on electrical, optical, and structural properties of TiO2 nanoparticles can be found1-4. B. Sathyaseelanet al.5
investigated structural, optical and morphological properties of post-growth calcined TiO2 nanopowder. The size dependent
relective properties of TiO2 nanoparticles synthesizedusing
arc discharge method were studied by F. Fang et al.6
Nano-crystalline TiO2 is a promising candidate for a wide range of applications such as photocatalysis, solar cells, dielectric materials, and photoconductors7-10. Modiication of TiO
2 with
metal and nonmetal elements has received much attention and Doped TiO2 nanoparticles exhibit novel properties and according to impurity type, dopants improve the physical and optoelctronic paroperties of TiO2 nanoparticles. For instance, K. Kaviyarasu et al.11 reported the fabrication, optical and
microscopic studies of magnesium doped TiO2 NCs .optical,
structural, and electronic properties of carbon-modiied
titanium dioxide nanoparticles synthesized by ultrasonic
nebulizer spray pyrolysis have been investigated by R. Taziwa et al.12 S. Ivanov et al.13 studied one-step synthesis of
TiO2 nanoparticles based on the interaction between thiourea and metatitanic acid and reported the photocatalytic activity of the doped SC-TiO2 powders. TiO2 nanoparticles in both
powder and ilm form can be synthesized using various
methods such as chemical vapor deposition14, chemical spray
pyrolysis15, sol-gel technique16, hydrothermal treatment17, and
arc discharge method18. In this paper, the sol-gel technique
has been successfully employed to synthesize TiO2 particles on the nanometer scale.
Most of the research reports on the structural properties of nanoparticles dealt with the determination of structure
type, physical and diferent microstructural parameters. X-ray difraction line broadening studies give more useful
information about the physical parameters such as crystallite size, dislocation density and strain.There are many analytical methods to evaluate the microstructure properties of materials such as the Scherrer’s equation19, Williamson –Hall analysis20,
the integral breadth method21 and size strain plot method22.
This study highlightsthe microstructure analysis and chemical composition of TiO2 nanoparticles. Whereas only a few reports on TiO2 nano-crystals perform X-ray photoelectron spectroscopy (XPS)23-26.
a Department of Physics, Faculty of Science, University of Guilan, Namjoo Ave, Po Box 41335-1914, Rasht, Iran b Experimental Physics VII and Röntgen Research Center for Complex Materials - RCCM, Universität
Würzburg, Am Hubland, D-97074 Würzburg, Germany
c Karlsruhe Institute of Technology - KIT, Gemeinschaftslabor für Nanoanalytik, D-76021 Karlsruhe, Germany
In this work, TiO2 nanocrystals were prepared by a simple sol-gel method. A structural characterization and chemical
composition study was performed by X-ray difraction,
scanning electron microscopy, and X-ray photoelectron spectroscopy. We give more information on strain-stress and the energy density of crystal by using the Williamson- Hall procedure. We also include a quantitative analysis of chemical composition of a very successful synthesized nanoparticle by surface sensitive XPS known as electron spectroscopy for chemical analysis (ESCA). The measurements suggest that nearly a complete amount of titanium has reacted to TiO2.
2. Experimental Methods
2.1. Preparation
The preparation of TiO2 nanoparticles was performed by the sol-gel method as follows:
The high reactivity of alkoxides in the presence of water or solutions containing isopropanol causes a formation of three-dimensional oxide networks, producing metal hydroxides (i) or hydrated oxides (ii). Hence, the general chemical reactions are given by the following equations:
2.2. Characterization techniques
The bulk sensitive X-ray difraction (XRD) patterns were taken with Philips X’Pertdifractometerat room temperature using monochromatic Cu Kα (hν=8042.55 eV) excitation.
Measurements were taken under beam acceleration conditions
of 40 kV/35 mA. Whereas the surface sensitive X-ray
photoelectron spectroscopy (XPS) measurements were
performed under ultra-high vacuum (UHV) condition, in a
system exhibiting a base pressure of better than 2×10⁻¹⁰ mbar.
In order to study the chemical state of titanium and oxygen in the nanoparticles we used a standard non-monochromatized
Mg Kα (hν = 1253.6 eV) X-ray source and a VG Clam 4
electron spectrometer. The spectra were corrected for X-ray satellites and secondary electron background (Shirley30) prior
to analysis. Scanning electron microscopy (SEM) images
of the same samples were recorded with a LED-1430VP microscope using an electron beam energy of 15 keV and
a beam current of 2.62 A.
3. Results and Discussion
3.1. X-ray analysis
X-ray proile analysis is apowerfultoolin extracting
the microstructure information of nanocrystallinesamples. Figure 1 shows the XRD pattern of TiO2 nanoparticles, in
the 2θ range of 10–70°.The difraction peaks corresponding
to the (1 0 1), (0 0 4), (2 0 0), (1 0 5), (2 1 1), (2 0 4) and
(1 0 6) crystal planes with the lattice constants a = 3.755 Å
and c = 9.5114Å conirms the anatase phases of the TiO2
nanoparticles according to the JCPDS ile 21-1272 31. X-ray
difraction proiles are usually inluenced by crystallite size
and lattice strain. According to the W-H method the individual contribution due to the size and strain can be expressed as17
, ( )
Ti OR H O Ti OH
ROH hydrolysis I 4
4
4+ 2 " 4+
Q R
Q V
W V
, ( )
Ti OH TiO H O
x H O condensation II 2
4 2 2
2
" # +
-Q Q
Q V
V
V
Where R is ethyl, i-propyl, n-butyl, etc.27. The molar
ratio of water to titanium strongly afects the stability,
shape, size, and morphology of the produced alkoxide-sol. Also the size distribution of nanoparticles is dependent on the pH of solution28. Due to the high reactivity of titanium
alkoxide (Ti{OCH(CH3)2}4), 10 ml of this precursor was diluted with 40 ml of isopropanol (C3H7OH) at room temperature in a dry atmosphere with about 8 %relative humidity. The mixture was then added dropwise into a solution that consist of deionized water and isopropanol in a 1:1 ratio. For adjustment of the pH valuehydrochloric acid and ammonium hydroxide were added, respectively. With this addition, the acidity-alkalinity of the gel was stabilized to a pH value of 3. Subsequently, the solution was vigorously stirred for 30 minutes and a yellowish gel was formed. Afterwards, the prepared materials were washed with ethanol and the obtained gel was then dried at
120°C for two hours. A Scientiic furnace(NaberthermLVD 73/23/EC) was used for calcinations of the synthesized materials at 450°C for four hours29. The resulting product
was TiO2 nanopowder. We will now begin to discuss the results of the structure analysis and the chemical composition measurements.
Bhkl=BS+bD Q V1
/ sin
B Coshkl i=
Q
km DV
+4f i Q2VWhere ε is the strain and D is the average crystallite
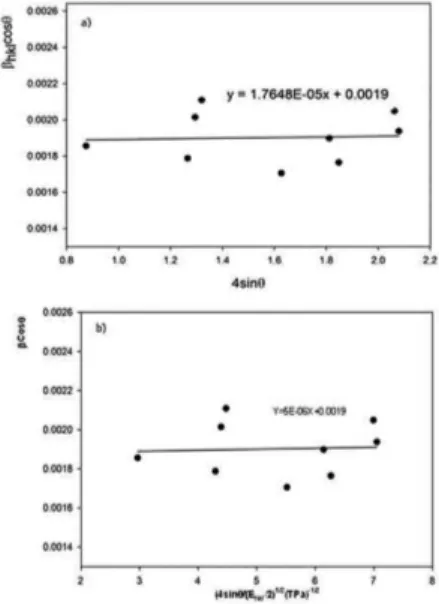
size of a x-ray peak. Βhklis the peak width at half-maximum intensity and Βs, βD are the peak broadeningduetothe crystallite size and lattice strain,respectively.In the Eq. 2 the strain was assumed to be uniform in all crystallographic direction implying a uniform deformation model (‘UDM’). Figure 2
(a) shows the UDM analysis.The efective crystallite size
can be estimated from the extrapolation of Βhkl cosθ versus
4sinθ and the slop of the itted line represents the strain.Inthe
uniform deformation energy density model (UDEDM)has
been replaced by ε=σ/E in equation (2); where σ is the stress
of crystal and E is the modulus of elasticity in the direction
moduli E, for the TiO2 anatase–tetragonal assumed to be
≈174 GPa32. In the modiied form of W-H equation called
(UDEDM) model, the strain energy density u is considered and the modulus of elasticity is no longer independent. The
energy density u can be determined from u=(ε2E)/2 using
Hooke’s law. Then equation (2) can be modiied again
according to the energy density as
/ / sin
B Cos k D
u E
4 2 / 3
hkl
hkl1 2 #
i m
i
= +
R
Q
Q
Q
V
V
W V
In this model Βhkl cosθ were plotted against 4 sinθ / (Ehkl/2)1/2. The anisotropic energy density (u) from the slope
of itted line and the crystallite size calculated from the
y-intercept; see Figure 2(b). The results obtained from the UDM and UDEDM models are collected in Table 1.As it is evidentfromTable1, the mean crystallite sizes obtained from the W-H models are more or less similar implying
that strain in diferent form has very small contribution on
the mean crystallite size.
Figure 1: X-raydifraction pattern of TiO2 nanoparticles
Figure 2: The W-H analysis of TiO2 nanoparticles assuming (a)
UDM, and (b) UDEDM model.
Table 1: Micro structural parameters of TiO2 nanoparticles.
UDM model UDEDM model
D ε D u ε σ (MPa)
(nm) (no unit) (nm) (Kj.m-3) (no unit)
72.2 2×10⁻⁵ 72.2 5.2054 5.469×10⁻⁶ 0.952
3.2. SEManalysis
Figure 3 shows SEM image obtained from the titanium oxide nanoparticles. The structure of this particle cluster
consisting of agglomerated nanoparticles can be identiied
as a non-ordered and porous. In Figure 3,two particle sizes were exemplarily determined, exhibiting width of 64.82 nm (Pa 1) and 74.08 nm (Pa2). In general, the width of the nanoparticles varies from 60 to 80nm.
Figure 3: SEM image of theTiO2 nanoparticles.
3.3. X-ray photoelectron spectroscopy
The powder was prepared ex-situ before transferring to the
UHV chamber. Subsequent, X-ray photoelectron spectroscopy
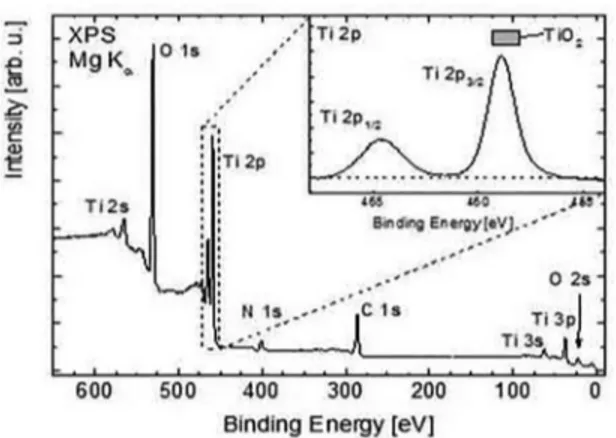
was performed and a survey scan of TiO2 nanopowder is
presented in Figure 4. To compensate charging efects, we calibrated the C1s peak to 286.0 eV since at this certain
binding energy C-N and C-O bonds overlap energetically [25].The spectrum is dominated by the signals of Ti and O. The binding energies of the spin-orbit split Ti2p1/2,3/2 (464.6 eV
and 458.9 eV, respectively) signals,as well as the O 1s (530.7 eV) level are corresponding to the titanium dioxide chemical environment (see Table 2).In addition, we ind a signiicant
evolution of the crystallite size and the microstrain was studied using the X-ray peak broadening analysis by the Williamson–Hall method. The obtained mean crystallite size of TiO2 nanoparticles show an inter correlation with the value obtained from the W-H analysis and SEM results.The results of the surface sensitive X-ray photoelectron spectroscopy measurements indicate that nearly the complete amount of titanium has reacted to TiO2.
5. Acknowledgments
The authors would like to acknowledge the Experimental
Physics VII and Röntgen Research Center for Complex
Materials (RCCM),UniversitätWürzburg, Am Hubland,
D-97074 Würzburg, Germany and University of Guilan
Research Council for the support of this work.
6. References
1. Harizanov O, Harizanova A. Development and investigation of sol–gel solutions for the formation of TiO2 coatings. Solar Energy Materialsand Solar Cells. 2000;63(2):185-195.
2. Li B, Wang X, Yan M, Li L. Preparation and characterization of nano-TiO2 powder. Materials Chemistry and Physics. 2002;78(1):184-188.
3. Kitiyanan A, Ngamsinlapasathian S, Pavasupree S, Yoshikawa S. The preparation and characterization of nanostructured TiO2– ZrO2 mixed oxide electrode for eicient dye-sensitized solar cells. Journal of Solid State Chemistry. 2005;178(4):1044-1048.
4. Yu C, Park J. Thermal annealing synthesis of titanium-dioxide nanowire–nanoparticle hetero-structures. Journal of Solid State Chemistry. 2010;183(10):2268-2273.
5. Sathyaseelan B, Manikandan E, Lakshmanan V, Baskaran I, Sivakumar K, Ladchumananandasivam R, et al. Structural, optical and morphological properties of post-growth calcined TiO2 nanopowder for opto-electronic device application: Ex-situ
studies. Journal of Alloys and Compounds. 2016;671:486-492.
6. Fang F, Kennedy J, Carder D, Futter J, Rubanov S. Investigations of near infrared relective behaviour of TiO2 nanopowders synthesized
by arc discharge. Optical Materials. 2014;36(7):1260-1265.
7. Santangelo S, Messina G, Faggio G, Donato A, De Luca L, Donato N, et al. Micro-Ramananalysis of titanium oxide/carbonnanotubes-based nanocomposites for hydrogen sensing applications.
Journal of Solid State Chemistry. 2010;183(10):2451-2455.
8. Morris D, Egdell RG. Application of V-doped TiO2 as a
sensor for detection of SO2. Journal of Materials Chemistry. 2001;11:3207-3210.
9. Xu X, Zhao J, Jiang D, Kong J, Liu B, Deng J. TiO2 sol-gel derived
amperometric biosensor for H2O2 on the electropolymerized phenazine methosulfate modiied electrode. Analytical and Bioanalytical Chemistry. 2002;374(7):1261-1266.
10. Ding Z, Hu X, Lu GQ, Yue PL, Greenield PF. Novel Silica Gel Supported TiO2 Photocatalyst Synthesized by CVD Method.
Langmuir. 2000;16(15):6216-6222.
Figure 4: X-ray photoemission spectrum of TiO2 nanoparticles
taken at room temperature using a Mg X-ray source.
Table 2: Energetic positions of the Ti 2p1/2, Ti 2p3/2, and O 1s of the
investigated nanoparticle sample and adsorbate. Literature values are added for comparison.
Element Orbital EB, Exp (eV) EB, Lit (eV) Titanium 2p1/2 464.6 464.3 34, 464.4 35
Titanium 2p3/2 458.9 458.8 34,35
Oxygen 1s 530.7 529.6 34, 528.4 35
section26, the inelastic mean free path33, and the transmission
function T ~ Ekin-0.6of our electron spectrometer. Hence, we
determined a total Ti:O ratio of 1:(2.2 ± 0.4). We explain the slightly surplus of the oxygen content with adsorbents like COx and hydro carbons. A detailed analysis of the O1s signal reveals a small deviation from its intrinsic lineshape, which indicates several oxygen species. However, it is beyond the aim of this paper to evaluate their individual quantities and to assign them to certain contaminations.The inset of Figure 4 shows the detailed measurement of the Ti 2p region with the
spin-orbit split doublet peaks at 463.9 eV and 458.2 eV for Ti
2p1/2 and Ti 2p3/2, respectively. A comparison of the obtained binding energies to the respective literature values for Ti 2p shows a good agreement between the binding energy of the main spectral 2p component and the one of pure TiO2 (see Table 2)34,35. Furthermore, the absence of a signal at lower
binding energies of approximately 453.8 eV36 indicates that
during the synthesis in the frame of measurement accuracy and probing depth all Ti atoms have fully reacted to titanium dioxide. The inset shows a detailed spectrum of the Ti 2p signal with a subtracted Shirley background and therefore a dashed horizontal line indicates the base line. The grey bar represents the reported Ti 2p3/2 binding energy values for TiO235.
4. Conclusions
In this study, we have successfully prepared titanium dioxide nanoparticles applying sol-gel technique. The
performed X-ray difraction measurement suggests that the
11. Kaviyarasu K, Premanand D, Kennedy J, Manikandan E. Synthesis of mg doped TiO2 nanocrystals prepared by wet-chemical method: optical and microscopic studies. International Journal of Nanoscience.2013;12(5):1350033.
12. Taziw R, Meyer EL, Sideras-Haddad E, Erasmus RM, Manikandan E, Mwakikunga BW. Efect of Carbon Modiication on the Electrical, Structural, and Optical Properties of TiO2 Electrodes and Their Performance in Labscale Dye-Sensitized Solar Cells.
International Journal of Photoenergy. 2012;2012:904323.
13. Ivanov S, Barylyak A,Besaha K, Bund A, Bobitski Y, Wojnarowska-Nowak R, et al. Synthesis, Characterization, and Photocatalytic Properties of Sulfur- and Carbon-Codoped TiO2 Nanoparticles.
Nanoscale Research Letters. 2016;11:140.
14. Wang Y, HaoY, Cheng H, Ma J, Xu B, Li W, et al.The photoelectrochemistry of transition metal-ion-doped TiO2 nanocrystalline electrodes and higher solar cell conversion eiciency based on Zn2+-doped TiO2 electrode. Journal of
Materials Science. 1999;34(12):2773-2779.
15. Li X, Chen G, Po-Lock Y, Kutal C. Photocatalytic oxidation of cyclohexane over TiO2 nanoparticles by molecular oxygen under mild conditions. Journal of Chemical Technology and Biotechnology. 2003;78(12):1246-1251.
16. Hemissi M, Amardjia-Adnani H.Optical and Structural properties of titanium oxide thin ilms prepared by sol-gel methods. Digest Journal of Nanomaterials and Biostructures. 2007;2(4):299-305.
17. Reddy KM, Manurama SV, Reddy AR. Bandgap studies on anatase titanium dioxide nanoparticles. Materials Chemistry and Physics. 2002;78(1):239-245.
18. Fang F, Kennedy J, Manikandan E, Futter J, Markwitz A. Morphology and characterization of TiO2 nanoparticles synthesized by arc discharge. Chemical Physics Letters. 2012;521:86-90.
19. Scherrer P. Bestimmung der Größe und der inneren Struktur von Kolloidteilchen mittels Röntgenstrahlen. Nachrichten von der Gesellschaft der Wissenschaften zu Göttingen, Mathematisch-Physikalische Klasse. 1918;1918:98-100.
20. Williamson GK, Hall WH. X-ray line broadening from iled aluminium and wolfram. Acta Metallurgica. 1953;1(1):22-31. 21. Santra K, Chatterjee P, Sen Gupta SP. Voigt modelling of size-strain analysis: Application to α-Al2O3 prepared by combustion
technique. Bulletin of Materials Science. 2002;25(3):251-257.
22. Prabhu YT, Venkateswara Rao K, Sesha Sai Kumar V, Siva Kumari B. X-ray Analysis of Fe doped ZnO Nanoparticles by Williamson-Hall and Size-Strain Plot. International Journal of Engineering and Advanced Technology. 2013;2(4):268-274.
23. Madhu Kumar P, Badrinarayanan S, Sastry M. Nanocrystalline TiO2 studied by optical, FTIR and X-ray photoelectron spectroscopy: correlation to presence of surface states. Thin Solid Films. 2000;358(1-2):122-130.
24. Vorkapic D, Matsoukas T. Efect of Temperature and Alcohols in the Preparation of Titania Nanoparticles from Alkoxides. Journal of the American Ceramic Society. 1998;81(11):2815-2820.
25. Yeh JJ, Lindau I.Atomic subshell photoionization cross sections and asymmetry parameters: 1 ≤ Z ≤ 103. Atomic Data and Nuclear Data Tables.1985;32(1):1-155.
26. Tanuma S, Powell CJ, Penn DR. Calculations of electron inelastic mean free paths. V. Data for 14 organic compounds over the 50–2000 eV range. Surface and Interface Analysis. 1994;21(3):165-176.
27. Karami A. Synthesis of TiO2 nano powderby the sol-gel method
and its use as a photocatalyst. Journal of the Iranian Chemical Society. 2010;7(2 Suppl):S154-S160.
28. Look JL, Zukoski CF. Colloidal Stability and Titania Precipitate Morphology: Inluence of Short-Range Repulsions. Journal of the American Ceramic Society. 1995;78(1):21-32.
29. Nagpal VJ, Davis RM, Rile JS. In situ steric stabilization of titanium dioxide particles synthesized by a sol-gel process.
Colloids and Surfaces A: Physicochemical and Engineering Aspects.1994;87(1):25-31.
30. Shirley DA. High-Resolution X-Ray Photoemission Spectrum of the Valence Bands of Gold.Physical Review B. 1972;5(12):4709-4713. 31. Arami H, Mazloumi M, Khalifehzadeh R, Sadrnezhaad SK.
Sonochemical preparation of TiO2nanoparticles. Materials Letters. 2007;61(23-24):4559-4561.
32. Borgese L, Bontempi E, Geli M, Depero LE, Goudeau P, Geandier G, et al. Microstructure and elasticproperties of atomiclayerdeposited TiO2 anatasethin ilms. Acta Materialia. 2011;59(7):2891-2900.
33. Shu-Xin W, Zhi M, Yong-Ning Q, Fei H, Li Shan J, Yan-Jun Z. XPS study of Cooper dopping TiO2 photocatalyst. Acta Physico-Chimica Sinica. 2003;19(10):967-969.
34. Fang J,Bi X, Si D, Jiang Z, Huang W. Spectroscopic studies of interfacial structures of CeO2–TiO2mixed oxides. Applied Surface Science. 2007;253:8952-61.
35. Naumkin AV, Kraut-Vass A, Gaarenstroom SW, Powell CJ. NIST X-Ray Photoelectron Spectroscopy Database 20,Version 4.1. Washington: U.S. Secretary of Commerce; 2012.
36. Moulder JF, Stickle WF, Sobol PE, Bomben KD. Handbook of X-ray photoelectron spectroscopy: a reference book of
standard spectra for identiication and interpretation of XPS