Neutral Kaon Correlations in
√
s
NN=
200
GeV Au+Au collisions at RHIC
Selemon Bekele1 and Richard Lednick´y2,3
1 Department of Physics, The University of Kansas, Lawrence,KS 66045 2 Joint Institute for Nuclear Research, Dubna, Moscow Region, 141980, Russia
3Institute of Physics ASCR, Na Slovance 2, 18221 Prague 8, Czech Republic
Received on 13 December, 2006
Results from two-K0
s interferometry in√sNN=200 GeV Au+Au collisions at RHIC are presented. A model
that takes into account the strong final state interaction has been used to fit the data. The effect of coupledK0K¯0
andK+K−channels was studied. The value of the correlation radius parameter obtained is consistent with the transverse mass (mT) systematics established in pion correlation measurements.
Keywords: Neutral Kaon Interferometry
I. INTRODUCTION
A phase transition from hadronic matter to a new state of matter called a Quark Gluon Plasma (QGP) is predicted to occur at sufficiently large energy densities by Lattice QCD calculations [1]. The primary goal of the heavy-ion collisions program at the Relativistic Heavy-Ion Collider (RHIC) is the creation and study of such a de-confined state of matter. It is believed that a first order phase transition from the QGP back to normal hadronic matter delays the expansion of the hot reaction zone created in the collision [2]. A long duration of particle emission due to a delayed expansion should reveal itself as a large effective source size.
One of the important goals in high energy experiments for the last several decades has been the measurement of the space-time extent of the particle emitting region [3–5]. These measurements are based on the sensitivity of particle momen-tum correlations to the space-time separation of the particle emitters due to the effects of quantum statistics (QS) and fi-nal state interaction (FSI). The QS symmetrization (antisym-metrization) is usually the dominant source of the correlation for identical particles. Due to the interference of the ampli-tudes corresponding to various permutations of identical par-ticles, the measurement of the corresponding correlation is of-ten called particle interferometry (see [6] for a review).
Because of their smaller mass, pions are the most abundant particles produced in heavy ion collisions. A significant frac-tion of them, however, come from the decay of unstable res-onances after freezout thus complicating the pion interferom-etry measurements. As a result, while the direct pion source may be inherently non-Gaussian, the resonances extend the source size due to their finite lifetime, introduce an additional essentially non-Gaussian distortion in the two-pion correlator and reduce the fitted correlation strength. Due to the reso-nance decay phase-space, secondary pions populate mainly the low momentum region and can thus introduce an addi-tional pair momentum dependence of the two-particle corre-lator.
In contrast to the pions, kaon interferometry suffers less from resonance contributions and could provide a cleaner sig-nal for correlation studies than pions [7, 8]. Since the kaon density is considerably smaller than the pion density at RHIC (√sNN =200 GeV), higher multi-particle correlation effects,
that might play a role for pions, should be of minor importance for kaons. For example, the pion multiplicity has increased by approximately 70% from the SPS(√sNN =17.3 GeV) to
RHIC [9] but the interferometry radii remain almost the same [10, 11]. The strangeness distillation mechanism [12] might further increase any time delay QGP signature. This mecha-nism could lead to strong temporal emission asymmetries be-tween kaons and anti-kaons [13], thus probing the latent heat of the phase transition.
Particle identification for pions, via their specific ionization (energy loss per unit length ordE/dx), works only up to about 700 MeV/c. Neutral kaons, on the other hand, can be identi-fied up to much higher momentum using their decay topology. This allows for the extension of the interferometry systemat-ics to a higher momentum than is presently achievable with pions, and thus provides a means to probe the earlier times of the collision. The effect of two-track resolution, which is a limiting factor in charged particle correlations, is also small. The absence of Coulomb FSI suppression together with small contributions from resonance decays make neutral kaon corre-lations a powerful tool to investigate the space time structure of the particle emitting source.
The OPAL [14] and ALEPH [15] collaborations have mea-sured correlations of neutral kaons from hadronic decays of Z0ine+e−collisions at LEP. The WA97 experiment at CERN [16] attempted to measureKs0Ks0correlations but did not see a significant enhancement of neutral kaon pairs in the region of small momentum difference due to a lack of sufficient sta-tistics. In this paper, recent results are presented on two-Ks0 correlations in central Au-Au collisions at√sNN=200 GeV
measured by the STAR(Solenoidal Tracker at RHIC) experi-ment at RHIC [17].
II. CORRELATION FUNCTIONS
(i) The mean freeze-out phase space densityfis assumed sufficiently small so that only the mutual QS and FSI effects can be considered when calculating the correlation function of two particles emitted with a small relative momentumQ=2k∗ in their center-of-mass (c.m.) system. It is found that f increases with energy and for central lead-lead or gold-gold collisions seems to saturate at the highest SPS energy [6]. The saturatedfis substantially smaller than unity for pions with pt>0.2 GeV/cso pointing to negligible multiboson effects in
thispt-region.
(ii) The momentum dependence of the one-particle emis-sion probabilities is assumed inessential when varying the par-ticle four-momentap1andp2by the amount characteristic for the correlations due to QS and FSI. Thissmoothness assump-tion, requiring the components of the mean space-time dis-tance between particle emitters much larger than those of the space-time extent of the emitters, is well justified for heavy ion collisions.
(iii) An independent or incoherent particle emission is as-sumed. This assumption is quite reasonable for a dominant part of particle pairs produced in heavy ion collisions and is consistent with the observed strength of two- and three-pion correlation functions (see, e.g., [18–20]).
(iv) To simplify the calculation of the FSI effect, the Bethe-Salpeter amplitude describing two particles emitted at space-time points xi={ti,ri} and detected with four-momenta pi
is usually calculated at equal emission times in the pair c.m. system. In this approximation, the reduced non-symmetrized Bethe-Salpeter amplitude (with the removed unimportant phase factor due to the c.m. motion), depending only on the relative four-coordinate∆x≡x1−x2={t,r} and the gener-alized relative momentum q=q−P(qP)/P2 (q=p1−p2, P=p1+p2 andqP=m12−m22; in the two-particle c.m. system,P=0, ˜q={0,2k∗}and∆x={t∗,r∗}), is substituted by a stationary solution Ψ(+)−k∗(r∗)of the scattering problem.
The solution at large distancesr∗has the asymptotic form of a superposition of the plane and outgoing spherical waves (the minus sign of the vectork∗corresponds to the reverse in time direction of the emission process). Thisequal time approx-imation is usually satisfied for heavy particles like kaons or nucleons and, for pions, it merely leads to a slight overestima-tion (typically<5%) of the strong FSI effect [21].
The two-particle correlation function then reduces to the square of the two-particle wave function averaged over the distancer∗of the emitters in the two-particle c.m. system:
C(p1,p2)=. |Ψ(+)−k∗(r∗)|2. (1)
For identical particles, the amplitude in Eq. (1) enters in a symmetrized form. Particularly, for spin-0 bosons,
Ψ(+)−k∗(r∗)→[Ψ(+)−k∗(r∗) +Ψ(+)k∗ (r∗)]/
√
2. (2)
The two-particle approximationin (i) and FSI separation in the Bethe-Salpeter amplitudes of the elastic transitions a+b→a+bimplies a long FSI time as compared with the characteristic production time, i.e. the c.m. momentum k∗ much less than typical production momentum transfer of hun-dreds MeV/c. In fact, the long-time FSI can be separated
also in the inelastic transitions,a+b→c+d, characterized by a slow relative motion in both entrance and exit channels [21, 22]. Particularly, calculating the FSI effect on neutral kaon correlations, one has to take into account the coupled K+K−-channel (see section IV).
For non-interacting particles, the non-symmetrized wave function reduces to the plane wave,Ψ(+)−k∗(r∗) =exp(−ik∗r∗),
and the correlation function of two identical spin-0 bosons be-comes
C(p1,p2)=. 1+cos(2k∗r∗). (3) Particularly, for the Gaussian distribution of the vectorr∗of the relative distance between particle emission points in the pair c.m. system:
d3N d3r∗∝e−
r∗2/(4R2), (4)
the correlation function takes the Gaussian form:
C(p1,p2)=. 1+exp(−R2Q2), (5) whereQ= (−q2)1/2=2k∗.
The Gaussian expression in Eq. (5) is often used to fit the one-dimensional correlation functions of two identical pions or kaons in a modified form:
C(Q) =N·[1+λ·exp(−R2Q2)], (6) whereNandλare respectively the normalization and corre-lation strength parameters. The parameterλequals unity for a fully chaotic Gaussian source and is smaller than unity for a source with partially coherent particle emission. The value of
λcan also be lowered by the non-Gaussian form of the corre-lation function, the contribution from kaons coming from long lived resonances. Also neglecting FSI can affect (suppress or enhance) the value of this parameter.
III. THE SYSTEM OF TWO NEUTRAL KAONS
The production of the neutral kaons, K0 and ¯K0, is at-tributed to the strong interaction which conserves the strange-ness quantum number. An interesting property of neutral kaons is that theK0can change into a ¯K0 through a second order weak interaction. However, the particles that we nor-mally observe through weak decay channels in the laboratory are notK0and ¯K0[23]. Neglecting the effects of CP violation, the observed weak interaction eigenstates are given by
|Ks0 = √1 2(|K
0+
|K¯0),
|Kl0 = √1 2(|K
0
− |K¯0), (7)
via measurements of their decay products, which are mainly pions. The state vector of theK0
sKs0system is then given by
the expression
|Ks0Ks0 = 1 2(|K
0K0+|K0K¯0
+|K¯0K0+|K¯0K¯0). (8) Now, if aKs0Ks0pair comes fromK0K0( ¯K0K¯0), it is subject to Bose-Einstein (BE) enhancement as it originates from an identical boson pair. On the other hand, theK0and ¯K0are two different particles and one may not expect correlations if one Ks0comes fromK0and the other one from ¯K0. Nevertheless, it can be shown [24] (see also [25–27]) that only the symmetric part of theK0K¯0 amplitude contributes to theK0
sKs0system
and thus also leads to a Bose-Einstein enhancement at small relative momentum (on the contrary, only the anti-symmetric part of theK0K¯0 amplitude contributes to theK0
sKl0system
and leads to the “Fermi-Dirac like” suppression). TheKs0Ks0 correlation thus includes a unique interference term that may provide additional space-time information.
The strong FSI has an important effect on neutral kaon cor-relations due to the near threshold resonances, f0(980)and a0(980)[28]. These resonances contribute to theK0K¯0 chan-nel and lead to the s-wave scattering length dominated by the imaginary part of∼1 fm. Based on the predictions of chiral perturbation theory for pions [29], the non-resonant s-wave scattering lengths∼0.1 fm for bothK0K¯0andK0K0channels and can be neglected to a first approximation.
To calculate the K0
sKs0 correlation function, theK0’s and
¯
K0’s are assumed to be emitted by independent single-kaon sources so that the fraction of Ks0Ks0 pairs originating from K0K¯0system isα= (1−ε2)/2, whereεis theK0- ¯K0 abun-dance asymmetry. The correlation function is calculated as a mixture of the average squares of the properly symmetrized K0K0, K¯0K¯0 and non-symmetrized K0K¯0 wave functions, weighted by the respectiveK0
sKs0 fractions. To average over
the relative distance vectorr∗, the Lednick´y & Lyuboshitz an-alytical model [28] has been used, assumingr∗is distributed according to Eq. (4) with a Gaussian radius R. The model assumes that the non-symmetrized wave functionsΨ−k∗(r∗)
describing the elastic transitions can be written as a superpo-sition of the plane and spherical waves, the latter being domi-nated by the s-wave,
Ψ−k∗(r∗) =e−ik
∗r∗
+f(k∗)e
ik∗r∗
r∗ , (9)
wherek∗≡Q/2 is the three-momentum of one of the kaons in the pair rest frame and f(k∗)is the s-wave scattering am-plitude for a given system. Neglecting the scattered waves for the K0K0and ¯K0K¯0 systems (the corresponding f(k∗) =0)
one obtains the following expression for theKs0Ks0correlation function [28]:
C(Q) = 1+e−Q2R2+α
f(k∗) R
2 +
4ℜf(k∗)
√
πR F1(QR)−
2ℑf(k∗)
R F2(QR)
, (10)
whereF1(z) =0zdxex2−z2/zandF2(z) = (1−e−z2)/z. The s-wave K0K¯0 scattering amplitude f(k∗) is dominated by
the near threshold s-wave isoscalar and isovector resonances f0(980)anda0(980)characterized by their massesmrand
re-spective couplingsγr andγ′rto theKK¯,ππandKK¯,πη
chan-nels. Associating the amplitudes fIat isospinI=0 andI=1
with the resonancesr=f0anda0respectively, one can write [28, 30]
f(k∗) = [f0(k∗) +f1(k∗)]/2, (11)
fI(k∗) =γr/[m2r−s−iγrk∗−iγ′rk′r]. (12)
Heres=4(m2
K+k∗2) andk′r denotes the momentum in the
second (ππ or πη) channel with the corresponding partial widthΓ′r=γ′rk′r/mr.
There is a great deal of uncertainty in the properties of these resonances due to insufficiently accurate experimental data and the different approaches used in their analysis. For-tunately, the dominant imaginary part of the scattering am-plitude is basically determined by the ratios of the f0KK¯ to f0ππanda0KK¯ toa0πη couplings whose variation is rather small [31]. In this paper, the resonance masses and couplings from (a) Martinet al. [30], (b) Antonelli [32], (c) Achasov et al. [33], (d) Achasovet al. [33] (see Table I) are used to demonstrate the impact of their characteristic uncertainties on the calculated correlation function.
Re f. mf0 γf0KK¯ γf0ππ ma0 γa0KK¯ γa0πη
a 0.978 0.792 0.199 0.974 0.333 0.222 b 0.973 2.763 0.5283 0.985 0.4038 0.3711 c 0.996 1.305 0.2684 0.992 0.5555 0.4401 d 0.996 1.305 0.2684 1.003 0.8365 0.4580
TABLE I: Thef0anda0masses and coupling parameters, all in GeV, from (a) Martinet al. [30], (b) Antonelliet al.[32], (c) Achasovet al.[33] and (d) Achasovet al.[33].
IV. THE EFFECT OF THE K+K−→K0K¯0 TRANSITION
transitionK+K−→K0K¯0in addition to the elastic transition K0K¯0→K0K¯0. Instead of a single channel Scr¨odinger equa-tion one should thus solve a two-channel one. In solving the standard scattering problem, one should take into account that the FSI problem corresponds to the inverse direction of time. As a result, one has to make the substitutionk∗→ −k∗and considerK0K¯0(≡1)as the entrance channel andK+K−(≡2)
as the exit channel. Since the particles in both channels are members of the same isospin multiplets, one can assume that they are produced with about the same probability. There-fore the correlation function will be simply a sum of the av-erage squares of the wave functionsΨ11
−k∗(r∗)andΨ21−k∗(r∗)
describing the elastic and inelastic transitions respectively. Assuming the s-wave dominance andr∗outside the range of the strong interaction potential, one has [22]:
Ψ21−k∗(r∗) =fc21(k∗)
µ
2 µ1
˜ G(ρ2,η2)
r∗ , (13)
whereµ1=mK0/2 andµ2=mK+/2 are the respective reduced
masses in the two channels. ρ2=k2∗r∗, η2= (k∗2a2)−1and k∗2= [2µ2(k∗2/(2µ1) +2m
K0−2mK+]1/2is theK+momentum
in the two-kaon rest frame;a2=−(µ2e2)−1=−109.6 fm is the (negative)K+K−Bohr radius, fc21(k∗)is the s-wave tran-sition amplitude re-normalized by Coulomb interaction in the K+K− channel, ˜G(ρ,η) =Ac(η).[G0(ρ,η) +iF0(ρ,η)] is
the combination of the singular and regular s-wave Coulomb functionsG0andF0. FinallyAc(η) =2πη/[exp(2πη)−1]is
the Coulomb penetration (Gamow) factor.
The wave function of the elastic transition 1→1 is still given by Eq. (9) in whichk∗≡k∗1and the amplitude f = fc11 is now the element of a 2×2 matrix
ˆ
fc= Kˆ−1−ikˆc−
1
. (14)
Here ˆK is a symmetric matrix and ˆkc is a diagonal matrix
in the channel representation: k11
c =k∗, k22c =Ac(η2)k∗2− 2ih(η2)/a2, where the function h(η) is expressed through the digamma functionψ(z) =Γ′(z)/Γ(z)ash(η) = [ψ(iη)−
ψ(−iη)−lnη2]/2. Assuming that the isospin violation arises solely from the mass difference and Coulomb effects on the elementk22
c , making it different from the momentumk∗in the
neutral kaon channel, one can express the ˆK−1matrix, in the channel representation through the inverse diagonal elements KI−1of the ˆK-matrix in the representation of total isospinI (the products of the corresponding Clebsch-Gordan coeffi-cients being 1/2 or -1/2):
(Kˆ−1)11= (Kˆ−1)22=1 2
K0−1+K1−1,
(Kˆ−1)21= (Kˆ−1)12=1 2
K0−1−K1−1. (15) The latter are assumed to be dominated by the resonancesr=
f0(980)anda0(980)forI=0 and 1, respectively, so: KI−1= (m2
r−s−ik′rγ′r)/γr. (16)
One should also take into account the correction∆CKK¯due to the deviation of the spherical waves from the true scattered
waves in the inner region of the short-range potential, which is of comparable size to the effect of the second channel. This correction is also given in Ref. [22] and is represented in a compact form in Eq. (125) of Ref. [21]. In the case of the kaons,
∆CKK¯ = − 1 2√πR3
|fc11|2d011+|fc21|2d022
+2ℜ(fc11fc21∗)d21 0
, (17)
wheredi j0 =2ℜd(Kˆ−1)i j/dk∗2; atk∗=0, ˆd
0coincides with the real part of the matrix of effective radii.
One may see from Eqs. (10) and (13) that the usual res-onance Breit-Wigner behavior settles only at smallr∗ when squares of the spherical waves|fci j/r∗|2dominate. At
suffi-ciently largek∗, one can neglect the Coulomb effects and put fc11= (. f0+f1)/2, fc21
.
= (f0−f1)/2, so that|fc11|2+|fc21|2 .
=
|f0|2+|f1|2. The sum of the square terms then reduces to the incoherent Breit-Wigner contributions of f0 anda0 res-onances. There can also be additional (not related to FSI) resonance contribution of the usual Briet-Wigner form due to direct f0(980)anda0(980)production. This contribution is assumed to be negligible as compared to the FSI effect.
In the fits, the normalization and correlation strength pa-rametersN andλ are taken into account by the substitution C(Q)→N·[λ·C(Q) + (1−λ)]. Figure 1 shows the theoreti-cal correlation functions [17] for two sets of resonance para-meters from Table I withR=6 andR=3 fm as input radii with the normalization factorNandλboth set to unity.
Q (GeV/c)
0 0.02 0.04 0.06 0.08 0.1 0.12 0.14 0.16 0.18 0.2
C(Q)
0.8 1 1.2 1.4 1.6 1.8 2 2.2
Mass and coupling parameters from row (a) of Table I
R = 6 fm R = 3 fm
Mass and coupling parameters from row (d) of Table I
R = 6 fm R = 3 fm
FIG. 1: (Color online) Theoretical correlation functions [17] for in-put Gaussian sources ofR=6 fm andR=3 fm withλ=1,N=1 The resonance masses and coupling constants are from Table I.
V. THE EXPERIMENTALKs0CORRELATION FUNCTION
The data used in the present analysis were collected us-ing the Solenoidal Tracker at RHIC(STAR)[35]. The STAR detector consists of several detector subsystems in a large solenoidal magnet that provides a uniform 0.5 Tesla field. The main setup consisted of the time projection chamber (TPC) [36] for charged particle tracking, a scintillator trigger barrel (CTB) surrounding the TPC for measuring charged particle multiplicity, and two zero degree calorimeters (ZDC) [37] lo-cated upstream and downstream along the axis of the TPC and beams to detect spectator neutrons. With full azimuthal coverage over|η|<1 and an almost 100% efficiency for min-imum ionizing particles, the CTB provides a good estimate of the number of charged particles produced in the mid-rapidity region. The number of neutrons detected in the ZDC’s is iden-tified with the amount of energy deposited in them. The col-lision centrality is determined by correlating the energy de-position in the ZDC with the number of minimum ionizing particles detected by the CTB. Events from the ZDC and CTB central trigger (0−10% of the total hadronic cross section) data sets were used with an event vertex within±25 cm of the center of the TPC along the beam axis.
)
2
Mass (GeV/c
0.4 0.42 0.44 0.46 0.48 0.5 0.52 0.54 0.56 0.58
)
2
Entries/(0.4 MeV/c
0 20 40 60 80 100 120 140 160
3
10
×
FIG. 2: (Color online) TheKs0invariant mass distribution from
cen-tral Au+Au collisions at√sNN=200 GeV [17] . The range in trans-verse momentum is from 0.5 GeV/c to 3.5 GeV/cand rapidity is between -1.5 and 1.5. Kaon candidates falling in the mass range from 0.48 GeV/c2to 0.51 GeV/c2, indicated by the shaded region, were selected for this correlation study. The corresponding mass is 495.6±6.8 MeV/c2.
TheKs0has a mean decay length (cτ) of 2.7 cm and decays via the weak interaction intoπ+andπ−with a branching ratio
of about 68%. The mass and kinematic properties of theKs0 are determined from the decay vertex geometry and daughter particle kinematics [34]. Neutral kaon candidates are formed out of a pair of positive and negative tracks whose trajecto-ries point to a common secondary decay vertex which is well separated from the primary event vertex.
Figure 2 shows the invariant mass distribution of the
neu-tral kaons [17]. The background belowKs0peak is character-ized by a polynomial fit to the distribution outside the mass peak. This enables us to define the purity S/(S+B) (ra-tio of signal to signal plus background) of theKs0sample in the reconstructed mass peak. The observed mass 495.6±6.8 MeV/c2is consistent with the accepted value [38]. The sig-nal and background for the mass range from 0.48 GeV/c2 to 0.51 GeV/c2considered in this analysis are shown by the shaded regions. All neutral kaon candidates, with invariant masses from 0.48 GeV/c2to 0.51 GeV/c2, transverse momen-tum from 0.5 GeV/cto 3.5 GeV/cand rapidity between -1.5 and 1.5 have been considered. The daughter particle tracks are required to have a minimum of 15 TPC hits and a distance of closest approach to the primary vertex greater than 1.3 cm.
Entries / (0.04 GeV/c)
200 400 600 800 1000
1200 (a)
Q < 0.2 GeV/c
pair purity ~ 52% pair purity ~ 89%
(GeV/c)
T
K
0 0.5 1 1.5 2 2.5 3 3.5 4
Entries / (0.04 GeV/c)
0 20 40 60 80 100 120 140 160
180 (b)
Q < 0.1 GeV/c
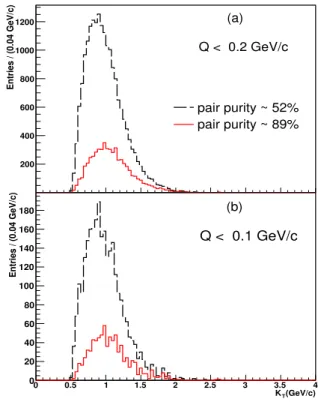
FIG. 3: (Color online) TheKT distribution of theKs0pairs [17]. The
range in transverse momentum of the single particles is from 0.5 GeV/cto 3.5 GeV/c. The distribution in (a) corresponds toQ<0.2 GeV/c and that in (b) is forQ<0.1 GeV/c, i.e., (b) is a subset of (a). The two histograms in each panel are for low (dashed) and high (full) pair purity.
Experimentally, the two-particle correlation function is de-fined as
C2(Q) =A(Q)
B(Q), (18)
itself, i.e., correlation between a realKs0and a fakeKs0 recon-structed from a pair which shares a daughter of the realK0
s,
was eliminated by requiring that kaons in a pair have unique daughters. The effects from splitting of daughter tracks have also been explored by looking at the angular correlation be-tween the normal vectors to the decay planes of the Ks0 in a given pair. No enhancement at very small angles was observed indicating no significant problem from track splitting. B(Q) is the reference distribution constructed by mixing particles from different events with similar Z-vertex positions(relative z position within 5 cm). The individualKs0for a given mixed pair are required to pass the same single particle cuts applied to those that go into the real pairs. The mixed pairs are also required to satisfy the same pairwise cuts applied to the real pairs from one event. The efficiency and acceptance effects cancel out in the ratio AB((QQ)).
The effect of momentum resolution on the correlation func-tions has also been investigated using simulated tracks from Ks0 decays with known three-momenta, pin, embedded into
real events. The embedded tracks were simulated taking into account the response of the TPC and scattering effects. The resolution inplies between 1% and 2% for thepT range used
in this analysis.
The top panel in Figure 3 shows the KT distribution for
Q<0.2 GeV/c where KT = (|p1T+p2T|)/2. One can see
that the shape of theKT distribution changes with the pair
pu-rity and, as a result, so doesKT, the mean of the distribution.
The meanKT varies almost linearly with pair purity. For the
lowest pair purity value of≈52%,KT ≈0.805 GeV/c. At
the highest pair purity value of ≈89%, KT ≈1.07 GeV/c
[17]. The dependence ofKTon the pair purity together with
the fact that the radii may vary withKT implies that varying
the pair purity may change the measured radii. In this analy-sis, the correlation function is integrated over allKT since the
statistics are not sufficient to make aKT dependent study.
Corrections to the raw correlation functions were applied according to the expression
Ccorrected(Q) =
Cmeasured(Q)−1
PairPurity(Q) +1 (19)
where the pair purity was calculated as the product of the signal(S) to signal plus background (S+B) ratios of the two Ks0of the pair (i,j)
PairPurity(Q) = S
S+B(pti)× S
S+B(pt j) (20) The pair purity,PairPurity(Q), has been found to be inde-pendent ofQover the range of invariant four-momentum dif-ference considered. As a result, an average value over Q of the pair purity has been used to correct the correlation function.
Figure 4 shows the experimentalK0
sKs0correlation function
before and after corrections for purity and momentum resolu-tion are applied [17]. It has been verified that the correlaresolu-tion function due to pairs coming outside theKs0mass window is flat. It can be seen that the effect of momentum resolution is comparable to that of purity correction.
Q (GeV/c)
0 0.02 0.04 0.06 0.08 0.1 0.12 0.14 0.16 0.18
C(Q)
1 1.5 2 2.5 3
Corrected for purity and
momentum resolution Corrected for purity only
Uncorrected data
FIG. 4: (Color online) TheKs0Ks0correlation function from central Au+Au collisions at√sNN=200 GeV [17]. The solid circles are for uncorrected data. The squares correspond to the case where the data have been corrected for pair purity. The triangles represent the data after correcting for pair purity and momentum resolution. The errors are statistical only.
VI. EXPERIMENTAL RESULTS
The experimental correlation functions are fit using the Lednick´y & Lyuboshitz [28] model to take into account the effect of the strong FSI. The free parameters are the radiusR characterizing the separationr∗of the particle emission points in the pair rest frame, the normalizationN, andλ. This fitting was done assuming the Gaussianr∗–distribution of Eq. (4).
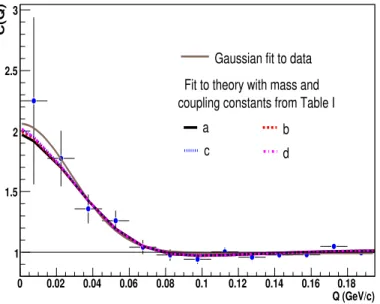
Figure 5 shows an example of the model fits to the experi-mental correlation function. A Gaussian fit to the correlation function givesR=5.02±0.61 fm andλ=1.08±0.29. One can see that a Gaussian fit cannot account for theC(Q)<1 part of the data which are fit better if the strong FSI is in-cluded. When taking the effects of the strong FSI, the val-ues obtained areR=4.09±0.46(stat.)±0.31(sys) fm and
λ=0.92±0.23(stat)±0.13(sys)at the mean transverse mass mT= 1.07 GeV [17]. The value ofλis consistent with unity
as expected for a chaotic system with little contributions from decaying resonances. Plotting the radius as a function of the meanKT, as shown in Figure 6, shows a slight dependence
of Rwith increasingKT [17]. However this could be a
re-maining artifact of the meanKT dependence on pair purity, as
mentioned earlier and shown in Figure 3. One has to look at severalKT bins for a specified pair purity to study aKT
de-pendence of the radius coming from real physics effects. This was not possible in this analysis due to the limited statistics.
Figure 7 shows themT dependence ofRextracted fromππ
Q (GeV/c)
0 0.02 0.04 0.06 0.08 0.1 0.12 0.14 0.16 0.18
C(Q)
1 1.5 2 2.5 3
Gaussian fit to data
Fit to theory with mass and coupling constants from Table I
a b
c d
FIG. 5: (Color online) Fits to experimental correlation function in-cluding the strong interaction with resonance masses and coupling constants from Table I [17]. The corresponding χ2/DOF are (a) 1.053, (b) 1.048, (c)1.045 and (d) 1.046. A simple Gaussian fit, with χ2/DOF= 0.816, is also shown for comparison. The errors are only statistical.
> (GeV/c)
T
<K
0.75 0.8 0.85 0.9 0.95 1 1.05 1.1
R (fm)
0 1 2 3 4 5 6
Mass and coupling constants from Table I
a
b
c
d
FIG. 6: (Color online) The extractedRas a function of the meanKT
of the pairs that go into the correlation function [17]. The errors are only statistical.
FSI effect the neutral kaons also seem to follow themTscaling
that hydrodynamics predicts [41].
VII. CONCLUSIONS
The first measurement of neutral kaon correlations in heavy-ion collisions at RHIC are presented. To obtain rea-sonable agreement between theory and data, the effect of the strong FSI has to be considered. The variations of the
)
2
(GeV/c
T
m
0.2 0.4 0.6 0.8 1 1.2 1.4
R (fm)
0 1 2 3 4 5 6 7 8
coupled-channel fit
s 0
K +
π
-π
Λ
p
Λ
p
Λ
p
Λ
p
FIG. 7: (Color online)Ras a function ofmT [17]. Statistical and systematic errors are shown. The FSI uncertainty measured by the spread of the fit results is substantially smaller than the statistical error.
nance parameters result in very small differences, which are well within the systematic errors. A Gaussian fit to the cor-relation function does not account very well for theC(Q)<1 part of the data and gives a radius which is larger compared to the model fit results.
The measured correlation radius for the neutral kaon is in-termediate between those obtained from two-pion and proton-lambda correlations in these collisions with the same condi-tions except for a different transverse mass, mT. The radii
seem to follow a universalmT dependence in agreement with
a universal collective flow predicted by hydrodynamics. The value of the parameterλhas been found to be consistent with unity and thus points to a chaotic kaon source. This is in cor-respondence with an indication of a dominantly chaotic pion source obtained from STAR measurement of three-pion cor-relations [18].
Small contributions from resonance decays, the fact that the Coulomb interaction is absent in the dominant elastic transi-tion and that the strong FSI effect can be handled with suf-ficient accuracy makes neutral kaon interferometry a power-ful tool which allows for an important cross-check of charged pion correlation measurements.
the interferometry puzzle.
Acknowledgements
We thank the RHIC Operations Group and RCF at BNL, and the NERSC Center at LBNL for their support. This work was supported in part by the Offices of NP and HEP within the U.S. DOE Office of Science; the U.S. NSF; the BMBF of Germany; CNRS/IN2P3, RA, RPL, and EMN of France; EP-SRC of the United Kingdom; FAPESP of Brazil; the Russian
Ministry of Science and Technology; the Ministry of Educa-tion and the NNSFC of China; IRP and GA of the Czech Re-public, FOM of the Netherlands, DAE, DST, and CSIR of the Government of India; Swiss NSF; the Polish State Commit-tee for Scientific Research; SRDA of Slovakia, and the Korea Sci. & Eng. Foundation. It has been partly carried out within the scope of the GDRE: Heavy ions at ultrarelativistic ener-gies -a European Research Group comprising IN2P3/CNRS, EMN, University of Nantes, Warsaw University of Technol-ogy, JINR Dubna, ITEP Moscow and BITP Kiev.
[1] F. Karsch, Z. Phys. C 38, 147 (1988); F. Karsch, hep-lat/0106019.
[2] S. Prattet al., Phys. Rev. C42, 2646 (1990). [3] M.I. Podgoretsky, Sov. J. Part. Nucl.20, 266 (1989). [4] U.A. Wiedemann and U. Heinz, Phys. Rept.319, 145 (1999). [5] R. Lednicky, Phys. At. Nucl.67, 72 (2004).
[6] M.A. Lisa, S. Pratt, R. Soltz, U. Wiedemann, Ann. Rev. Nucl. Part. Sci.55, 357 (2005).
[7] M. Gyulassy and S.S. Padula, Phys. Rev. C41, R21 (1990); Phys. Lett. B 217, 181 (1989).
[8] J.P. Sullivanet al., Phys. Rev. Lett.70, 3000 (1993).
[9] B.B. Backet al.(PHOBOS Collaboration), Phys. Rev. Lett.85, 3100 (2000); Phys. Rev. Lett.88, 022302 (2002).
[10] C. Adler et al. (STAR Collaboration), Phys. Rev. Lett. 87, 082301 (2001).
[11] S.C. Johnsonet al.(PHENIX Collaboration), Nucl. Phys. A698, 603 (2002); W.A. Zajcet al., Nucl. Phys. A698, 39 (2002). [12] C. Greineret al., Phys. Rev. Lett.58, 1825 (1987); C. Spieles
et al., Phys. Rev. Lett.76, 1776 (1996).
[13] S. Soffet al., J. Phys. G23, 2095 (1997); D. Ardouinet al., Phys. Lett. B446, 191 (1999).
[14] G. Abbiendiet al.(OPAL Collaboration), Eur. J. Phys. C21, 23 (2001).
[15] D. Buskulicet al.(ALEPH Collaboration), Z. Phys. C64, 361 (1994).
[16] F. Antinoriet al.(WA97 Collaboration), Nucl. Phys. A661, 130c (1999).
[17] B. I. Abelev et al. (STAR Collaboration), Phys. Rev. C 74, 054902 (2006).
[18] J. Adams et al. (STAR Collaboration), Phys. Rev. Lett. 91, 262301 (2003).
[19] K. Morita, S. Muroya, and H. Nakamura, nucl-th/0310057. [20] M. Csan´ad (PHENIX Collaboration), nucl-ex/0509042. [21] R. Lednicky, nucl-th/0501065.
[22] R. Lednicky, V.V. Lyuboshits, and V.L. Lyuboshits, Phys. At. Nucl.61, 2950 (1998).
[23] M. Gell-Mann and A. Pais, Phys. Rev.97, 1387 (1955).
[24] V.L. Lyuboshitz, M.I. Podgoretsky, Sov. J. Nucl. Phys.30, 407 (1979).
[25] G. Alexander and H.J. Lipkin, Phys. Lett. B456, 270 (1999). [26] G. Alexander, Rep. Prog. Phys.66, 481 (2003).
[27] M. Gyulassy, Phys. Lett. B286, 211 (1992).
[28] R. Lednicky and V.L. Lyuboshits, Sov. J. Nucl. Phys.35, 770 (1982).
[29] B. Ananthanarayan, G. Colangelo, J. Gasser, and H. Leutwyler, Phys. Rept.353, 207 (2001).
[30] A.D. Martin, E.N. Ozmutlu, and E.J. Squires, Nucl. Phys. B
121, 514 (1977).
[31] V. Baruet al., Eur. Phys. J. A23, 523 (2005).
[32] A. Antonelli (KLOE Collaboration), hep-ex/0209069, eConf C020620THAT06 (2002).
[33] N.N. Achasov, V.V. Gubin, Phys. Rev. D63, 094007 (2001) for f0, N.N. Achasov, A.N. Kiselev, Phys. Rev. D68, 014006 (2003) fora0.
[34] C. Adler et al. (STAR Collaboration), Phys.
Lett. B 595, 143 (2004); S. Bekele, Ph.D.
thesis, The Ohio State University, 2004
(http://www.star.bnl.gov/central/publications/theses/2004). [35] M. Anderson et al., Nucl. Instrum. Meth. A499, 659 (2003);
K.H. Ackermanet al. (STAR Collaboration), Nucl. Phys. A
661, 681c (1999).
[36] H. Wiemanet al.(STAR Collaboration), IEEE Trans, Nucl. Sci.
44, 671 (1997); W. Bettset al.(STAR Collaboration), IEEE Trans, Nucl. Sci.44, 592 (1997); S. Kleinet al.(STAR Collab-oration), IEEE Trans, Nucl. Sci.43, 1768 (1996).
[37] C. Adleret al.(STAR Collaboration), Nucl. Instrum. Meth., A
461, 337 (2001).
[38] S. Eidelman et al., Review of Particle Physics (PDG), Phys. Lett. B592, 1 (2004).
[39] J. Adamset al.(STAR Collaboration), Phys. Rev. C71, 044906 (2005).
![FIG. 1: (Color online) Theoretical correlation functions [17] for in- in-put Gaussian sources of R = 6 fm and R = 3 fm with λ = 1, N = 1 The resonance masses and coupling constants are from Table I.](https://thumb-eu.123doks.com/thumbv2/123dok_br/18982459.457546/4.892.481.832.657.940/theoretical-correlation-functions-gaussian-sources-resonance-coupling-constants.webp)
![Figure 4 shows the experimental K s 0 K s 0 correlation function before and after corrections for purity and momentum resolu-tion are applied [17]](https://thumb-eu.123doks.com/thumbv2/123dok_br/18982459.457546/6.892.480.832.81.366/figure-experimental-correlation-function-corrections-purity-momentum-applied.webp)