A
r
ti
c
le
*e-mail: [email protected]
Study of the Electrochemical Reduction of Amoebicide Teclozan and its Amperometric
Determination in Pharmaceutical Formulations
André L. Santos,*,a Regina M. Takeuchi,b Nelson R. Stradiotto,b Ana Paula Estevesc
and Maria José Medeirosc
aFaculdade de Ciências Integradas do Pontal, Universidade Federal de Uberlândia, 38302-000 Ituiutaba-MG, Brazil
bUniversidade Estadual Paulista, 14801-970 Araraquara-SP, Brazil
cCentro de Química, Universidade do Minho, Largo do Paço, 4704-553 Braga, Portugal
Neste trabalho, a redução eletroquímica do amebicida Teclozan (TEC) foi estudada sobre um eletrodo de carbono vítreo em meio de acetonitrila. Eletrólises com potencial controlado foram realizadas visando, tanto a determinação do número de elétrons envolvidos na redução do fármaco, quanto a identificação dos produtos eletrogerados, os quais foram isolados por extração líquido-líquido e caracterizados por 1H RMN. Foi verificado que o TEC apresenta dois picos voltamétricos,
cada um associado à quebra redutiva de duas ligações C-Cl. Em presença de um doador de prótons, foi observado que o primeiro pico voltamétrico em −1,8 V corresponde principalmente à redução dos grupamentos -CHCl2 a -CH2Cl; enquanto o segundo pico em −2,2 V é responsável pela redução dos grupos -CH2Cl a CH3, fornecendo como único produto o derivado totalmente desalogenado do TEC, com rendimentos entre 82 e 97%. Este trabalho descreve também o desenvolvimento de um método eletroanalítico baseado na detecção amperométrica do TEC em condições hidrodinâmicas, o qual forneceu um limite de detecção de 8,9 × 10⁻⁶ mol L-1.
The electrochemical reduction of amoebicide Teclozan (TEC) was studied on a glassy carbon electrode in acetonitrile. Controlled-potential electrolyses were performed for coulometric and preparative purposes. The electrogenerated products were isolated by liquid-liquid extraction and characterized by 1H NMR. It was observed that TEC presents two voltammetric peaks, each one
associated with the cleavage of two C-Cl bonds. In presence of a proton donor it was observed that the first peak at −1.8 V promotes mainly the reduction of the groups CHCl2 to CH2Cl and the second one at −2.2 V promotes the reduction of the groups CH2Cl to CH3 giving as the sole product the completely dechlorinated TEC derivative with yields between 82 and 97%. In addition, a comparative study between the analytical performance of voltammetric techniques and amperometric detection of TEC in hydrodynamic conditions was performed. The amperometric detection was more sensitive than all evaluated voltammetric techniques, providing a detection limit of 8.9 × 10⁻⁶ mol L-1.
Keywords: amperometric detection, glassy carbon electrode, chloroacetamides, Teclozan
Introduction
The amoebiasis is an infectious disease caused by protozoan parasite Entamoeba histolytica, and it is a public
health problem in developing countries. According to the World Health Organization,1 amoebiasis is responsible for
more than 100,000 deaths per year throughout the world.
Amoebiasis is endemic in countries of Asia, Africa and South America, being included to the group of tropical diseases.
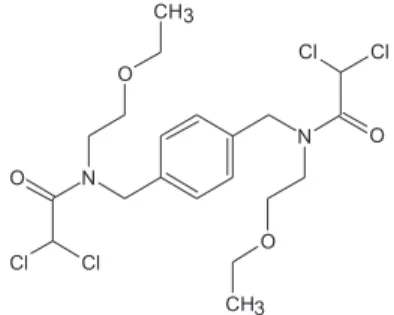
Chloroacetamide derivatives are important compounds widely employed for amoebiasis treatment. These drugs present high cure efficiency and they are considered safe drugs, being their main adverse effects restricted to gastrointestinal discomforts.2 Teclozan -
Few analytical methods are described in the literature for determination of amoebicide chloroacetamides, all of them are proposed for diloxanide furoate,4-7 other drug of
the group of chloroacetamides. Diloxanide furoate has also an official method according to US Pharmacopoeia,8
which is based on potentiometric titration in non aqueous media. This pharmacopoeia has not yet presented official method for TEC and alternative analytical methods for its determination are absent in the literature.
Electrochemical techniques can play an important role in the study of pharmacologically active compounds, since most of metabolic pathways involving these compounds are based on redox reactions. From an analytical point of view, electrochemical techniques have been successfully used to develop new electroanalytical methods for determination of pharmacological compounds in biological fluids or dosage forms, being this subject revised in literature.9,10 In
general, electroanalytical methods offer high sensitivity with low detection limit, easy operation and sometimes the use of simple and non-expensive instrumentation. Thus, the advantageous characteristics of the electrochemical techniques have allowed their use for determination of a wide range of pharmaceuticals compounds using mercury,11-14 glassy carbon,15-17 carbon paste,18,19 and
chemically modified electrodes.20-23
Despite of the relevance of electrochemical techniques on the study of pharmacological compounds, there are no reports of electrochemical studies of TEC until now. Recently, our group has studied the electrochemical reduction of diloxanide furoate on glassy carbon electrode in acetonitrile medium.24 We have observed that
electrochemical reduction of diloxanide furoate involves the C-Cl bond cleavage and the electrochemical techniques can be successfully employed for its quantification.
The electrochemical reduction of halogenated compounds has been widely studied in literature.25-30
According to the classical mechanism, this process involves the cleavage of C-X (X = Cl, Br, I) bond in a two electron process.31 The first electron transfer gives rise to the
radical-anion [R-X]•-, which dissociates in chloride ion and in the
respective dehalogenated radical. The second electron transfer corresponds to the reduction of the dehalogenated radical. Although, the existence of the radical anion [R-X]•- formed by the first electron transfer has never
been demonstrated, this classical mechanism is usually well accepted. Andrieux et al.32 have presented a complete
discussion explaining why this radical anion should not be expected for alkyl monohalides. According to these authors, the electrochemical reduction of alkyl monohalides occurs as a single and elementary step in which electron transfer and bond cleavage are concerted. On the other hand, the authors have proposed that the electrochemical reduction of aromatic halides occurs according to a stepwise pathway as in the classical mechanism. The literature provides several discussions about concerted and stepwise pathways for dissociative electron transfer,33-35 including
the use of the electrochemical transfer coefficient (α) as a tool to detect the transition between both pathways.36 The
electrochemical reduction of several polychloroacetamides was studied by Constentin et al.37 on glassy carbon
electrode in dimethylformamide by cyclic voltammetry. The authors found that electrochemical reduction of polychloroacetamides leads to their complete dechlorination in successive and separated steps, each one corresponding to the cleavage of one C-Cl bond in a two electron process. However, the authors have not performed the identification of the electrogenerated products.
As previously mentioned, the literature does not present a systematic and comprehensive electrochemical study of TEC and no analytical methods for its determination are proposed in literature as well. Thus, the objective of this work is to study the electrochemical reduction of TEC on a glassy carbon electrode and to develop a new electroanalytical method for its determination in pharmaceutical formulations based on its amperometric detection in hydrodynamic conditions.
Experimental
Reagents and solutions
TEC (MW = 502.3 g mol-1) pure sample and tablets of
a commercial pharmaceutical formulation containing TEC were kindly supplied by Sanofi-Syntelabo Pharmaceutics from Brazil and were used as received. The stock solutions of pure TEC were prepared by dissolving an appropriate quantity of the drug in acetonitrile, grade HPLC (J. T. Baker). All electrochemical measurements were carried out in acetonitrile containing 0.1 mol L-1
tetrabutylammonium tetrafluorborate (TBABF4, ACROS) or bromide tetraetylammonium (TEABr, Merck) as supporting
electrolyte. 1,1,1,3,3,3-hexafluoro-2-propanol (HFIP, Aldrich) was used as proton donor in some electrolyses of TEC in a concentration of 0.1 mol L-1. CDCl
3 (Aldrich) was
used to prepare the samples to 1H NMR analyses.
Quantitative determination of TEC in the pharma -ceutical formulation was carried out with five tablets (Sanofi-Synthelabo Brazil Ltda), whose labeled amount of TEC is 500 mg per tablet. The five tablets were powdered and the
resulting powder was mixed. The desired amount of the powder was dissolved in acetonitrile. Aliquots of this sample were transferred to an electrochemical cell containing acetonitrile/TBABF4 0.1 mol L-1 and TEC determination
was performed by standard addition method.
Apparatus and procedures
Electrochemical measurements were carried out in a potentiostat Autolab model PGSTAT 30, controlled by a microcomputer using the GPES 4.9 software. Electrodes for cyclic voltammetry in static conditions were 3.0 mm diameter glassy carbon disc as a working electrode, an Ag/AgCl/KCl saturated (Ag/AgClsat) was used as reference electrode and a Pt wire as auxiliary electrode. For experiments in hydrodynamic conditions the working electrode was replaced by a glassy carbon disc rotating from Metrohm (i.d. = 3.0 mm) connected to a rotation generator Metrohm model 628-10. Nitrogen was bubbled through the solution for 15 min before each measurement.
Controlled-potential electrolyses were carried out in a three-compartment cell with the cathodic and anodic compartments separated by a porous glass frit; the capacity of both compartments was 25 mL. The electrodes used were 2.5 cm diameter glassy carbon disc as working electrode, a 2.5 cm diameter Pt gauze as auxiliary electrode, and an Ag/AgClsat as reference electrode. During the electrolyses a nitrogen flow was kept in the electrochemical cell to remove dissolved oxygen and to promote the solution stirring.
At the end of the electrolyses, the solution of cathodic compartment was collected, the acetonitrile was evaporated under reduced pressure on a rotary evaporator and the residue was extracted with CH2Cl2 (3 × 5.0 mL). The combined organic layer was washed with saturated NaCl solution (3 × 15 mL) and subsequently with water (3 × 15 mL). Finally, the combined organic layer was dried with anhydrous MgSO4 and, after filtration, the CH2Cl2 was evaporated under reduced pressure. The weight of the final residue was determined and, after that, it was dissolved in CDCl3 and analyzed by 1H NMR and TLC. 1H NMR spectra
(300 MHz) were recorded on a Varian Unity Plus 300. TLC analyses were performed using silica supported on glass as stationary phase and ethyl acetate as mobile phase.
The identity and purity of TEC was verified by 1H
NMR (CDCl3): d 1.19 (6H, t, J = 7.0 Hz); 3.44 (4H, q, J =
7.0 Hz); 3.41-3.62 (8H, m); 4.66 (3.2H, s); 4.84 (0.8H, s); 6.20 (0.4H, s); 6.87 (1.6 H, s); 7.21 (4H, s). The 1H NMR
spectrum obtained for TEC has revealed the presence of two conformers, which arise from the rotation around the acetamide C-N bond. As a consequence, two sets of signals for the groups ArCH2N (4.66 and 4.84 ppm) and CHCl2 (6.20 and 6.87 ppm) were observed. From the ratio between the integral of the duplicated signals it is possible to determine that the two rotamers are present in the proportion of 80:20. The occurrence of rotation around the C-N bond is a well-known behavior of N,N-disubstituted acetamides.38
Identities of the major products (I and II) derived from controlled-potential electrolyses were confirmed by means of 1H NMR spectrometry (CDCl
3): (i) for I, d 1.14-1.19
(6H, m); 2.11 and 2.12 (3H, 2s); 2.21 and 2.22 (3H, 2s ); 3.39-3.50 (8 H, m); 3.52-3.60 (4 H, m); 4.62-4.66 (4H, m); 7.10-7.25 (4H, m) and (ii) for II, dinter alia, 2.11 (3H,
broad s); 2.22 (3 H, broad s); 4.06 (0.4H, s); 4.32 (1.6H, s). Once again, the duplication of some set of signals revealed the presence of more than one conformer.
Results and Discussion
Electrochemical behavior
Due to the poor solubility of TEC in aqueous solutions, all electrochemical measurements were performed in acetonitrile, which promotes the complete solubilization of the drug and presents a large potential window. Cyclic voltammetric behavior of 1.0 mmol L-1 TEC in acetonitrile/
TBABF4 on glassy carbon is shown in Figure 2, curve B.
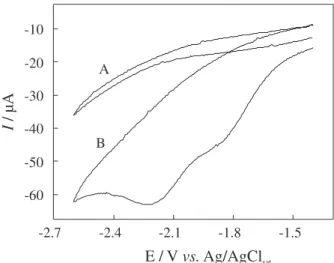
Figure 2. Cyclic voltammograms obtained in acetonitrile/TBABF4
(0.1 mol L-1) at 100 mV s-1. (A) Absence of TEC. (B) Presence of
We observe that TEC presents two cathodic peaks, the first poorly defined at −1.8 V followed by a second one at −2.2 V. A linear relationship between ip and ν1/2
was observed for the second peak according to the equation: ip(µA) = 1.5 ν1/2[(mV s-1)1/2], (n = 6) with linear
correlation coefficient of 0.9998, indicating a diffusion controlled electrode process. The current values for the peak at −2.2 V were sampled as the sum of both peaks. At all scan rates studied it was observed the absence of the corresponding anodic peak on the reverse scan, suggesting an irreversible process for the electrochemical reduction of the TEC. We have also observed that the current function, ip/(ν1/2C
TEC), does not change with the increase of ν, and
the peak potential values (Ep) shifts towards more negative potentials by increasing ν. This behavior also suggests that TEC electrochemical reduction is a totally irreversible electrode process. Due to the poor voltammetric profile of the first peak it was impossible to determine its exact values of ip and Ep.
For a totally irreversible electron transfer process a linear relationship between Ep and ln ν must be observed, whose slope is equal to RT/2αcnF (½ Tafel slope).39,40
The plot of Epvs. ln ν for the peak at −2.2 V was linear
according to the equation: Ep (V) = −2.46 − 0.069 ln[ν (V s-1)] (n = 7), with linear correlation coefficient
of −0.9991. From this plot, a Tafel slope of 138 mV was obtained which corresponds to αnc = 0.22. This value is characteristic of a totally irreversible electrode process involving bond cleavages.36 The low value of α leads to a
very broad voltammetric peak, which is responsible for the poor definition of the voltammogram presented in Figure 2, curve B.
Controlled-potential electrolyses were carried out at −2.3 V for 10 mL of 2.0 mmol L-1 TEC in acetonitrile/
TBABF4 (0.1 mol L-1). These electrolyses were performed
until total consumption of TEC, which was confirmed by the total disappearance of its cathodic peak in the cyclic voltammograms registered after each electrolysis. The results of the electrolyses are the average of three replicated experiments and it was found a value of n = 4.0 ± 0.1. For controlled-potential electrolyses performed at −1.8 V for 2.0 mmol L-1 TEC a value of n = 2.2 ± 0.1 was found.
At the end of these electrolyses it was observed the total disappearance of the first voltammetric peak, while the second voltammetric peak has not changed as shown in Figure 3, curve B.
These results indicate that the two voltammetric peaks are independent, each one corresponding to the cleavage of different C-Cl bonds on TEC molecule.
In order to identify the products resulting from the C-Cl bonds cleavage on the TEC reduction, the electrolyzed
solutions were submitted to the extraction procedure and the final residues were analyzed by 1H NMR and
TLC. These preparative controlled-potential electrolyses were performed in 25 mL of a solution containing 30 mg of TEC (2.4 mmol L-1) using 0.1 mol L-1 TEABr as
supporting electrolyte, since the extraction procedure was more efficient for this electrolyte. Voltammetric studies performed using TEABr and TBABF4 have shown that the voltammetric behavior of TEC does not change significantly by replacing the supporting electrolyte. Electrolyses performed in absence of a proton donor either at −1.8 or −2.3 V led to a very complex mixture of products, probably due to the coupled chemical reactions involving electrogenerated intermediates. TLC results have shown at least four products for the electrolyses performed at both potentials; 1H NMR spectra obtained for these samples
were very complex and have not allowed any product identification.
In order to minimize coupled chemical reactions involving electrogenerated intermediates, electrolyses of TEC were performed in presence of a proton donor aiming to decrease the lifetime of these species by protonation/hydrogenation. The addition of the proton donor has not caused significant changes on the TEC voltammetric behavior. Elving and Tang 41 have studied the
electroreduction of several chloroacetic acids. The authors found that the reduction of these acids involves the cleavage of C-Cl bonds and that their reduction is pH-independent processes. Thus, the independence of the voltammetric behavior of TEC in the presence of a proton donor suggests that its electroreduction involves the cleavage of its C-Cl bonds. The charge values obtained in the electrolyses in presence of a proton donor were very high as a consequence
Figure 3. Cyclic voltammograms obtained in acetonitrile/TBABF4 (0.1
mol L-1) at 100 mV s-1. (A) Before the electrolysis of 2.0 mmol L-1 TEC
of simultaneous reduction of TEC and H+; therefore these
values could not be used for diagnostic purposes.
The electrolyses performed in presence of HFIP (0.1 mol L-1) as a proton donor at −2.3 V have produced
the completely dechlorinated TEC derivative (I, Scheme 1) as its sole product. TLC analyses for these samples have shown only one chromatographic spot with Rf = 0.42; Rf for TEC on this chromatographic plate equal to 0.75. The
1H NMR spectra for these samples have not presented
signs relative to impurities such as solvents or water used in extraction procedure indicating that (I on scheme 1) is the only chemical specie present in these residues. The masses of residues obtained after extractions for repeated electrolyses varied from 18 to 21 mg, corresponding to yields, in terms of number of mols, ranging from 82 to 97% (n = 3).
Electrolyses performed in presence of HFIP (0.1 mol L-1)
as a proton donor at −1.8 V have produced a mixture of three compounds: unreacted TEC (15%), its completely dechlorinated derivative (15%) and TEC derivative whose groups CHCl2 were reduced to CH2Cl (70%, II on Scheme 1). The 1H NMR spectra obtained for these samples
have shown that unreacted TEC, I and II are the only components of the residue obtained after extraction. TLC analyses confirmed the presence of three chromatographic spots with Rf = 0.30; 0.42 and 0.75. Comparing these results with those obtained for electrolyses performed at −2.3 V, it was possible to conclude that Rf for II is 0.30. Yields in terms of number of mols for I and II were, 12-18% and 68-72%, (n = 3), respectively.
As previously mentioned, the charge values obtained in presence of the proton donor could not be used as diagnostic for the number of electrons transferred on TEC reduction. However, the fact of the peak currents in cyclic voltammograms to remain unchanged in presence or absence of the proton donor suggests that the number of electrons involved on TEC reduction is the same in presence or absence of proton donor. According to the classical mechanism for reduction of halogenated compounds, two electrons are transferred for each C-X bond cleavage. According to this mechanism, the number of electrons expected for the cleavage of the four C-Cl bond of TEC should be equal to 8.0. However the number of electrons observed for electroreduction of TEC was equal to 4.0, suggesting that the cleavage of each C-Cl bond involves only 1.0 electron. Some reports have demonstrated the possibility of the cleavage of C-Cl bonds to involve only one electron. This unusual behavior has been explained by the formation of Cl• instead Cl-,26 coupled chemical
reactions between the electrogenerated carbanion and the parent molecule25 or hydrogenation of the dehalogenated
radical promoted by the solvent.42 Thus, for TEC reduction,
the several coupled chemical reactions observed in absence of proton donor must involve the dehalogenated radical electrogenerated at the first electron transfer, which suppresses its reduction to the corresponding carbanion. In presence of the proton donor, the dehalogenated radical must be hydrogenated immediately after its formation, which avoids the second electron transfer and other competitive chemical reactions. The hydrogen atom added to the dehalogenated radical probably is formed by reduction of H+, which occurs simultaneously to TEC
reduction. Due to the fact of all reactions involving radicals occur after the electron transfer step, the voltammetric profile of TEC remains unchanged either in absence or presence of the proton donor, which is consistent with our experimental observations.
The yield values close to 100% for the totally dehalogenated TEC derivative, confirm the one-electron transfer by C-Cl bond, indicating that an unusual C-Cl electrochemical cleavage mechanism is involved at TEC electrochemical reduction. The results obtained in the electrolyses at both potentials in presence of HFIP are summarized on Scheme 1.
Analytical applications
Despite of the poor voltammetric profile presented by TEC, the analytical performance of linear sweep voltammetry (LSV), differential pulse voltammetry (DPV) and square wave voltammetry (SWV) were evaluated. After optimizing all operational parameters for each voltammetric technique, voltammograms were recorded at different TEC concentrations in order to plot the analytical curves. To plot these analytical curves the peak current values were sampled as the sum of both voltammetric peaks. Sensitivity (S) and detection limit (DL) were calculated from the analytical curves, DL was calculated using the equation: DL = 3sd/S,43 where sd corresponds to standard deviation
of blank signal at Ep. Table 1 summarizes the analytical parameters obtained with all voltammetric techniques evaluated.
Table 1. Analyticalparameters obtained using different voltammetric techniques for determination of TEC in acetonitrile containing TBABF4 (0.1 mol L-1) at a glassy carbon electrode
Technique Linear range / (mol L-1)
Sensitivity / (µA mol-1 L)
Detection limit / (mol L-1)
LSV 2.5 × 10⁻⁴ – 3.0 x 10⁻³ 1.8 × 10⁴ 8.0 × 10⁻⁵
DPV 1.0 × 10⁻⁴ – 1.8 x 10⁻³ 2.1 × 10⁴ 4.2 × 10⁻⁵
From Table 1 it can be observed relatively high DL values even using SWV, the most sensible voltammetric technique. The quantification limit values are close to 10-4
mol L-1 for all voltammetric technique used. The modest
analytical performance of the voltammetric techniques can be attributed to the poor voltammetric definition presented by TEC. Several studies aiming for the optimization of all operational parameters were performed for the three voltammetric techniques. However, it was not possible to improve the voltammetric profile of TEC. These results indicate that voltammetric techniques are not the best way to develop electroanalytical methods for TEC quantification.
An interesting alternative to develop new electroanalytical methods is to use amperometric detection in hydrodynamic conditions. Hydrodynamic conditions strongly improve the mass transport due to the forced convection and as a consequence, higher current values are obtained allowing the development of more sensible electroanalytical methods which have been successfully used for determination of drugs in pharmaceutical formulations.16,18,44,45 Another
advantage presented by amperometric detection is the shorter time of analysis because is not necessary to register
a complete voltammogram. This advantage becomes more evident when amperometric detection is compared with differential pulse voltammetry which requires relatively low scan rates.
Before the use of the rotating disc electrode (RDE) for analytical purposes it was performed the optimization of operational parameters by using LSV in hydrodynamic conditions. Figure 4 shows the RDE-linear sweep voltammograms for 1.0 mmol L-1 TEC in acetonitrile/
TBABF4 (0.1 mol L-1) at 500, 1000, 15000, 2000 and
2500 rpm with ν = 2.0 mV s-1.
Figure 4 shows that the current values obtained in hydrodynamic conditions are much larger than the obtained in static conditions (Figure 2, curve B), suggesting that hydrodynamic conditions could be used to develop analytical methods with higher sensitivity. From Figure 4, it can be observed an extensive region of mixed kinetic-mass transport control for potential values more negatives than −1.65 V and no distinction between the two voltammetric peaks (Figure 2, curve B), can be observed. At values more negative than −2.1 V, a convective-diffusion limited current plateau is observed. The plateau definition is increasingly lost at higher electrode rotation rate (ω) due
to an extension of the mixed control region to progressively more negative potentials. This is a well-established effect at a RDE for electrochemically irreversible systems in which the half wave potential becomes a function of ω.39
From voltammograms presented in Figure 4, a Levich plot was constructed by plotting the limiting current (iL) values (determined at −2.3 V) vs.ω1/2. The obtained plot was linear
from 500 to 2000 rpm, according to the equation: iL(µA) = 73.2 + 9.7 ω1/2(rpm1/2), with linear correlation coefficient of
0.9987. It was observed a negative deviation from linearity for ω values higher than 2000 rpm, which is consistent with a irreversible electron transfer.39
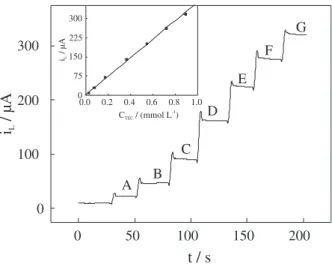
From Figure 4 it can also be observed, that the maximum of current response is obtained for ω = 2000 rpm and E = −2.3 V. These experimental conditions were employed to develop the eletroanalytical method. Amperometric measurements were performed in acetonitrile/TBABF4 (0.1 mol L-1) for successive TEC additions in order to obtain an
analytical curve. These results and the respective analytical curve are shown in Figure 5.
The current values were always sampled after 10 s from analyte addition. A plot of current as a function of TEC concentration yielded straight line from 2.5 × 10⁻⁵ to 1.0 ×
10-3 mol L-1, according to the equation: i(µA) = 0.7 + 3.6 ×
105 C
TEC(mol L-1), (n = 8), with linear correlation coefficient
of 0.9996. The analytical curve was made in triplicate and relative standard deviation values for each point were always lower than 2.0%, indicating good repeatability. It was obtained a DL value of 8.9 × 10⁻⁶ mol L-1 and S of 3.6
× 105 µA mol-1 L. Thus, a comparison of these results with
the analytical parameters obtained with the voltammetric techniques (Table 1) shows that the amperometric method in hydrodynamic conditions markedly increases the sensitivity relative to those obtained with all evaluated voltammetric techniques at static conditions. In addition,
the amperometric method allows the determination in a faster way than voltammetric techniques; therefore this method is more appropriated than voltammetric techniques for TEC quantification.
Real samples analysis
In order to investigate the analytical application of TEC amperometric detection, matrix effects were evaluated by addition-recovery experiments carried out in the pharmaceutical formulation containing TEC. Addition-recovery experiments were performed and the obtained results have show a recovery of 99 + 5%. This result is a good evidence of the accuracy of the proposed method and it indicates that matrix effects are not observed for this sample.
The proposed amperometric procedure was applied for the determination of TEC in a commercial pharmaceutical formulation. The TEC content was determined by the standard addition method and the obtained results were compared with the labeled value. The standard addition curve was linear according to the equation: iL(µA) = 81.4 + 3.6 × 10⁵ C
TEC(mol L-1), with linear correlation coefficient
of 0.9999. The slopes obtained for analytical curve and for standard addition curve were the same; confirming the absence of matrix effects in this sample. Table 2 summarizes the results obtained for TEC determination in the pharmaceutical formulation.
The statistical calculations for the obtained results have shown good precision of the proposed amperometric method, being the obtained results close to the labeled value. The results obtained were also analyzed by applying the t-test at 95% confidence level.43 The t-value obtained
Figure 4. RDElinear sweep voltammograms of 1.0 mmol L-1 TEC solution
in acetonitrile/TBABF4 (0.1 mol L-1) at 2.0 mV s-1. Figure 5. Amperometric response and analytical curve (inset curve)
had not exceeded the critical t-value, indicating that there are not statistical differences between the obtained results and the labeled value. These results demonstrate that the proposed method can be successfully employed for TEC determination in pharmaceutical formulations in a fast and simple way without any sample pretreatment.
Conclusions
The results obtained in this work have shown that the electrochemical reduction of TEC in presence of a proton donor leads to its complete dechlorination in successive and separated steps as previously observed in literature for other chloroacetamides. Electrolyses performed in presence of proton donor at −2.3 V yielded as the sole product the completely dechorinated TEC derivative. On the other hand, the electrolyses performed at −1.8 V in presence of a proton donor have promoted the partial dechlorination of TEC yielding as main product its derivative whose groups CHCl2 were reduced to CH2Cl. However, it was observed that reductive C-Cl cleavage on TEC involves only one electron by bond, which is in agreement with a non-conventional C-Cl bond cleavage mechanism. This behavior was attributed to coupled chemical reactions involving the dehalogenated radical electrogenerated at first electron transfer. In presence of a proton donor, it was observed that the dehalogenated radical is hydrogenated immediately after its formation leading to TEC dehalogenation in successive and separated steps.
This work demonstrates that the amperometric detection of TEC can be successfully used for its determination in pharmaceutical formulations without prior sample treatment. Despite the highly negative potential necessary to TEC determination, which could compromise the selectivity, this was not a serious problem to TEC determination in the pharmaceutical formulation sample. The good analytical performance and accuracy of the amperometric procedure was demonstrated by the high recovery percentages and by the concordance between the labeled value of sample and the obtained results. The method allows the reliable TEC quantification at low concentration levels which allows higher sample dilution minimizing matrix effects. In addition, the amperometric method was more sensitive,
faster and it can be used with simpler and less expensive analytical instrumentation than voltammetric techniques.
Acknowledgments
Part of this work was developed at Minho University, Portugal, in a cooperation project. The authors are grateful to CAPES contract nº BEX 1088068 (ALS) and BEX 1087061 (RMT) for financial support for this cooperation project. The authors also thank the financial support from FAPESP (contract no. 03/05567-7 (ALS) and no. 03/09334-7 (RMT)), and the Sanofi-Synthelabo Brazil Ltda by TEC and commercial samples supplied. ALS and RMT are grateful to Prof. Maria José Medeiros, Prof. Ana Paula Esteves and especially to their students Cristina S. S. Neves and Ana I. Rodrigues for all help and friendship.
References
1. World Health Organization, Entamoeba baxonomi; Bull. Health Organ1997, 75, 291.
2. Korolkovas, A.; Burckhalter, J. H.; Química Farmacêutica, Guanabara Koogan: Rio de Janeiro, 1988.
3. Reynolds,G. E. F.; Martindale the Extra Pharmacopeia, 31th
ed., The Pharmaceutical Press: Londres, 1996.
4. Hasan, N. Y.; Elkawy, M. A.; Elzeany, B. E.; Wagieh, N. E.; J. Pharm. Biomed. Anal.2002, 28, 187.
5. Daabees, H. G.; Anal. Lett.1998, 31, 1509. 6. Al-Ghanam, S.; Belal, F.; Il Farmaco2000, 56, 677.
7. Bhoir, I. C.; Raman, B.; Sundaresan, M.; Bhagwat, A. M.; Anal. Chim. Acta1997, 354, 123.
8. The United States Pharmacopoeial Convention Inc., Rochville, MD, 26th Version, 2003.
9. Özkan, S. A.; Uslu, B.; Aboul-Enein, H. Y.; Crit. Rev. Anal. Chem.2003, 33, 155.
10. El-Maali, N. A.; Bioelectrochemistry2004, 64, 99.
11. Ghoneim, M. M.; El-Ries, M.; Abd-Elaziz, A. M.; J. Pharm. Biomed. Anal.2006, 41, 1268.
12. Trindade, M. A. G.; Silva, G. M.; Ferreira, V. S.; Microchem. J.2005, 81, 209.
13. El-Desoky, H. S.; Ghoneim, E. M.; Ghoneim, M. M.; J. Pharm. Biomed. Anal.2005, 39, 1051.
14. Jain, R.; Jadon, N.; Radhapyari, K.; Talanta2006, 70, 363. 15. Uslu, B.; Ozkan, S.A.; Senturk, Z.; Anal. Chim. Acta2006, 555,
341.
16. Santos, A.L.; Takeuchi, R.M.; Mariotti, M.P.; Oliveira, M.F.; Zanoni, M.V.B.; Stradiotto, N.R.; Il Farmaco2005, 60, 671. 17. Oliveira, M.F.; Stradiotto, N.R.; Anal. Lett.2001, 34, 377. 18. Marcolino-Júnior, L.H.; Bergamini, M.F.; Teixeira, M.F.S.;
Cavalheiro, E.T.G.; Fatibello-Filho, O.; Il Farmaco2003, 58, 999.
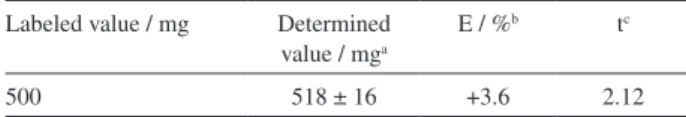
Table 2. Results of TEC determination in a commercial pharmaceutical
formulation by amperometric detection on glassy carbon rotating disc electrode
Labeled value / mg Determined value / mga
E / %b tc
500 518 ± 16 +3.6 2.12
aAverage obtained with n = 5; bRelative error vs. labeled value; cCritical
19. Hammam, E.; Beltagi, A.M.; Ghoneim, M.M.; Microchem. J.
2004, 77, 53.
20. Bonifácio, V. G.; Marcolino-Júnior, L. H.; Teixeira, M. F. S.; Fatibello-Filho, O.; Microchem. J.2004, 78, 55.
21. Teixeira, M. F. S.; Bergamini, M. F.; Marques, C. M. P.; Bocchi, N.; Talanta2004, 63, 1083.
22. Bergamini, M. F.; Teixeira, M. F. S.; Dockal, E. R.; Bocchi, N.; Cavalheiro, E. T. G.; J. Electrochem. Soc.2006, 153, E94. 23. Teixeira, M. F. S.; Bergamini, M. F.; Bocchi, N.; Talanta2004,
62, 603.
24. Santos, A. L.; Takeuchi, R. M.; Stradiotto, N. R.; J. Braz. Chem. Soc.2005,16, 922.
25. Casadei, M. A.; Di Renzo, B.; Inesi, A.; Moracci, F. M.; J. Chem. Soc. Perkin Trans.1992, 1, 375.
26. Batanero, B.; Barba, F.; Electrochem. Comm.2001, 3, 595. 27. Batanero, B.; Elinson, M. N.; Barba, F.; Tetrahedron2004, 60,
10787.
28. Prasad, M. A.; Sangaranarayanan, M. V.; J. Electroanal. Chem.
2004, 569, 127.
29. Isse, A.A.; De Giusti, A.; Gennaro, A.; Falciola, L.; Mussini, P.R.; Electrochim. Acta2006, 51, 4956.
30. Sanecki, P. T.; Skital, P. M.; Electrochim. Acta 2007, 52, 4675.
31. Peters, D. G. In Organic Electrochemistry; 4th ed., H. Lund; O.
Hammerich, eds.; Marcel Dekker: New York, 2001, p. 341. 32. Andrieux, C. P.; Saveant, J. -M.; Su, K. B.; J. Phys. Chem.1986,
90, 3815.
33. Antonello, S.; Crisma, M.; Formaggio, F.; Moretto, A.; Taddei, F.; Toniolo, C.; Maran, F.; J. Am. Chem. Soc.2002, 124, 11503.
34. Constentin, C.; Robert, M.; Saveánt, J.-M.; Chem. Phys.2006, 324, 40.
35. Prasad, M. A.; Sangaranarayanan, M. V.; Tetrahedron2005, 61, 1785.
36. Antonello, S.; Maran, F.; J. Am. Chem. Soc.1999, 121, 9668. 37. Constentin, C.; Louault, C.; Robert, M.; Teillout, A.-L.; J. Phys.
Chem. A2005, 109, 2984.
38. Ledneczki, I.; Forgo, P.; Kiss, J. T.; Molnár, Á.; Pálinkó, I.; J. Mol. Struct.2007, 834/835, 349.
39. Bard, A. J.; Faulkner, L. R.; Electrochemical Methods: Fundamentals and Applications, 2nd ed., John Wiley & Sons:
New York, 2001.
40. González-Velasco, J.; Electroanalysis1994, 6, 711. 41. Elving, P. J.; Tang, C. -S.; J. Am. Chem. Soc.1950, 72, 3244. 42. Jaworski, J. S.; Cembor, M.; Kuck, D.; Electrochim. Acta2006,
51, 6069.
43. Miller, J. C.; Miller, J. N.; Statistics for Analytical Chemistry, Ellis Horwood: West Sussex, 1993.
44. Bergamini, M. F.; Santos, A. L.; Stradiotto, N. R.; Zanoni, M. V. B.; J. Pharm. Biomed. Anal.2005, 39, 54.
45. Bergamini, M. F.; Santos, A. L.; Stradiotto, N. R.; Zanoni, M. V. B.; J. Pharm. Biomed. Anal.2007, 43, 315.
Received: December 17, 2007
Web Release Date: July 18, 2008