Article
*e-mail: [email protected]
Sulfadiazine Determination in Pharmaceuticals by Electrochemical Reduction
on a Glassy Carbon Electrode
Otoniel C. Braga, Iolana Campestrini, Iolanda C. Vieira and Almir Spinelli*
Departamento de Química, Universidade Federal de Santa Catarina, 88040-900 Florianópolis-SC, Brazil
Sulfadiazina foi quantiicada em duas amostras de produtos farmacêuticos usando voltametria de onda quadrada. O sinal analítico foi obtido por redução em vez de oxidação da sulfa sobre eletrodo de carbono vítreo. A determinação eletroanalítica foi realizada em solução-tampão Britton-Robinson 0,04 mol L-1 com pH 6,8. A redução irreversível da sulfadiazina foi observada
em –1,49 V vs. Ag/AgCl. A curva analítica foi obtida na faixa de concentração entre 62,7 e
340 µmol L-1 (r = 0,9986) e o limite de detecção foi 10,9 µmol L-1. Para uma amostra analisada,
os valores de recuperação icaram entre 94,9 e 101,1%, enquanto para a outra amostra foram entre 96,0 e 104,6%, indicando que a composição da matriz não interfere nos resultados analíticos. A exatidão do método eletroanalítico foi comparada com o método padrão de titulação amperométrica.
Sulfadiazine was quantiied in two samples of pharmaceutical preparations by square-wave voltammetry. The analytical signal response was obtained by electrochemical reduction instead of oxidation of the sulfa drug at a glassy carbon electrode. The determination was carried out in 0.04 mol L-1 Britton-Robinson pH 6.8 buffer solution. Sulfadiazine reduction was observed at
−1.49 V vs. Ag/AgCl in one well-resolved irreversible peak. The analytical curve was obtained in the concentration range of 62.7 to 340 µmol L-1 (r = 0.9986) with a detection limit of 10.9 µmol L-1.
For one sample analyzed, recovery values were in the range of 94.9 to 101.1%, while for the other sample they were within 96.0 to 104.6%, indicating no matrix interference effects on the analytical results for both sulfadiazine samples. The accuracy of the electroanalytical method was compared to the standard amperometric titration method.
Keywords: sulfadiazine, pharmaceuticals, electrochemical reduction, square-wave
voltammetry, glassy carbon electrode
Introduction
Sulfonamides are among the most widely employed antibacterial agents in both human and veterinary medicine for prophylactic and therapeutic purposes due to their low cost and eficiency in the treatment of bacterial diseases. However, the widespread use of sulfonamides can lead to problems in terms of human health, taking into consideration that allergic and toxic reactions have been observed in patients treated frequently with sulfas.1 Additionally, the control of
commercialized products is a permanent preoccupation for customers and manufacturers. Therefore, methods which are accurate, simple and economical in terms of both time and cost for drug residue monitoring as well as control processes need to be developed. Owing to concerns over the analytical
determination of sulfa drugs in edible animal products, an excellent review has been published by S. Wang et al.1 The
review considers the different chromatographic methods (HPLC, LC/MS, GC, TLC), capillary electrophoresis, enzyme-linked immunosorbant assay, biosensor immunoassay and microbiological methods. Electroanalytical methods have also been reported for the determination of sulfonamide compounds by both electrochemical oxidation2-9 and
reduction.10-15 Electrochemical oxidation at glassy carbon and
boron-doped diamond electrodes has been achieved, while the reduction reaction has been observed almost exclusively at mercury electrodes.
Sulfonamide compounds can be electrochemically oxidized at the NH2− group and reduced at the SO
2 2−group.16
Hence, the reduction potential may vary a great deal depending on the sulfonamide chemical structure, which is not the case for the oxidation potential. This electrochemical behavior can be used to determine different sulfonamides in a mixture or in complex matrices such as milk and eggs. In pharmaceuticals, however, mixtures of sulfonamides are rarely found. In order for components to be determined in a sulfonamide mixture, they must have a resolution peak potential of at least 0.1 V. This condition was achieved at a poly(3-methylthiophene) electrode14 and eleven
sulfonamide compounds were electrochemically reduced in a mixture and seven compounds determined. Among the reducible sulfonamides quantiied are sulfadiazine, sulfamerazine, 5-sulfaminouracil, sulfamethazine, sulfasalazine, sulfathiazole and sulfamethoxazole.
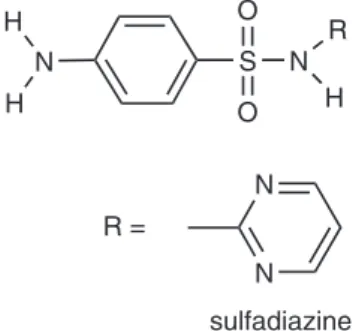
Sulfadiazine (4-amino-N-
2-pyrimidinylbenzene-sulfonamide, Figure 1) is normally used in the free form as a sodium salt. It has several applications as a systemic antibacterial agent. For instance, in ophthalmology it is used in the treatment of trachoma and ocular toxoplasmosis. It is also used in the case of patients who are sensitive to penicillin and, together with sulfamethoxazole, it is the sulfonamide antibiotic most used in human and veterinary medicine. Sulfadiazine has been quantiied principally using the oxidation reaction. Carrazon et al.3 studied sulfadiazine
oxidation at a glassy carbon electrode by differential pulse voltammetry. The determination of sulfadiazine was obtained in the range of 1.5 × 10⁻⁵ to 6.0 × 10⁻⁵ mol L-1 with a detection
limit of 5.4 × 10⁻⁶ mol L-1. The method was successfully
applied to determine sulfadiazine in a commercial pharmaceutical preparation. Rao et al.5 studied sulfadiazine
and other sulfas by cyclic voltammetry, flow injection analysis and liquid chromatography with electrochemical detection. They demonstrated the application of the BDD electrode in the simple and sensitive amperometric detection of sulfas in a standard mixture after their separation with reverse-phase HPLC. A detection limit of 50 nmol L-1 and
a linear dynamic range of three orders of magnitude were obtained for sulfadiazine. Preecharoworapun et al.7 reported
the use of the BDD electrode to detect sulfadiazine mixed
with other sulfonamides, also by cyclic voltammetry, low injection analysis and HPLC with an amperometric detector. For sulfadiazine, a linear range of 2.0 × 10⁻⁷ to
4.0 × 10⁻⁴ mol L-1 and a detection limit of 4.4 × 10⁻⁸ mol L-1
were obtained. The method was used for determination of sulfonamides in egg samples. The BDD electrode has also been used in the oxidation and direct determination of sulfadiazine in pharmaceutical products by Souza et al.8
They found a calibration curve in the concentration range of 8.01 × 10⁻⁶ to 1.19 × 10⁻⁴ mol L-1 and a detection limit
of 2.19 × 10⁻⁶ mol L-1. Owing to concerns regarding
the reduction reaction, few studies have reported the determination of sulfa drugs from a cathodic peak current. Ali10 determined azo sulfa drugs by cathodic adsorptive
stripping voltammetry at a hanging mercury electrode. Detection limits were dependent on the pre-concentration potential, pre-concentration time and chemical structure of the compound analyzed. For sulfadiazine a detection limit of 5.0 × 10⁻⁷ mol L-1 was achieved after 120 s of
pre-concentration. Fogg et al.11 describe the accumulation of
several sulfonamides, among them sulfadiazine, as copper(I) complexes at a hanging mercury drop electrode. Although sulfadiazine complexed with copper(I) was detected at the mercury surface electrode, its analytical determination was not possible because the reduction peak was smaller than those obtained with other sulfonamides and it was not as well deined in terms of separation from the background current. A linear range of 2.0 × 10⁻⁶ to 3.2 × 10⁻⁵ mol L-1
and a detection limit of 4.9 × 10⁻⁶ mol L-1 were obtained by
Diaz et al.12 for a cathodic determination of sulfadiazine at a
mercury electrode by differential pulse polarography using the partial least squares multivariate method in the solution of the non-additive signals of the sulfonamide compounds. Sulfadiazine was also reduced and determined at a glassy carbon-poly(3-methylthiophene) electrode14 by square-wave
voltammetry. The concentration ranged from 2.0 × 10⁻⁵ to
3.2 × 10⁻³ mol L-1 and the detection limit was 4.0 × 10⁻⁶ mol L-1.
As demonstrated, the reduction of sulfadiazine is commonly carried out at a mercury electrode. The main drawback regarding the use of mercury electrodes is the toxicity of mercury and its salts. Future regulations and occupational health considerations may severely restrict or even ban the use of mercury. As a result, electrode materials that can potentially replace mercury are continually being sought. Glassy carbon electrodes are not novel; on the contrary, they have been extensively employed in electrochemical and electroanalytical research. More scarce is the study of reduction reactions at a glassy carbon electrode, which is traditionally used in oxidation reaction. The aim of this paper is to describe the determination of sulfadiazine in pharmaceutical formulations using its
Figure 1. General chemical structure of sulfonamides.
N H
H
S O
O N
R
H
N N
R =
reduction reaction at a simple glassy carbon electrode by square-wave voltammetry. The proposed method, in addition to the control of pharmaceutical formulations, can be adapted to HPLC instruments that make use of amperometric detection and glassy carbon electrodes. Also, the use the low-cost and environmentally friendly materials are suitable and facilitate the implantation of this method in fast routine analysis.
Experimental
Chemicals, solutions and sample preparation
All reagents used in this study were of analytical grade purchased from Sigma. The solutions were prepared with water puriied by a Milli-Q system (model UV Plus Ultra-Low Organic Water) manufactured by Millipore (Bedford, MA, USA). Britton-Robinson, phosphate and acetate buffers were tested as the supporting electrolyte. The solution pH was adjusted with sodium hydroxide or phosphoric acid. Before the voltammetric experiments, the solutions were purged with nitrogen for 10 min in order to remove the dissolved oxygen. Perchloric acid, methanol and ethanol were tested as solvents for sulfadiazine. The shape and height of the square-wave voltammogram peaks were strongly dependent on the solvent used and its amount. Better results were obtained when sulfadiazine was dissolved in methanol. As a consequence, in all experiments described in this manuscript, sulfadiazine was dissolved in methanol and diluted with the supporting electrolyte (80:20 v/v). Stock solution of 4.0 mmol L-1 sulfadiazine was prepared
daily and less concentrated solutions of the analyte were prepared by dilution. For the recovery studies, a standard solution of sulfadiazine was added to real samples prepared from tablets of commercial pharmaceutical formulations. The standard addition method was used in order to obtain the apparent recovery. Sets of triplicate enrichments were added with increasing concentrations of the sulfa drug. The two commercially available sulfadiazines obtained, namely Suladrin® and Sulfazina®, both contained the labeled value of
500 mg. Ten tablets of each medicine were inely macerated. The powder was weighed in the quantity necessary to prepare the sample solutions, dissolved in methanol, sonicated for 5 min and diluted in a volumetric lask using the supporting electrolyte.
Apparatus
Cyclic and square-wave voltammograms were recorded using a 15 mL three-electrode electrochemical cell. The working electrode (A = 90.8 mm2) was a disc of glassy
carbon carefully cleaned before each experiment with methanol. Using this method, excellent electrode response and reproducibility were systematically observed for sulfadiazine determination. Platinum wire and Ag/AgCl saturated with KCl were used as auxiliary and reference electrodes, respectively. All potentials are quoted versus this reference electrode.
Voltammetric measurements were carried out with a Voltalab 10, model PGZ 100, potentiostat/galvanostat (Radiometer, Denmark) interfaced with a microcomputer using the VoltaMaster 4.0 software for data acquisition and analysis. Cyclic voltammmetry was employed for preliminary studies on the electrochemical behavior of sulfadiazine. Square-wave voltammetry was used for the development of the electroanalytical method and sulfadiazine determination in real samples.
Comparative method
The accuracy of the proposed method was compared to the standard amperometric titration method.17 Briely,
sulfadiazine was titrated with sodium nitrite standard solution in hydrochloric acid in the presence of potassium bromide. The end-point of the titration was determined by amperometry with two polarized platinum electrodes. The electrodes had a geometric area of 0.5 cm2 separated
by 1.5 cm. The application of 50 mV across the electrodes resulted in its polarization. With a slight excess of nitrite, the electrodes were depolarized and the current lowed. At this end-point a permanent delection of the galvanometer needle was observed.
Results and Discussion
Supporting electrolyte selection
The supporting electrolyte plays an important role in the electrochemical response. The thermodynamics and kinetics of electrochemical processes, as well as mass transfer within the cell, are dependent on its nature, concentration and pH. Three buffers with a concentration of 0.04 mol L-1 were tested as the supporting electrolyte
for sulfadiazine determination: Britton-Robinson and phosphate with pH solution adjusted to 6.8 and acetate at pH 4.5. The inluence of the supporting electrolyte on the cyclic voltammogram of 1.33 mmol L-1 sulfadiazine at a
glassy carbon electrode is shown in Figure 2. The potential was swept from 0.0 to –1.8 V and back to 0.0 V at a scan rate of 70 mV s-1. In all voltammograms, just one reduction
with a cathodic current density of 11.33 µA cm-2. Under
these conditions sulfadiazine was more easily reduced that in phosphate (−1.36 V; Figure 2b) and Britton-Robinson
(−1.46 V; Figure 2c) buffers, but the analytical signal, i.e.
the current density, was lowest. In the two buffers with pH 6.8, the current density was 22.83 µA cm-2, but the reduction
peak was better deined in the Britton-Robinson solution, in spite of the reduction occurring closer to the hydrogen evolution reaction. In order to achieve a compromise between sensitivity (current density) and resolution (potential) parameters, the Britton-Robinson solution was selected for further experiments.
Inluence of pH
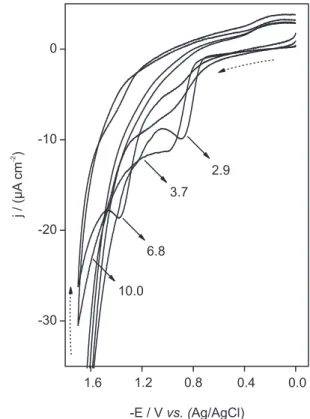
In Figure 3 the influence of pH on the cyclic voltammograms of 1.33 mmol L-1 sulfadiazine at a glassy
carbon electrode in 0.04 mol L-1 Britton-Robinson solution
is shown. The proile of the j vs. E curves remains the same over the pH range studied, showing a single reduction peak, which indicates that a irreversible electrochemical process takes place at the electrode surface. However, with the increase in pH the reduction peak potential shifted toward more negative values, while the current density increased from pH 3.0 to 7.0 and then decreased. The shift in the potential toward more negative values
indicates the participation of protons in the electrode reaction process and that the reduction of sulfadiazine is thermodynamically disfavored with the increase in pH. The slope of the E vs. pH plot for the pH range of 3.0 to 7.0 was 138 mV pH-1 and for the pH between 7.0 and
10.0 was 33 mV pH-1, indicating that a different number
of electrons and protons participate in the reaction. This behavior has been previously reported by other authors.12,15
The intersection of the two straight lines matches the pKa of the sulfonamide group (SO2NH2–). The value
found (6.8) is very close to that reported in the literature (6.5).18 The maximum current density observed at around
pH 7.0 indicated a promising analytical sensitivity at approximately this pH. Thus, pH 6.8 was selected as an appropriate working pH for sulfadiazine determination.
Inluence of the potential scan rate
The influence of the potential scan rate on the sulfadizine reduction was studied over 20 to 500 mV s-1
for 1.33 mmol L-1 sulfadiazine in 0.04 mol L-1
Britton-Robinson pH 6.8 solution at a glassy carbon electrode. One well-resolved irreversible reduction peak was observed at
−1.46 V for a scan rate of 70 mV s-1, which was used as
the analytical signal for sulfadiazine quantization. The peak potential shifted to more negative values as the scan rate
Figure 2. Cyclic voltammogram for 1.33 mmol L-1 sulfadiazine in 0.04 mol L-1 (a) acetate pH 4.5, (b) phosphate pH 6.8 and (c) Britton-Robinson pH 6.8 solutions at a glassy carbon electrode, v = 70 mV s-1.
increased (r = 0.990), in agreement with the irreversible electrochemical behavior observed for sulfadiazine reduction. Furthermore, a linear log j vs. log v plot was obtained for the sulfadizine compound with a slope of 0.51 and r = 0.994, which is consistent with a diffusion-controlled reduction process. A detailed study of the reaction mechanism of the electrochemical reduction of sulfadiazine was beyond the scope of this paper. However, in this regard, the reduction of nine benzenesulfonamides at a mercury cathode has been studied in acetonitrile.19
Reactions were shown to be quite similar to those of alkyl and aryl halides. A two-electron process forms an intermediate that undergoes scission of the S-N bond to produce sulinate and amide ions. Primary and secondary sulfonamides lose a proton to the amide ion, producing a sulfonamide anion which is electrochemically inactive. Also, Horner et al.20 reported the cleavage of the S-N bond in the reduction of a series of sulfonamides in methanolic tetramethylammonium chloride at a mercury electrode forming amines and sulinic acid as products. On the other hand, Manousck et al. (cited by Cottrell and Mann19) reported a reaction that involves cleavage of the C-S bond to produce, for example, p-cyanobenzenesulfonamide, benzonitrile, SO2 and NH3 in the reduction of benzenesulfonamides substituted with strongly withdrawing groups at mercury electrodes in aqueous borate buffers. No reports were found in the literature on the electrochemical reduction of sulfonamides at glassy carbon electrodes. Perhaps, this paper can be considered as a basis for further research aiming to study the mechanism of the electrochemical reduction of sulfadiazine (or other sulfonamides) at a simple glassy carbon electrode. As will be demonstrated below, the current generated by the electrochemical reduction of sulfadiazine produces an excellent analytical signal for sulfadiazine determination.
Optimization of square-wave voltammetry parameters
The electroanalytical method for determination of sulfadiazine was developed using square-wave voltammetry, which is an effective and well-established pulse voltammetric technique suitable for determination of organic compounds.8,21-23 The response obtained by
square-wave voltammetry is dependent on parameters such as frequency (f), pulse height (∆Ep) and scan increment (∆Es), which have a combined inluence on
the peak current. Hence, they were analyzed in order to optimize the experimental set-up for sulfadiazine determination. The square-wave parameter optimization was carried out in solutions of 0.34 mmol L-1 sulfadiazine
in 0.04 mol L-1 Britton-Robinson pH 6.8 buffer. The
cathodic current density increased with an increase in the frequency at constant ∆Ep and ∆Es. Two straight
lines with different slopes and an intercept at 60 Hz were noted. At higher frequencies, a broadening and a distortion in the voltammograms were also observed. An excellent compromise between the voltammetric proile and sensitivity was obtained at the intersection point. Consequently, the frequency of 60 Hz was chosen and used in subsequent experiments. The current density values increased linearly up to 40 mV with the pulse height variation and remained almost constant for higher
∆Ep values at constant f and ∆Es. This ∆Ep value was then
used throughout the following experiments. Finally, the interdependence between cathodic current density and
∆Es at ixed f and ∆Ep was studied. The highest current
density was observed, and then selected, for an ∆Es of
5 mV. The optimized values were subsequently used to validate the proposed method as well as for sulfadiazine determination in the two commercial samples analyzed
Analytical curve and validation parameters of the method proposed
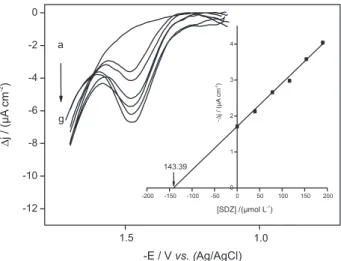
In order to obtain an analytical curve for sulfadiazine determination, square-wave voltammograms were obtained from −1.1 to −1.8 V and the resultant cathodic current
density, ∆j/µA.cm-2, was registered at the peak potential
under optimized conditions. The experiments were carried out with successive additions of sulfadiazine standard solutions in Britton-Robinson pH 6.8 buffer with a glassy carbon working electrode. The resulting square-wave voltammograms are shown in Figure 4; the inset shows the corresponding analytical curve and some parameters for validation of the proposed method are given in Table 1. As can be seen, a well-defined irreversible reduction peak was obtained, with the current density increasing proportionally to the sulfadiazine concentration. A good linear response range of 62.7 to 340 µmol L-1 sulfadiazine
with a correlation coeficient of 0.9986 was obtained. The equation for the straight line can be expressed according to
∆j/µA cm-2 = 0.183 + 0.0274 [sulfadiazine]/ µmol L-1. From
this plot, the detection limit (DL) was calculated according to the equation: DL = 3Sb/B, where Sb is the standard deviation of the y-coordinate from the line of best it (linear coeficient) and B the slope (angular coeficient) of this line. The calculated DL for sulfadiazine was 10.9 µmol L-1.
for square-wave voltammetric experiments. On the other hand, the peak potential did not shift signiicantly following the addition of sulfadiazine. As a consequence, excellent repeatability and reproducibility were obtained at −1.49 V for the square-wave voltammograms. The
repeatability (expressed as relative standard deviation, %) for seven measurements of the peak potential and current in solutions of 0.31 mmol L-1 sulfadiazine under the
optimized conditions were 0.20% and 0.45%, respectively. The reproducibility of the peak potential and current was also tested over seven days with different solutions of sulfadiazine prepared in the concentration of 0.31 mmol L-1.
The relative standard deviations were 0.28% and 0.51%, respectively. These results demonstrate that the proposed method shows excellent accuracy, precision, reproducibility and sensitivity.24
Recovery studies and sulfadiazine determination in pharmaceutical preparations
The recovery experiments were carried out adding standard solutions of sulfadiazine to two matrices of commercial pharmaceutical products, namely Suladrin®
(Figure 5) and Sulfazina®, designated as samples A and B,
respectively, in this text. The solutions prepared from the two samples were diluted in order to achieve concentrations in the range of those used in the analytical curve. As demonstrated in Table 2, the recovery ranged from 94.9 to 101.1% for sample A and from 96.0 to 104.6% for sample B, indicating the absence of matrix interference effects. The acceptable recovery percentage is dependent on the analyte concentration. For example, for the analysis of residues the acceptable recovery range is generally 70 to 120%, while for matrices containing 100% of the analyte it is 98 to 102%.25, 26
Table 1. Validation parameters for electroanalytical determination of sulfadiazine
Parameter Value
Peak potential (V) Linear range (µmol L-1) Correlation coeficient Slope (µA L mol-1 cm-2)
Standard deviation of slope (µA L mol-1 cm-2 )(x 10-4) Intercept (µA cm-2)
Standard deviation of intercept (µA cm-2 )(x 10-2) Detection limit (µmol L-1)
Repeatability of peak potentiala,b Repeatability of peak currenta,b Reproducibility of peak potentiala,b Reproducibility of peak currenta,b
−1.49 62.7 to 340
0.9986 0.0274 4.86 0.183
9.95 10.9 0.20 0.45 0.28 0.51 aRelative standard deviation, %; bn = 7.
Figure 4. Square-wave voltammograms for sulfadiazine in 0.04 mol L-1 Britton-Robinson pH 6.8 solution at a glassy carbon electrode under optimized conditions. (a) blank, (b) 62.7 µmol L-1, (c) 83.1 µmol L-1, (d) 103.0 µmol L-1, (e) 123.0 µmol L-1, (f) 142.0 µmol L-1, (g) 161.0 µmol L-1, (h) 199.0 µmol L-1, (i) 236.0 µmol L-1, (j) 271.0 µmol L-1 (k) 307.0 µmol L-1, (l) 340.0 µmol L-1. Inset: analytical curve.
Table 2. Recovery studies for sulfadiazine determination in commercial pharmaceutical products
Analytes Addeda Found Recovery (%)
Sample A (µmol L-1) 39.5 78.2 116.2 153.5 190.0
37.5 78.3 110.9 154.7 192.1
94.9 100.1
95.4 100.8 101.1 Sample B (µmol L-1) 39.5
78.2 116.2 153.5 190.0
37.9 81.8 116.0 153.0 185.6
96.0 104.6
99.8 99.7 97.7 an = 3.
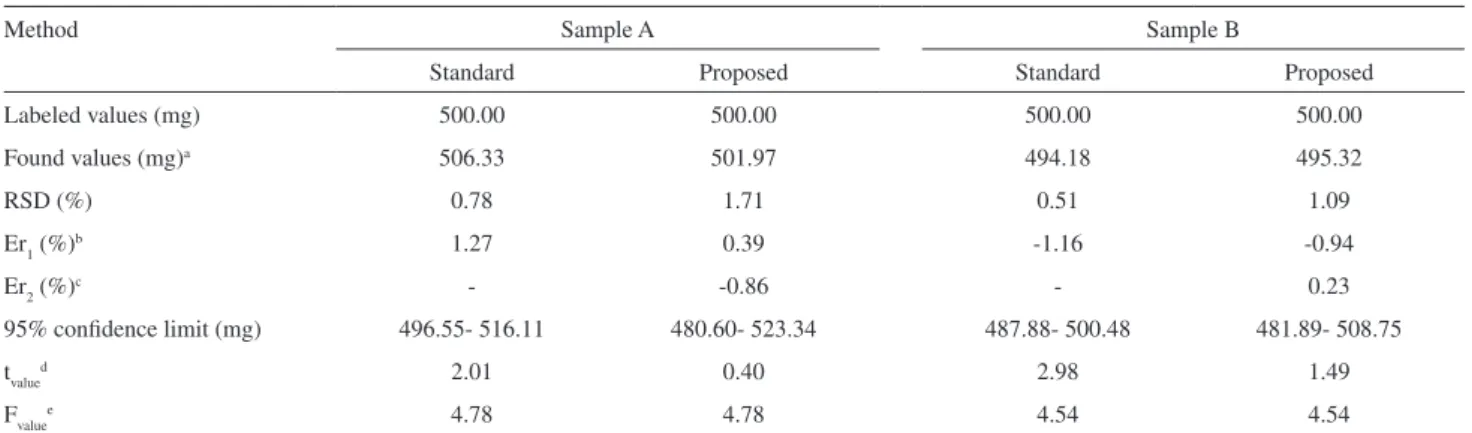
The two commercial pharmaceutical formulations containing sulfadiazine were independently analyzed by square-wave voltammetry following the above-described electroanalytical method and also by the standard amperometric titration method.17 Table 3 gives some of
the results obtained. The relative standard deviation (RSD) of the mean of three determinations, for both sulfadiazine samples, was lower than 1.0% using the standard method and lower than 2.0% using the proposed method. The values for the relative error between the standard method and the labeled value were 1.27 for sample A and –1.16 for sample B, while for the proposed method the respective values were 0.39 and –0.94. The values for the relative error between the proposed method and the amperometric method were -0.86 for sample A and 0.23 for sample B. Furthermore, in Table 3 the good concentration range for sulfadiazine determination at the 95% of conidence level, using the two methods and for both samples is shown. The t-test was carried out in order to check the validity of the data obtained using the standard and the proposed method. At the 95% conidence level all calculated tvalue values were less than 4.30, i.e. the ttheoreticalvalue for the mean of three experiments, indicating that there are no signiicant differences between the data obtained using the two methods and the true (labeled) values. Finally, the precision of the proposed method was compared to that of the standard method through statistical examination of the values obtained from F-tests, also at the 95% conidence level. The Fvalue value for both samples of sulfadiazine was lower than the Ftheoretical value (19), verifying the excellent performance of the electroanalytical method when compared to the standard method.
The parameters shown in Tables 1 to 3 indicate that the analytical signal produced by the electrochemical reduction of sulfadiazine at a glassy carbon electrode can be successfully applied to the determination of this sulfa drug in control procedures as well as in trace analysis.
This behavior indicates that the glassy carbon electrode is a excellent material also for electroanalytical determination by reduction of analytes and conirms results previously published.27 Additionally, a detection limit of 10.9 µmol L-1
was obtained for sulfadizine determination at a glassy carbon electrode, while detection limits of 0.510 and 4.9 µmol L-1 12
were obtained with mercury electrodes and 4.0 µmol L-1 14
with a glassy carbon-poly(3-methylthiophene) electrode. As can be seen, the direct determination by electrochemical reduction of sulfadiazine at a glassy carbon electrode is comparable to the existing methods which employ other electrodes, however, with clear advantages including the use of non toxic reagents which are not potentially hazardous in terms of human health.
Conclusions
A simple glassy carbon electrode was used in combination with the square-wave voltammetry technique to develop a novel and alternative electroanalytical method for sulfadiazine determination through the reduction of the sulfa compound. The proposed approach showed excellent performance and great potential for application in control procedures. Sulfadiazine was successfully determined with a detection limit of 10.9 µmol L-1 which is comparable to
those obtained using mercury electrodes. This low detection limit indicates that the proposed electroanalytical method is attractive and also suitable for trace analysis. In addition, due to the simplicity of the preparation procedures, fast routine determination can be achieved by direct electrochemical reduction of sulfadiazine.
Acknowledgments
The authors wish to thank CAPES and CNPq for scholarships and inancial support.
Table 3. Sulfadiazine determination in commercial pharmaceutical products
Method Sample A Sample B
Standard Proposed Standard Proposed
Labeled values (mg) 500.00 500.00 500.00 500.00
Found values (mg)a 506.33 501.97 494.18 495.32
RSD (%) 0.78 1.71 0.51 1.09
Er1 (%)b 1.27 0.39 -1.16 -0.94
Er2 (%)c - -0.86 - 0.23
95% conidence limit (mg) 496.55- 516.11 480.60- 523.34 487.88- 500.48 481.89- 508.75
tvalued 2.01 0.40 2.98 1.49
Fvaluee 4.78 4.78 4.54 4.54
an = 3; bEr
1 = relative error between standard or proposed methods and labeled values; cEr2 = relative error between method proposed and standard; dt
References
1. Wang, S.; Zhang, H. Y.; Wang, L.; Duan, Z. J.; Kennedy, I.;
Food Addit. Contam.Part A 2006,23, 362.
2. Momberg V., A.; Carrera B., M. E.; Von Baer, D.; Brun F., C.; Smyth, M. R.; Anal. Chim. Acta1984,159, 119.
3. Carrazon, J. M. P.; Corona, P. C.; Diez, L. M. P. ; Electrochim. Acta1987,32, 1573.
4. Carrazon, J. M. P.; Recio, A. D.; Diez, L. M. P. ; Talanta1992,
39, 631.
5. Rao, T. N.; Sarada, B. V.; Tryk, D. A.; Fujishima, A.;
J. Electroanal. Chem.2000,491, 175.
6. Abdullin, I. F.; Chernysheva, N. N.; Budnikov, G. K.; J. Anal.
Chem. 2002,57, 629.
7. Preechaworapun, A.; Chuanuwatanakul, S.; Einaga, Y.; Grudpan, K.; Motomizu, S.; Chailapakul, O.; Talanta2006,
68, 1726.
8. Souza, C. D.; Braga, O. C.; Vieira, I. C.; Spinelli, A.; Sens.
Actuators, B2008,135, 66.
9. Özkorucuklu, S. P.; Sahin, Y.; Alsancak, G.; Sensors2008,8,
8463.
10. Ali, A. M. M.; Anal. Lett.1993,29, 1635.
11. Fogg, A. G.; Rahim H. M. Yussof, A.; Moreira, J. C.; Zhao, R.;
Anal. Proc. 1995, 32, 95.
12. Diaz, T. G.; Cabanillas, A. G.; Valenzuela, M. I. A.; Sallinas,
F.; Analyst 1996,121, 547.
13. Kotouček, M.; Skopalová, J.; Michálková, D.; Anal. Chim. Acta
1997,353, 61.
14. Msagati, T. A. M.; Ngila, J. C.; Talanta2002,58, 605. 15. Sabry, S. M.; Anal. Lett.2007,40, 233.
16. Voorhies, J. D.; Adams, R. N.; Anal. Chem.1958,30, 346. 17. British Pharmacopeia, Crown Copyright: United Kingdom,
1988, v. 2, Appendix VIII C, A113.
18. Stober, H.; DeWitte, W.; Analytical Proiles of Drug Substances,
Academic Press: New York, 1982.
19. Cottrell, P. T.; Mann, C. K.; J. Am. Chem. Soc.1971,93, 3579
and references therein.
20. Horner, L.; Neumann, H.; Chem. Ber.1965,98, 3462.
21. Medeiros, R. A.; Carvalho, A. E.; Rocha-Filho, R. C.; Fatibello-Filho, O.; Talanta 2008,76, 685.
22. Souza, D.; Codognoto, L.; Malagutti, A. R.; Toledo, R. A.; Pedrosa, V. A.; Oliveira, R. T. S.; Mazo, L. H.; Avaca, L. A.; Machado, S. A. S.; Quim. Nova2004,27, 790.
23. Osteryoung, J. G.; Osteryoung, R. A.; Anal. Chem.1985, 57,
101A.
24. Bengi, U.; Topal, B. D.; Ozkan, S. A.; Talanta 2008, 74, 1191.
25. Ribani, M.; Bottoli, C. B. G.; Collins, C. H.; Jardim, I. C. S. F.; Melo, L. F. C.; Quim. Nova2004,27, 771.
26. Gustavo González, A.; Ángeles Herrador, M.; Trends Anal.
Chem.2007, 26, 227.
27. Santos, A. L.; Takeuchi, R. M.; Stradiotto, N. R.; Esteves, A. P.; Medeiros, M. J.; J. Braz. Chem. Soc. 2008, 19, 1144.