Article
Printed in Brazil - ©2014 Sociedade Brasileira de Química0103 - 5053 $6.00+0.00
A
*e-mail: [email protected]; [email protected]
A New Electrochemical Sensor Containing a Film of Chitosan-Supported
Ruthenium: Detection and Quantification of Sildenafil Citrate and Acetaminophen
Fábio Godoy Delolo,*,a Claudia Rodrigues,a Monize Martins da Silva,a Luis Rogério
Dinelli,b Felix Nicolai Delling,c Julio Zukerman-Schpectorc and Alzir Azevedo Batista*,a
aLaboratório de Estrutura e Reatividade de Compostos Inorgânicos, Departamento de Química,
Universidade Federal de São Carlos, Rod. Washington Luís, km 235, 13565-905 São Carlos-SP, Brazil
bFaculdade de Ciências Integradas do Pontal, Universidade Federal de Uberlândia,
Rua Vinte, 1600, 38304-402 Ituiutaba-MG, Brazil
cLaboratório de Cristalografia Estereodinâmica e Modelagem Molecular, Departamento de Química,
Universidade Federal de São Carlos, Rod. Washington Luís, km 235, 13565-905 São Carlos-SP, Brazil
Este trabalho apresenta a construção de um novo sensor eletroquímico para detecção de analitos orgânicos, usando um eletrodo de carbono vítreo (GCE) modificado com um filme de rutênio suportado em quitosana. O filme de rutênio suportado em quitosana foi obtido a partir da síntese do complexo mer-[RuCl3(dppb)(H2O)] como precursor de [1,4-bis(difenilfosfina)butano] (dppb), e
quitosana (QT). A estrutura do filme de rutênio suportado em quitosana na superfície do eletrodo de carbono vítreo foi caracterizada por espectroscopia UV-Vis, ressonância paramagnética eletrônica (EPR), microscopia eletrônica de varredura (SEM), microscopia de força atômica (AFM), difração de raios X de pó (XRD) e espectroscopia de absorção atômica (AAS). Um eletrodo de carbono vítreo foi modificado com um filme formado pela evaporação de 5 µL de uma solução composta de 5 mg de composto de rutênio suportado em quitosana (RuQT), solubilizado em 10 mL de ácido acético 0,1 mol L-1. Este eletrodo modificado foi testado como sensor eletroquímico para detecção de citrato de sildenafil (Viagra® 50 mg) e acetaminofen (Tylenol®). A técnica utilizada para essas análises foi voltametria de pulso diferencial (DPV), em 0,1 mol L-1 de H
2SO4 (pH 1,0) e 0,1 mol L-1 de CH
3COOK (pH 6,5) como eletrólitos suporte. Todas as análises foram realizadas durante um mês utilizando-se o mesmo eletrodo, sendo lavado com bastante água entre as análises de um analito e de outro e mantendo-o em geladeira quando não utilizado. Este eletrodo mostrou-se estável durante o período utilizado mostrando a não degradação do filme e apresentou uma resposta linear no intervalo de concentração avaliado (1,25 × 10⁻⁵ a 4,99 × 10⁻⁴ mol L-1).
This work presents the construction of a novel electrochemical sensor for detection of organic analytes, using a glassy carbon electrode (GCE) modified with a chitosan-supported ruthenium film. The ruthenium-chitosan film was obtained starting from the mer-[RuCl3(dppb)(H2O)] complex as a [1,4-bis(diphenylphosphine)butane] (dppb) precursor, and chitosan (QT). The structure of the chitosan-supported ruthenium film on the surface of the glassy carbon electrode was characterized by UV-Vis spectroscopy, electron paramagnetic resonance (EPR), scanning electron microscopy
(SEM), atomic force microscopy (AFM), powder X-ray diffraction (XRD) and atomic absorption spectroscopy (AAS) techniques. The glassy carbon electrode was modified with a film formed from the evaporation of 5 µL of a solution composed of 5 mg chitosan-supported ruthenium (RuQT) in 10 mL of 0.1 mol L-1 acetic acid. The modified electrode was tested as a sensor for sildenafil citrate (Viagra® 50 mg) and acetaminophen (Tylenol®) detection. The technique utilized for these analyses was differential pulse voltammetry (DPV) in 0.1 mol L-1 H
2SO4 (pH 1.0) and 0.1 mol L-1 CH3COOK (pH 6.5) as supporting electrolyte. All analyses were carried out during a month using the same electrode. The electrode was washed only with water in between the analyses, keeping it in the refrigerator when it was not in use. This electrode was stable during the period utilized showing no degradation and presenting a linear response over the evaluated concentration interval (1.25 × 10⁻⁵ to 4.99 × 10⁻⁴ mol L-1).
Keywords: polymer-supported ruthenium compound, chitosan, modified glassy carbon
Introduction
The chemistry of ruthenium complexes has attracted continuous attention because of the wide variety of structures, reactivities and applications presented by these compounds. Particular emphasis has been placed on their electron-transfer properties and ability to catalyze a wide range of homogeneous organic reactions,1-4 with their high
performance. Ruthenium complexes have also been studied with respect to their cytotoxicity against several diseases5-7
and as electrochemical sensors.8
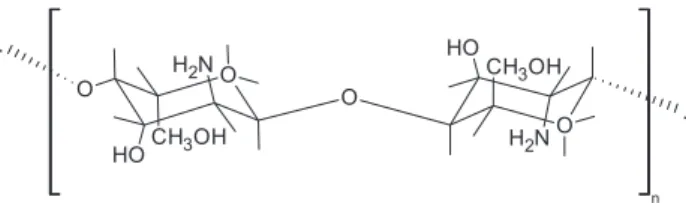
Chitosan (QT, Figure 1) is a pseudo natural polysaccharide extracted mainly from crustacean shells. It becomes water soluble under acidic conditions as soon as pH is lower than 6 and if the average degree of acetylation (DA) is equal or lower than 0.5.9 The solubilization
occurs by protonation of the –NH2 function on the C-2
position of the D-glucosamine repeat unit, whereby the polysaccharide is converted to a polyelectrolyte in acidic media. Since it is soluble in aqueous solutions, it is largely used in different applications as solutions, gels, or films and fibers.10
The great interest in QT is due to its conceivable applications, such as photography, biotechnology, cosmetics, food processing, biomedical products (artificial skin, wound dressing, contact lenses, etc.), formation of films, colloids, powders, flakes, gel beads, and fibers, which make it an excellent candidate as a support for liquid phase catalysis, for a system of controlled liberation of medicines (capsules and microcapsules) and for the treatment of industrial effluents for the removal of metallic and coloring ions. The properties of QT, such as hydrophilic, positively charged, biodegradable, non-toxic, having a high sorption capacity for metal ions, biocompatibility and insolubility in the majority of common solvents, such as water, organic solvents and aqueous bases make it suitable to be used in a broad group of applications.11-19 QT has received much
attention for the design of modified electrodes, such as the glassy carbon electrode (GCE), for application in electroanalysis, due to its excellent film-forming ability, bio-compatibility, non-toxicity, biodegradability, high mechanical strength, cheapness and high susceptibility
to chemical modifications leading to a film-forming ability, water permeability, mechanical strength and good adhesion. Therefore, those properties make this biopolymer an excellent choice for the elaboration of biosensors.13,20-22 Methods for QT film preparation
described in the literature can be broadly divided into four groups, namely: solvent evaporation, neutralization, cross-linking, and ion tropic gelation methods.23,24
The present study describes the construction of a QT film doped with a ruthenium(III) phosphine complex, which was used to modify a GCE. The chitosan-supported ruthenium compound (RuQT) was characterized by UV-Vis spectroscopy, electron paramagnetic resonance (EPR), scanning electron microscopy (SEM), atomic force microscopy (AFM), powder X-ray diffraction (XRD)
and atomic absorption spectroscopy (AAS) techniques.
The film on the electrode surface was characterized by AFM, and it was applied as an electrochemical sensor in detection and quantification of sildenafil citrate (Viagra®) and acetaminophen (Tylenol®).
Experimental
Materials for synthesis
Solvents were purified by standard methods. All chemicals used were of reagent grade or comparable
purity. RuCl3·3H2O was purchased from Aldrich. The
ligands 1,4-bis(diphenylphosphino)butane (dppb) and the QT polymer (low molecular weight), 82% deacetylation degree were purchased from Aldrich. The compounds acetaminophen (> 98% of purity) and sildenafil citrate (> 99% of purity), used as standard to plot the calibration curve, were used as received form Aldrich. The commercial drugs Viagra® and Tylenol® were utilized
as received.
The mer-[RuCl3(dppb)(H2O)] complex was prepared
according to published procedures.25
Instrumentation
UV-Vis spectra of the complex in acetic acid solution were recorded with a Hewlett Packard 8452A diode array. EPR spectra were obtained using a Bruker spectrometer model EMX plus, coupled with a standard or cylindrical resonator cavity. The spectra were obtained in frozen solutions in a 5 mm o.d. (2.0 mm i.d.) heavy wall EPR quartz tube (Wilmad glassware), using attenuation of 20 dB (2mW power), 54 ms conversion time, 163.84 ms time constant, 4G modulation amplitude, 100 kHz frequency amplitude, 32 scans and 3072 points, 1.0 × 10⁴ detection,
9.51 GHz frequency. All measurements were carried out at 77 K.
DPV experiments, in solution, were obtained in an electrochemical analyzer BAS model 100B instrument. The electrochemical experiments using the electrochemical sensor were carried out at room temperature, in 0.1 mol L-1 sulfuric acid (H
2SO4, pH 1.0)
and 0.1 mol L-1 potassium acetate (CH
3COOK, pH 6.5)
as supporting electrolyte using a one-compartment cell where the working and auxiliary electrodes were stationary Pt foils, and the reference electrode was
Ag/AgCl, 0.10 mol L-1 in KCl. The high-performance
liquid chromatography (HPLC) analyses were performed on a Shimadzu UV-Vis SPD-10 AVP.
SEM analyses were performed on FEI Inspect S 50 equipment and the AFM were performed on a Digital Instruments NanoScope V, both in the Laboratory of Structural Characterization (LCE), at the Department of Material Engineering, Federal University of São Carlos (UFSCar). AAS analyses were performed in an Analyst 300 Perkin Elmer equipment at the analytical laboratory of the Leibniz-Institut für Katalyse e. V. an der Universität Rostock in Rostock, Germany.
Powder X-ray diffraction
The powder XRD data were recorded on a Bruker D2 PHASER diffractometer with a LynxEYe detector using Cu Kα
1,2 radiation (1.5418 Å). All samples were measured
at 295 K. The data were collected in the Bragg-Brentano (θ/2θ) horizontal geometry between 5.00145 and 60.15145°
(2θ) in 0.02020130° steps, at 191 s step–1. The optics of
the D2 PHASER diffractometer was a system of Soller slit module with 2.5º, a divergence slit with 0.6 mm and a Ni filter. The X-ray tube operated at 30 kV and 10 mA.
Synthesis
The precursor mer-[RuCl3(dppb)(H2O)] was obtained
reacting [RuCl2(dppb)(PPh3)] diluted in methanol with Cl2
gas, produced by the reaction between KMnO4 and HCl,
according to the described in literature.25
Synthesis of RuQT compound
The RuQT compound was prepared by reacting a solution containing the precursor mer-[RuCl3(dppb)(H2O)]
(0.2 g, 0.31 mmol) previously diluted in methylene chloride
(CH2Cl2) with a solution containing QT (0.5 g, 0.71 mmol)
previously diluted in 0.1 mol L-1 acetic acid. The reaction
mixture was stirred during 3 hours. The final blue viscous solution was dried in a lyophilizer and the blue solid was
washed with water, filtered off and dried under vacuum. Yield was 97%. Elemental analysis experimental values (%) were determined by AAS: C 38.35, H 6.62, N 6.36, Cl 0.40 and Ru 0.24.
Preparation of working electrodes
The RuQT compound (5 mg) was dissolved in 10 mL of 0.1 mol L-1 acetic acid and magnetically stirred for 40 min.
An aliquot (5 µL) of the solution was applied on the surface of a GCE and air-dried at room temperature. A GCE coated with free QT was obtained in a similar way, including the application of a 2% aqueous acetic acid solution of QT (1.5 mg cm-3). The thicknesses of the membranes at the
surface of the electrodes were determined by AFM and were found to be about 31.8 nm.
Electrochemical analyses
In order to evaluate the electrochemical response and the stability of the developed modified electrode, two different pharmaceutical compounds were analyzed by differential pulse voltammetry (DPV). Solutions of 1.0 × 10⁻² mol L-1 sildenafil citrate and 1.0 × 10⁻² mol L-1
acetaminophen were prepared and analyzed separately. The drugs were analyzed in two different pH values, which were obtained using 0.1 mol L-1 H
2SO4 (pH 1.0) and 0.1 mol L-1
CH3COOK (pH 6.5) as electrolytes.
The electrolytes mentioned above were used as references (blanks) for the subsequent analyses. After performing the blank, 25 µL aliquots of each drug were added until a total volume of 50 µL. For analyses up to 250 µL, aliquots of 50 µL were used. The same procedure was performed until 1050 µL adding 100 µL aliquots (concentration range 1.5 ×10⁻⁵ to 4.99 × 10⁻⁴ mol L-1).
The scan rate used was 100 mV s-1. In order to confirm
that the RuQT electrode was appropriate for the detection and quantification of the analyzed drugs, the analysis of the solution was compared with the two electrodes, the unmodified ones and the QT modified electrodes.
HPLC method
The DPV results obtained were compared with those results obtained by HPLC. The analytical column used was a C18 (15 × 0.46 cm; 10 µm). The analyses were performed
in isocratic elution and the conditions of analysis were different for each drug:
• Acetaminophen: mobile phase was 60% methanol and
• Sildenafil citrate: mobile phase was 90% methanol and
10% acetate buffer, flow of 1 mL min-1. Detection in λ = 290 nm.
Samples were prepared by dilution method with initial concentration of 1 mg mL-1. Injections were performed in
triplicate of 50 µL each.
Results and Discussion
The presence of ruthenium(III) in RuQT was confirmed by EPR in solid state (Figure 2), having been observed in the spectrum the presence of more than one ruthenium(III) species. The authors suggest that the ligand H2O present in
precursor mer-[RuCl3(dppb)(H2O)] could be substituted by
QT, presenting in two ways. One of which is coordinated by the nitrogen atom (NQT) and the other by the oxygen
atom (OQT) in a monodentate way: ([RuCl3(dppb)(NQT)]
and [RuCl3(dppb)(OQT)]).
The UV-Vis spectrum of the RuQT compound, probably [RuCl3(dppb)(QT)n], shows three bands observed
at wavelengths 320, 383 (broad) and 584 nm. The first band, at 320 nm, can be attributed to the transition from the dppb coordinated ligand to ruthenium(III); the band at 383 nm probably is a ligand to metal charge transfer (LMCT) transition from the dppb and from QT ligands to the Ru(III), and the band at 584 nm can be a LMCT from chloride to Ru(III).25
According to the powder XRD (Figure 3) the ruthenium precursor is coordinated with QT (Figure 3a). In order to show that the mer-[RuCl3(dppb)H2O] is bonded to QT
a powder X-ray diffractogram of the physical mixture (PM) of the Ru(III) complex with free QT was performed (Figure 3b). It can be seen that it is practically showing the diffractogram of the free species, which is not the case for the obtained blue solid (RuQT) diffractogram. In this
case, the RuQT does not show any peak of crystalline phase since its diffractogram is typical of an amorphous solid, presenting a different diffraction pattern from the one of the free QT (Figure 3c).
SEM provides the morphology and the energy dispersive X-ray spectrometry (EDX or EDS), where ruthenium, chlorine, phosphorus and nitrogen was detected, confirming with the other analyses the presence of ruthenium in the sample. AFM of blue solid was performed to check the average thickness of the film in the electrode surface. The irregular formation of film layers due to the process of film formation (dropped and dried) measuring 31.8 nm thick (Figure 4) was observed.
Figure 2. EPR spectrum of RuQT at 77 K in solid state.
Figure 3. Comparison of powder XRD of RuQT compound (a), a PM
containing Ru-precursor and free QT (b), free QT (c) and the precursor
mer-[RuCl3(dppb)H2O] (d).
According to AAS and SEM the obtained polymer-supported compound has 0.26% of ruthenium and 0.40% of chloride, which means that ruthenium species containing chloride as ligand are present in the polymer sample (blue solid).
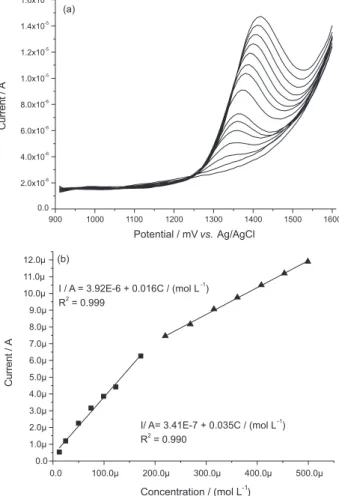
The modified GCE (RuQT) was used as an electrochemical sensor. The electrochemical analyses were performed in two different pH, 1.0 and 6.5, as described in the experimental section for the detection of acetaminophen and sildenafil citrate. However, for sildenafil citrate, only pH 1.0 was used because this analyte was not detected at pH 6.5. Figure 5 shows the detection of sildenafil citrate in several concentration values, from 1.25 × 10⁻⁵ to
4.99 × 10⁻⁴ mol L-1 (adding aliquots from 25 to 1050 µL of
a solution with 1.0 × 10⁻² mol L-1 concentration). Figure 5a
shows the DPV of the 15 analyses and Figure 5b shows the analytical curve that presented two different ranges of linearity (from 1.25 × 10⁻⁵ to 1.72 × 10⁻⁴ mol L-1, with
R-value 0.990, and 2.20 × 10⁻⁴ to 4.99 × 10⁻⁴ mol L-1, with
R-value 0.999). This electrode was used to perform all the analyses of both analytes and commercial drugs and its
response and stability remained the same in the first and in the last analyses without degrading the film.
Figure 6 shows the difference among responses of the modified electrode with RuQT compound, modified electrode with pure QT and unmodified GCE. These three analyses were performed with the same solution and only the modified electrode with the RuQT compound showed detection of the drug.
The oxidative mechanism of sildenafil citrate was reported by Ozkan et al.,26 suggesting that its oxidation
occurs in the piperazine ring:
C22H30N6O4SC6H5O7 [C22H30N6O4S]+C6H5O7 + e–
Thus, in this work the oxidation of sildenafil citrate was performed using compounds with structural similarity to different parts of the sildenafil citrate molecule and it was possible to confirm through DPV that it is indeed the piperazine ring that is oxidized during the oxidation process (Figure 7) of sildenafil citrate.
The proposed oxidation mechanism of sildenafil citrate is shown in Figure 8, below.
The same procedure used for the detection of sildenafil citrate was performed for the analysis of acetaminophen (paracetamol) detection. For these experiments the RuQT modified electrode was shown to be able to detect the drug in both analyzed electrolytes, H2SO4 (pH 1.0)
and CH3COOK (pH 6.5), keeping the stability without
degrading the electrode. Figure 9 shows the response of the acetaminophen detection in different concentrations, using DPV. Figure 10a shows the DPV of those 15 analyses and Figure 10b shows the analytical curve that presented two different ranges of linearity (from 1.25 × 10⁻⁵ to
1.72 × 10⁻⁴ mol L-1, with R-value 0.984 and 2.20 × 10⁻⁴ to
4.99 × 10⁻⁴ mol L-1, with R-value 0.987).
Figure 5. (a) DPV of sildenafil citrate - RuQT electrode oxidation - pH 1.0
(1.25 × 10⁻⁵ to 4.99 × 10⁻⁴ mol L-1); (b) analytical curves of sildenafil citrate in pH 1.0 where the first curve is 1.25 × 10⁻⁵ to 1.72 × 10⁻⁴ mol L-1 and the second curve is 2.20 × 10⁻⁴ to 4.99 × 10⁻⁴ mol L-1.
It is known that chitosan is soluble in acidic pH, due to the protonation of its amino groups. In order to check the stability of the electrode, cyclic voltammetry (CV) studies were performed. First, two blanks were run in
a 30 cycles experiment each; one in H2SO4 (pH 1.0)
electrolyte and the other in CH3COOK (pH 6.5) electrolyte
(Supplementary Information). The electrochemical response was considered satisfactory, in other words, there were no degradation or solubilization of the film in the electrode surface. This stability is probable due to the ruthenium complex coordinated to the chitosan. It is believed that the Ru-complex is cross-linking the chitosan, becoming insoluble.
Afterwards, CV (Supplementary Information) and DPV (Figures 9-12) were performed for the analyte addition using both electrolytes with the same electrode, in order to check the analytical response for these analytes’
detection. The stability remained the same in the first and in the last analyses without losing the linearity in the analytical response. As presented in the sildenafil citrate analyses, both Figures 11 and 12 show the comparison Figure 8. Proposed oxidative mechanism of sildenafil citrate.26
Figure 7. Electrochemical oxidation of three different compounds: norfloxacin; silfenatil citrate and citric acid, in 0.1 mol L-1 H
2SO4 electrolyte.
among a modified electrode with a film of RuQT, a modified electrode with a film of QT and the response in an unmodified GCE, at pH 1.0 and 6.5. As expected, the modified electrode with the RuQT compound showed an improvement of the analytical response.
It is early to propose a redox mechanism involving the ruthenium complex present in the chitosan film with these previous analyses. According to these results, it is possible to observe that the preconcentration of the analyte in the electrode surface is happening. It is believed that the Ru-complex contained in the film is interacting with the analyte, possibly by π-interactions between the aromatic
rings of the biphosphine ligand and the aromatic ring in acetaminophen and sildenafil citrate.
The mechanism of paracetamol oxidation is well
known in the literature27 and it is dependent on pH
values (Figure 13). In step I it undergoes electrochemical oxidation in a process that involves the loss of two electrons and two protons producing the intermediate
N-acetyl-p-quinoneimine. In pH ≥ 6.0, species II is stable in
deprotonated form and in acidic pH it is rapidly protonated, producing species III, which is less stable than II, but also electrochemically active. The hydrated species IV is generated rapidly and easily converted to benzoquinone.
The RuQT modified electrode was also used for detection of acetaminophen and sildenafil citrate in commercial drugs by DPV. Two different solutions containing acetaminophen Figure 10. (a) DPV of the acetaminophen - RuQT electrode oxidation
- pH 6.5 (1.25 × 10⁻⁵ to 4.99 × 10⁻⁴ mol L-1); (b) analytical curves of acetaminophen in pH 6.5 where the first curve is 1.25 × 10⁻⁵ to 1.72 × 10⁻⁴ mol L-1 and the second curve is 2.20 × 10⁻⁴ to 4.99 × 10⁻⁴ mol L-1.
Figure 11. Electrochemical comparison among RuQT, QT and GCE electrodes in acetaminophen analyses, in pH 1.0.
Figure 12. Electrochemical comparison among RuQT, QT and GCE electrodes in acetaminophen analyses, in pH 6.5.
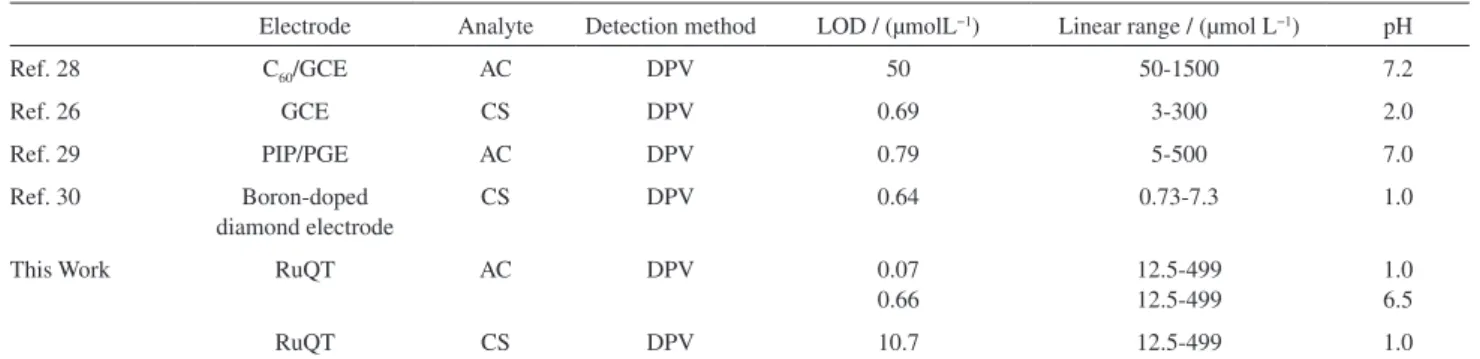
Table 2. Comparisons between literature data and this work
Electrode Analyte Detection method LOD / (µmolL−1) Linear range / (µmol L−1) pH
Ref. 28 C60/GCE AC DPV 50 50-1500 7.2
Ref. 26 GCE CS DPV 0.69 3-300 2.0
Ref. 29 PIP/PGE AC DPV 0.79 5-500 7.0
Ref. 30 Boron-doped diamond electrode
CS DPV 0.64 0.73-7.3 1.0
This Work RuQT AC DPV 0.07
0.66
12.5-499 12.5-499
1.0 6.5
RuQT CS DPV 10.7 12.5-499 1.0
AC: acetaminophen; CS: sildenafil citrate; DPV: differential pulse voltammetry; PIP: paracetamol imprinted polypyrrole; PGE: pencil graphite electrode; GCE: glassy carbon electrode.
Table 1. LOD and LOQ, in mol L-1, for both drugs in pH 1.0 and pH 6.5
Drugs pH LOD / (µmol L-1) LOQ / (µmol L-1) sildenafil citrate 1.0 10.7 35.6
6.5 – –
acetaminophen 1.0 0.07 0.23
6.5 0.66 2.20
(Tylenol®) and sildenafil citrate (Viagra®), as commercial drugs, were prepared in 2.0 × 10⁻⁴ mol L-1 concentration,
following the manufacturer mentioned concentration. The obtained values by calculation from the linear regression equation were: for acetaminophen in pH 1.0 the concentration found was 1.89 × 10⁻⁴ ± 0.20 × 10⁻⁴ mol L-1,
and in pH 6.5 it was found 1.85 × 10⁻⁴ ± 0.18 × 10⁻⁴ mol L-1.
The concentration found for sildenafil citrate in pH 1.0 was 1.96 × 10⁻⁴ ± 0.20 × 10⁻⁴ mol L-1. Therefore, the results
found for the samples showed that the modified electrode is efficient for the quantitative determination of both drugs. Table 1 shows the limit of detection (LOD) and limit of quantification (LOQ) found for both analytes, in both pH values and the obtained results were satisfactory in both cases.
All analyses were carried out during a month using the same electrode. The electrode was washed only with water in between the analyses of one analyte or another, keeping it in the refrigerator when it was not in use. This electrode was stable during the utilized period showing no degradation of the film, presenting a linear response over the evaluated concentration interval (1.25 × 10⁻⁵ to 4.99 × 10⁻⁴ mol L-1).
Comparing the RuQT electrode developed in this work with some works in the literature (Table 2), it was possible observe that, in the case of row 2,28 the electrode
developed in this work was more sensitive than the
C60/GCE, presenting a lower value of LOD. Comparing
the results shown in the final line (this work) with the
results in row 5,30 it is possible to observe that the RuQT
electrode has a wider range of potential with a slightly larger LOD than the LOD for the boron-doped diamond electrode. Comparing all cases, the RuQT electrode is easier to develop and work.
The DPV results obtained with the RuQT sensor were compared with the ones obtained by HPLC analyses. The determination of both compounds, acetaminophen and sildenafil citrate, in commercial drugs Tylenol® and
Viagra®, respectively, were performed by injection in
triplicate of an aqueous solution (1:100, v/v) previously prepared from commercial drugs. The concentration
found of acetaminophen in Tylenol® by HPLC method
was (2.00 ± 0.15) × 10-4 mol L-1 (30.23 µg mL-1) and
in Viagra® the concentration of sildenafil citrate found
was (2.01 ± 0.07) × 10-4 mol L-1 (95.37 µg mL-1)
(Figures 14 and 15). The HPLC method showed less than 15% accuracy and less than 5% precision. At 95% confidence level, there was no significant difference between the electrochemical method and the HPLC method.
Conclusions
We created a novel electrochemical sensor for sildenafil citrate and acetaminophen detection using a modified glassy carbon electrode with a film of RuQT compound. The film on the electrode was formed by dropping and drying a solution of RuQT compound in diluted acetic acid and characterized by powder XRD, SEM, AFM, EPR and AAS. The modified electrode was used as a sensor for drug detection and was shown to be stable during the utilized period having no degradation of the film and presenting a linear response over the evaluated concentration interval (1.25 × 10⁻⁵ to 4.99 × 10⁻⁴ mol L-1),
Supplementary Information
Supplementary data including cyclic voltammetry are available free of charge at http://jbcs.sbq.org.br as a PDF file.
Acknowledgments
The authors acknowledge Prof. Orlando Fatibello-Filho for the helpful discussion of chitosan; Prof. Daniel Rodrigues Cardoso and technician Thiago Abrahão Silva, of the Laboratory of Inorganic and Analytical Chemistry at
the Chemistry Institute of the University of São Paulo (São Carlos campus), for the EPR spectrum; the Leibniz Institute for Catalysis at the University of Rostock, in Germany, for the AAS data. The authors also acknowledge the financial support from CNPq, CAPES and CAPES (808/09 for X-ray facility) and Fapesp.
References
1. Pardey, A. J.; Longo, C.; Coord. Chem. Rev. 2010, 254, 254. 2. Baruwati, B.; Polshettiwar, V.; Varma, R. S.; Tetrahedron Lett.
2009, 50, 1215.
Figure 14. (a) Chromatograms of acetaminophen; (b) commercial drug
analysis; (c) calibration curve for acetaminophen.
Figure 15. (a) Chromatograms of sildenafil citrate; (b) commercial drug
3. Aydemir, M.; Baysal, A.; Meric, N.; Gümgüm, B.; J. Org. Chem.
2009, 694, 2488.
4. Zerecero-Silva, P.; Jimenez-Solar, I.; Crestani, M. G.; Arevalo, A.; Barrios-Francisco, R.; Garcı, J. J.; Appl. Catal., A
2009, 363, 230.
5. Bacac, M.; Hotze, A. C. G.; Van der Schilden, K.; Haasnoot, J. G.; Pacor, S.; Alessio, E.; Sava, G.; Reedijk, J.; J. Inorg. Biochem. 2004, 98, 402.
6. Gras, M.; Therrien, B.; Süss-Fink, G.; Stepnicka, P.; Renfrew, A. K.; Dyson, P. J.; J. Org. Chem. 2008, 693, 3419.
7. Kandioller, W.; Balsano, E.; Meier, S. M.; Jungwirth, U.; Göschl, S.; Roller, A.; Jakupec, M. A.; Berger, W.; Keppler, B. K.; Hartinger, C. G.; Chem. Commun. 2013, 49, 3348. 8. Dinelli, L. R.; Poelhsitz, G. V.; Castellano, E. E.; Ellena, J.;
Galembeck, S. E.; Batista, A. A.; Inorg. Chem. 2009, 48, 4692. 9. Rinaudo, M.; Eur. Polym. J.2010, 46, 1537.
10. Rinaudo, M.; Prog. Polym. Sci. 2006, 31, 603.
11. De Alvarenga, E. S.; De Oliveira, C. P.; Bellato, C. R.;
Carbohydr. Polym. 2010, 80, 1155.
12. Wei, D.; Ye, Y.; Jia, X.; Yuan, C.; Qian, W.; Carbohydr. Res.
2010, 345, 74.
13. Emara, A. A. A.; Tawab, M. A.; El-Ghamry, M. A.; Elsabee, M. Z.; Carbohydr. Polym. 2011, 83, 192.
14. Janegitz, B. C.; Lourenção, B. C.; Lupetti, K. O.; Fatibello-Filho, O.; Quim. Nova 2007, 30, 879.
15. Higazy, A.; Hashem, M.; El-Shafei, A.; Shaker, N.; Hady, M. A.;
Carbohydr. Polym. 2010, 79, 867.
16. Peirano, F.; Vincent, T.; Quignard, F.; Robitzer, M.; Guibal, E.;
J. Membr. Sci. 2009, 329, 30.
17. Mekahlia, S.; Bouzid, B.; Physics Procedia 2009, 2, 1045.
18. Leonhardt, S. E. S.; Stolle, A.; Ondruschka, B.; Cravotto, G.; De Leo, C.; Jandt, K. D.; Keller, T. F.; Appl. Catal., A 2010,
379, 30.
19. Gupta, K. C.; Sutar, A. K.; Chu-Chieh, L.; Coord. Chem. Rev.
2009, 253, 1926.
20. Zanini, V. P.; De Mishima, B. L.; Solís, V.; Sens. Actuators, B.
2011, 155, 75.
21. Cao, X.; Luo, L.; Ding, Y.; Zou, X.; Bian, R.; Sens. Actuators, B
2008, 129, 941.
22. Shahrokhian, S.; Ghalkhani, M.; Electrochim. Acta 2010, 55, 3621.
23. Pauliukaite, R.; Ghica, M. E.; Fatibello-Filho, O.; Brett, C. M. A.; Comb. Chem. High Throughput Screening 2010, 13,
590.
24. Pauliukaite, R.; Ghica, M. E.; Fatibello-Filho, O.; Brett, C. M. A.; Anal. Chem. 2009, 81, 5364.
25. Dinelli, L. R.; Batista, A. A.; Wohnrath, K.; De Araujo, M. P.; Queiroz, S. L.; Bonfadini, M. R.; Oliva, G.; Nascimento, O. R.; Cyr, P. W.; MacFarlane, K. S.; James, B. R.; Inorg. Chem. 1999,
38, 5341.
26. Ozkan, S. A.; Uslu, B.; Zuman, P.; Anal. Chim. Acta 2004, 501,
227.
27. Van Benschoten, J. J.; Lewis, J. Y.; Heineman, W. R.; Roston, D. A.; Kissinger, P. T.; J. Chem. Educ. 1983, 60, 772. 28. Goyal, R. N.; Singh, S. P.; Electrochim. Acta2006, 51, 3008.
29. Ozcan, L.; Ahin, Y. S.; Sens. Actuat. B: Chem. 2007, 127, 362. 30. Batista, E. F.; Sartori, E. R.; Medeiros, R. A.; Rocha-Filho,
R. C.; Fatibello-Filho, O.; Anal. Lett. 2010, 43, 1046.
Submitted: October 21, 2013
Published online: February 7, 2014