Article
Printed in Brazil - ©2012 Sociedade Brasileira de Química0103 - 5053 $6.00+0.00A
*e-mail: [email protected]
Characterization of Paracetamol Binding with Normal and Glycated Human Serum
Albumin Assayed by a New Electrochemical Method
Parandis Daneshegar,*,a,b Ali Akbar Moosavi-Movahedi,a,e Parviz Norouzi,b
Mohammad Reza Ganjali,b Mohammad Farhadic and Nader Sheibanid
aInstitute of Biochemistry & Biophysics, bCenter of Excellence in Electrochemistry,
Department of Chemistry and eCenter of Excellence in Biothermodynamic, University of Tehran, Tehran, Iran
cENT-HNS Research Center of Iran, University of Medical Sciences, Tehran, Iran
dDepartment of Ophthalmology and Visual Sciences and Pharmacology, University of Wisconsin, School of Medicine and Public Health, Madison, WI USA
No presente estudo, as interações entre paracetamol (PC) e albumina sérica humana, nas formas não glicada (HSA) e glicada (GHSA), foram investigadas por meio de voltametria cíclica contínua em tampão acetato, pH 7,4. Os resultados mostraram ausência de mudanças significativas no potencial formal E0 e na constante de velocidade de transferência de elétrons, no eletrodo,ks,
do PC. O decaimento na corrente do fármaco, após a adição de proteína, mostrou um decréscimo na concentração da droga livre e formação de um biocomplexo. Coulometria foi também usada para determinar os parâmetros de ligação. A constante de ligação e relação de ligação para HSA e GHSA foram 2,0×10⁴ and 7,8×10³ mol L-1, respectivamente, e o número de ligações foi 2:1
para HSA-PC e 1:1 para GHSA-PC. Estes resultados foram confirmados por espectroscopia UV-Vis. Assim, o novo método de análise eletroquímica descrito é fácil e rápido para avaliação das interações droga-proteína com implicação clínica significativa em diabetes.
In the present study the interactions between paracetamol (PC) and human serum albumin, in non-glycated (HSA) and glycated form (GHSA), were investigated using continuous cyclic voltammetry in acetate buffer pH 7.4. The results showed lack of significant changes in formal potential E0 and electrode reaction constant rate, ks, of PC. The decay in the drug current, after the
addition of protein, showed a decrease in free drug concentration and formation of a biocomplex. The contentious coulometry was also used to determine the binding parameters. The binding constant and binding ratio for HSA and GHSA were 2.0×10⁴ and 7.8×10³ mol L-1, respectively,
and the number of binding was 2:1 for HSA-PC and 1:1 for GHSA-PC. These results were confirmed by UV-Vis spectroscopy. Thus, the new electrochemical analysis method described here provides an easy and fast method for evaluation of drug-protein interactions with significant clinical implication in diabetes.
Keywords: continuous cyclic voltammetry, glycated human serum albumin, paracetamol,
binding study
Introduction
Paracetamol (PC) (N-acetyl-p-aminophenol) is a widely used minor analgesic drug. Although it has some cyclo-oxygenase inhibiting properties, this action is very weak in the peripheral tissues with minimal or no anti-inflammatory action. It is also known that PC overdose causes liver and kidney damage.1 Thus, accurate assessment
of PC levels may have clinical significance. Kissinger and co-workers2,3 investigated the electrochemical oxidation
of PC through cyclic voltammetric studies. The first reaction step is an electrochemical oxidation involving two electrons and two protons, which generates
for the quantification of PC in pharmaceutical products.4
Thus, the development of new methods of analysis, which are easy and fast, will be beneficial.
Human serum albumin (HSA) is the most abundant protein in plasma constituting 52% of the protein composition. As the major soluble protein constituent of circulatory system, HSA possess many physiological functions. This is attributed to its very unique single-polypeptide globular multidomain structure.5 HSA serves
as a transport carrier for a variety of small molecules present in the systematic circulation such as fatty acids, cations and many diverse drugs.6,7 Recently, the
three-dimensional structure of HSA was determined through X-ray crystallographic measurement.8 Crystal structure
analysis showed that most of the drug binding sites, I and II, are located in sub-domains IIA and IIIA, respectively. A large hydrophobic cavity is present in the IIA sub-domain of HSA. Warfarin, phenylbutazone and iodipamide are typical HSA site (sub-domain IIA) binding molecules.6
Non-enzymatic reaction of glucose with ε-amino group of lysine residues (the Maillard reaction) occurs naturally in the circulation, but elevated glycol-albumin is observed in diabetes mellitus. The major glycation sites (MGS) in HSA are reported as lys-525, lys-439, lys-281 and lys-199.9
Glycation of HSA and formation of advanced glycosylation end products alter its biological structure and function.10,11
The glycated form of albumin is found in healthy individuals at relatively low levels. However, in diabetic individuals its level increases significantly: approximately 30% of total HSA. Thus, a diabetic individual may require a different dose of the drug used to treat a non-diabetic individual, due to disorders in protein-drug interactions. Therefore, understanding the differences in interactions of various drugs with HSA under diabetic conditions may have significant clinical implications.
Here, a voltammetric, UV-Vis spectroscopy for HSA interactions with PC was developed. PC has a redox reaction on the glassy carbon working electrode (GCE). Electrochemical studies on the interaction of PC with HSA at the GCE were carried out according to the changes of electrochemical responses of the reaction solution. The electrochemical parameters of the PC−HSA and PC−GHSA reaction systems were calculated. The conditions for the interactions and the electrochemical determination were then optimized. Furthermore, the UV spectra of PC were recorded, and drug-protein interactions were investigated by addition of HSA or GHSA. These results further confirmed the electrochemical findings. The binding mode and the exact location of binding sites, as well as other details such as binding residues and interaction forces, were investigated by docking as previously reported.12
The differences in binding of HSA and GHSA with PC point to the importance of providing different drug doses for diabetics compared to non-diabetics. To the best of our knowledge, this work is the first to recognize the importance of drug-protein interactions under diabetic and non-diabetic conditions, using a new, easy and fast electrochemical method.
Results and Discussion
Electrochemical behavior of PC
PC is an electrochemically active drug with a hydroxyl group in its molecular structure, which can be oxidized at the glassy carbon electrode. The cyclic voltammograms of 1.0 × 10⁻³ mol L-1 of PC at different scan rates in acetate
buffer pH 7.4 are shown inFigure 1. The drug showed a reduction peak at −0.023 V (vs. SCE) and an oxidation peak at 0.568 V in sweep rate of 0.1V s-1, which indicated that
the electrochemical behavior of PC on the glassy carbon electrode was quasi reversible. The peak current increased with increasing scan rate, and the relationship between oxidative peak current and the scan rate in the range of ca.
0.02-0.7 Vs-1 is plotted in Figure 1.
Multi-scan cyclic voltammetry studies showed that with increasing scan number, the oxidation peak current was decreased, which presents the adsorption behavior of PC on the GCE. The relationship between the oxidation peak potential and pH of the buffer solution was then investigated. With increasing pH of acidic solution the peak potential moved negatively. A linear relationship was obtained in the pH range of 3.0 to 9.0 with the equation: Ep(mV) = −44.5 pH + 837.63 (n = 4, γ = 0.991), which
Figure 1. Cyclic voltammograms of paracetamol at different sweep rates,
is close for equal electron and proton transfer, and also 2e−/2H+ reactions.14 Thus, the redox mechanism of PC is 2
electrons and 2 protons as suggested for a quinone group.
Comparison of electrochemical parameters of PC in the absence and presence of HSA or GHSA
In order to investigate the reaction mechanisms of PC with HSA or GHSA reaction solution, the variation of electrochemical parameters of PC in the absence or presence of proteins was calculated and compared.Figure 2 shows the cyclic voltammograms of PC in the absence (a) and presence of HSA (b) or GHSA(c). When proteins were added to PC solution the anodic peak current of PC decreased (depending on the interaction power of each protein, Ka). In addition, a very small peak potential shift
was observed without any new reduction peak in the same potential scan. The decrease in current is an evidence of decrease in free PC concentration, and indicates the formation of a biocomplex.
Because of the adsorption behavior and the irreversible electrode process of the reduction reaction of PC on the GCE the following Laviron’s equation15 could be used to
calculate the electrochemical parameters of the reduction reaction of PC on GCE,
Ep = E0 – RT/(1 – α)nF[ln RTks/(1 – α)nF] +
RT/(1 – α)nFlnν] (1)
where α is the electron transfer coefficient, ks is the standard
rate constant of the surface reaction, ν is the scan rate and
Ep is the formal potential. According to equation 1, if the E0 is known, Ep is linearly related to ln ν and, the αn and
ks values can be calculated from its slope and the intercept, respectively. The E0 value can be deduced from the intercept
of Epvs.ν plot on the ordinate by extrapolating the line to ν = 0 (about 0.570 V). According to this method, the electrochemical parameters were calculated for PC-protein reaction systems. Li and co-workers16-18 studied the
interactions of many electroactive small molecules and showed that in low concentrations of protein, and shorter accumulation time, the coverage of electrode surface only accounts for less than 10% of the total electrode area. Thus, the competitive absorption between small molecules and proteins can hardly exist. Since the electrochemical parameters of this reaction system did not change significantly, the PC interaction with the proteins formed an electroinactive supramolecular complex and could not be reduced on the GCE surface and the obtained result confirmed that.
Optimization of reaction conditions
The pH of buffer solution can greatly influence the binding reaction. We next tested the optimal reaction pH in the pH range of 3.0-9.0 (data not shown). At pH 5.0, the difference in PC peak current in the presence of proteins reached its maximum. Thus, the drug-protein interactions were strongest at this pH. We next investigated the interactions of drug with proteins under physiological conditions, pH 7.4. At this pH the current was high enough for these determinations and was used throughout these experiments. Different buffers such as Briton-Robinson, HOAc-NaOAc, and NaHPO4-Na2HPO4 were also tested, but maximum response was observed in the acetate solution. Thus, the pH 7.4 acetate buffer solution is recommended in this paper. After addition of proteins to PC solutions the difference of peak currents reached maximum after 5 min and remained unchanged for at least 2 h. Therefore, the system allows enough time for routine measurements.
Continuous cyclic voltammogram of HSA or GHSA and PC; stoichiometry and binding constant of HSA or GHSA and PC
Figures 3a,b and 4a,b show the charge decays using continuous cyclic voltammetry and the linear graph of concentration vs. current in PC solutions in the absence and presence of HSA (Figure 3a) or GHSA (Figure 4a) at pH 7.4. In the absence of protein, the oxidative peak area (change in charge of anodic peak of PC) did not change during the reaction time, and a straight line appeared. After
Figure 2. Cyclic voltammograms of paracetamol−HSA or GHSA binding
addition of proteins to the PC solutions, the concentration of PC was decreased. This was concomitant with a great decrease in the charge. However, after the equilibrium time the straight line was also obtained because of the completion of interactions. Thus, the concentration of drug was reduced in the solution and an inactive complex was formed by interactions between the drug and proteins. The reduction of drug concentration in solution depends on the strength of protein interactions. At the first view, it appeared that the interaction of GHSA with PC was less strong than HSA with PC, because the differences of current content before and after addition of GHSA were smaller compared to HSA. The effects of the reaction temperature on these interactions were also tested at 25, 30 and 37 oC.
The results showed no significant differences at different temperatures. Thus, the impact of temperature change on the binding reactions was minimal and, 25 oC was used
throughout the study.
In order to investigate the interaction mechanisms of PC with proteins, the variation of electrochemical parameters of PC in the absence and presence of proteins were calculated and compared. According to a method proposed by Sun et al.,19 the composition and formation constant for
PC-protein complex can be calculated based on the changes of charge (oxidation peak area). It was assumed that PC and HSA or GHSA formed the single complex (HSA− or GHSA−m(paracetamol)):
HSA/GHSA + m(paracetamol) →
HSA/GHSA–(paracetamol)m (2)
The equilibrium constant is deduced as follows:
β = [HSA/GHSA–m(paracetamol)]/ [paracetamol]m[HSA/GHSA]
Because
CHSA/GHSA = [HSA/GHSA] + [HSA/GHSA–(paracetamol)m]
According to the Ilkovic equation of irreversible electrode process:
∆Qmax = KCHSA/GHSA
∆Q = K[HAS/GHSA– (paracetamol)m]; therefore: ∆Qmax −∆Q = K[HSA/GHSA]
∆Qmax − ∆Q = k(CHSA/GHSA−[HSA/GHSA− (paracetamol)m]) = k[HAS/GHSA]
Introducing equations
1/∆Q = 1/ ∆Qmax + (1/βs∆Qmax)(1/[paracetamol]m)
or
log [∆Q / ([∆Qmax−∆Q)] = log βs + m log [paracetamol] (3)
where ∆Q is the differences of peak current in the presence and absence of HSA or GHSA, ∆Qmax corresponded to the obtained values when the concentration of PC was extremely higher than that of HSA or GHSA. CHSA/GHSA, [HSA/GHSA], [HSA/GHSA−(paracetamol)m] correspond
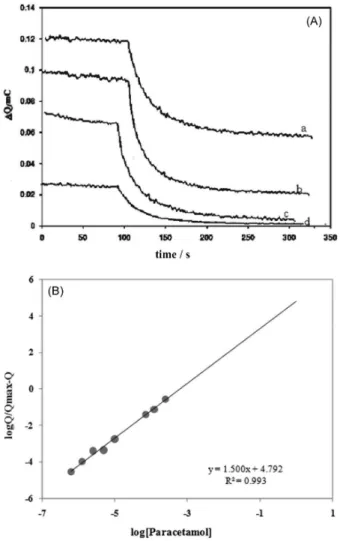
to the total, free and bound concentration of proteins in the solution, respectively. From the equations the relation of log [∆Q/( ∆Qmax −∆Q)] versus log[Paracetamol] was calculated and plotted as a line with the linear regression equation as log [∆Q/( ∆Qmax − ∆Q)] = 5.726 + 1.48 log[Paracetamol] for HSA (Figure 3b) and 3.914 + 0.93 log[Paracetamol] for GHSA (Figure 4b). From the intercept and the slope of Figure 3b and 4b, m ca. 2 and β = 2.0 × 10⁴ mol L-1 were deduced for HSA and m ca. 1,
Figure 3. (A) The continuous cyclic voltammetry of paracetamol
β = 7.8 × 10³ for GHSA. The binding constant was close
to the value obtained by absorption spectrophotometry.
UV-Vis absorption spectra
Figure 5a shows the UV-Vis absorption spectra of PC in the absence and presence of HSA.
In pH 7.4 acetate buffer solution and in the scan range of 200 ca. 400 nm PC had a maximum absorption peak at ca. 310 nm (curve a). When HSA was mixed with PC, the absorbance of PC decreased with a slight change in maximum absorption wavelength (curves b-e).
A similar phenomenon to HSA was observed after addition of GHSA to PC solution under the same conditions. Thus, the equation used for HSA could be used for GHSA (the results of GHSA are not shown). The more protein was added the greater the absorbance decrease, which indicates that a binding reaction between PC and
HSA or GHSA had occurred and a new complex was formed under the selected experimental conditions. These results were in close accordance with what was previously reported by others.20 Based on the decreased absorbance
value at 243 nm, the binding constant, Kf, of PC−HSA
or −GHSA complex could be obtained according to the following equation21,22
A0/(A−A0) = εG/(εH−G−εG) + εG/(εH−G−εG)(Kf[HSA]) (3)
where A0 and A are the absorbance values of the free guest
and the apparent one, εG and εH−G are the absorption coefficients of the guest and complex, respectively. By changing the concentration of HSA or GHSA in PC solution, the absorbance values were obtained and the relationship of A0/(A−A0) with 1/[HSA/GHSA] was plotted (Figure 5b for HSA). The linear regression equation was A0/(A−A0) = −9.0 × 10⁻⁵/[HSA] −2.92 (n = 5, γ = 0.995)
Figure 4. (A) The continuous cyclic voltammetry of paracetamol by
addition of 50 µL of GHSA to 5 mL of: a) 2.0 ×10⁻⁵ ; b) 8.0 ×10⁻⁶ ; c) 4.0 ×10⁻⁶ and d) 2.0 ×10⁻⁶ mol L-1 of paracetamol at 0.05 mol L-1 acetate buffer pH 7.4. (B) The relationship between log[∆I/(∆Imax−∆I)] and log[paracetamol] for addition of GHSA in Figure 5A.
Figure 5. (A) The UV-Vis spectra of paracetamol−HSA reaction;
and A0/(A−A0) = −3 ×10⁻⁴/[GHSA] −1.96 (n = 5, γ = 0.994).
The ratio of the intercept to the slope gives the values of the binding constants, Kf : 2.7 × 10⁴ L mol-1 for HSA and
6.6 ×10³ L mol-1 for GHSA, which are in accordance with
the electrochemical results.
Conclusions
This paper describes a new, fast and easy method as an electrochemical probe for determination of differences in interactions of HSA, in non-glycated and glycated form, with PC, which forms an electroinactive biocomplex. The glycation of HSA was performed in vitro and was further confirmed by changes in the number of free lysine residues, from 58 to 51. The decays in drug current after the addition of proteins showed the electroinactive biocomplex formation consistent with no new peak in the drug voltammogram. Using different protein concentrations allowed us to calculate the binding numbers and constants. In the electrochemical experiments, the presence of HSA caused a decrease in oxidation peak current of PC and formation of a new electrochemically inactive complex through hydrophobic interactions of PC with HSA or GHSA. These results showed that GHSA binding was less strong than non-glycated HSA, perhaps due to its modification by glucose and changes in the native structure. This was further supported by changes observed in the binding numbers, from 2 to 1 for non-glycated to 1 to 1 for glycated-HSA. In addition, the binding constant for HSA−PC was bigger than GHSA−PC. Thus, based on these in vitro experiments, in a diabetic person the free drug concentration (in blood not in conjugation with protein) will be higher than a non-diabetics person. Therefore, our results suggest that a diabetic individual may require a different dose of drug compared to a non-diabetic individual, and begins to address an important clinical concern which deserves further investigation.
Experimental
Electrochemical measurements
The cyclic voltammetry experiments were carried out using an Autolab potentiostat PGSTAT 30 (Eco Chemie B.V., Netherlands), equipped with the GPES 4.9 software with a glassy carbon electrode with a 2 mm diameter (Azar Electrode, Uromieh, Iran) as the working electrode. Continuous cyclic voltammetry was done using a setup comprised of a PC PIV Pentium 900 MHz microcomputer, equipped with a data acquisition board (PCL-818HG, Advantech. Co.), and a custom made potentiostat. All data
acquisition and data processing programs were developed in Delphi 6® program environment. A platinum wire was
applied as the counter electrode and Ag|AgCl|KCl (sat.) was applied as the reference electrode. All potentials were reported with respect to this reference. All experiments were carried out at 25 ± 1 oC.
Adsorption spectra
The absorption spectra were obtained in a 100 Bio UV-Vis spectrometer (Varian Co., Australia) spectrometer from 200 to 500 nm. The spectrograms were recorded in 0.05 mol L-1 acetate buffer pH 7.4, and HSA and GHSA
at 1.5 ×10⁻⁶ mol L-1 and PC at 1.0× 10⁻⁴-1.0× 10⁻⁶ mol L-1.
Reagents
Human serum albumin (HSA), 99% purity (A-1653; Sigma) and used without further purification. PC with 99% purity was a gift from Drug and Food Quality Control (Tehran, Iran). The 1.0 mg mL-1 stock solution of
protein was prepared by directly dissolving it in double distilled water from an all-quartz still and stored at 4 oC.
For working solutions, HSA was diluted in 0.05 mol L-1
acetate buffer, pH 7.4. GHSA was prepared as described below. A stock solution of PC (1 × 10⁻⁴ mol L-1) was
prepared by dissolving appropriate amount of PC in double distilled water, and the working solutions were prepared by diluting in appropriate buffer. All other reagents were of analytical grade and double distilled water was used throughout the experiments.
Preparation of GHSA
Human serum albumin (40 mg mL-1) was incubated
in 50 mmol L-1 glucose prepared in 50 mmol L-1 sodium
phosphate buffer containing 3 mmol L-1 sodium azide,
pH 7.4 at 37 oC for 28 days. The glycated albumin was
dialyzed exhaustively against phosphate buffer pH 7.4 at 4 oC, and stored at −20 oC.
Determination of glucose-bonded lysine residues
TNBSA (trinitrobenzene sulfonic acid) was used for determination of Lys residue numbers in HSA and GHSA. NaHCO3 (4%), pH = 8.4 and TNBSA(0.1%) was added to a
1 mg mL-1 protein solution (normal and glycated form) and
incubated for 1 h at 37 oC. Following incubation, protein
samples were solubilized by adding SDS (0.1%) and chloridric acid (1 mol L-1), and the absorbance of samples
Electrochemical procedure
For the electrochemical experiments, the 3 electrodes system was set up with a cell containing 5 mL of PC at different concentrations prepared in 0.05 mol L-1 acetate
buffer pH 7.4. The potential program was applied to the electrode continuously. The straight line indicates the integration of the anodic peak (charge value of oxidation), the adequate amount of protein is added to the solution (the potential is applying continuously), and the observed decay in charge is a sign of reduction of concentration of free drug in solution. The time window of every run was set to obtain a straight line after addition of protein, which indicates the completion of complexation.
Acknowledgments
The authors express their appreciation to the Research Council of the University of Tehran and Iran National Science Foundation (INSF) for the financial support of this work. N. S. is a recipient of Research Award from American Diabetes Association (1-10-BS-160).
References
1. Clayton, B. D.; Stock, Y. N.; Basic Pharmacology for Nurses; Mosby Inc., Harcourt Health Sciences Company: St. Louis, 2001, pp. 201-210.
2. Kissinger, P. T.; Roston, D. A.; Van Benschoten, J. J.; Lewis, J. Y.; Heineman, W. R.; J. Chem. Educ.1983, 60, 772.
3. Miner, D. J.; Rice, J. R.; Riggin, R. M.; Kissinger, P. T.; Anal. Chem.1981, 53, 2258.
4. The United States Pharmacopoeia; The National Formulary-USP 23; NF-18, Twinbrook Parkway, Rockville, 1995, pp. 16-21.
5. Petitpas, I.; Bhattacharya, A. A.; Twine, S.; East, M.; Curry, S.;
J. Biol. Chem.2001,276, 22804.
6. Carter, D. C.; Ho, J. X.; Adv. Protein Chem.1994,45, 153. 7. Zaton, A. M. L.; Villamor, J. P.; Chemico-Biol. Interact.2000,
124, 1.
8. He, X. M.; Carter, D. C.; Nature1992,358, 209.
9. Mendez, D. L.; Jensen, R. A.; McElroy, L. A.; Pena, J. M.; Esquerra, R. M.; Arch. Biochem. Biophys.2005,444, 92. 10. Carter, D. C.; He, X. M.; Munson, S. H.; Twigg, P. D.; Gernert,
K. M.; Broom, M. B.; Miller, T. Y.; Science 1989,244, 1195. 11. Dugiaczyk, A.; Law, S. W.; Dennison, O. E.; Proc. Natl. Acad.
Sci. U. S. A. USA1982,79, 71.
12. Daneshgar, P.; Moosavi-Movahedi, A. A.; Norouzi, P.; Ganjali, M.R.; Madadkar-Sobhani, A.; Saboury, A. A.; Int. J. Biol. Macromol.2009,45, 129.
13. Sattarahmady, N.; Moosavi-Movahedi, A. A.; Habibi-Rezaei, M.; Ahmadian, S.; Saboury, A. A.; Heli, H.; Sheibani, N.;
Carbohydrate2008,343, 2229.
14. Bard, A. J.; Faulkner, L. R.; Electrochemical Methods, Fundamentals and Applications, 2nd ed.; John Wiley & Sons: New York, 2000.
15. Laviron, E.; J. Electroanal.Chem.1979, 101, 19.
16. Zhang, H. M.; Zhu, Z. W.; Li, N. Q.; Fresen. J. Anal. Chem.
1999,363, 408.
17. Zhu, Z.; Li, N.Q.; Mikrochim. Acta1999,130, 301.
18. Zeng, Y. N.; Liu, J. Y.; Li Y. Z.; Electrochem.Commun. 2002,
4, 679.
19. Sun, W.; Han, J.; Jiao, K.; Lu, L.; Bioelectrochemistry 2006,
68, 60.
20. Sun, W.; Jiao, K.; Han, J. Y.; Xu, G. Y.; J. Chin. Chem. Soc.
2006,53, 1141.
21. Ibrahim, M. S.; Anal. Chim. Acta2001,443, 63.
22. Ibrahim, M. S.; Shehatta, I. S.; Al-Nayeli, A. A.; J. Pharm. Biomed. Anal.2002, 28, 217.