BRAZILIAN JOURNAL OF OCEANOGRAPHY, 59(1):27-42, 2011
BENTHIC MACROFAUNA STRUCTURE IN THE NORTHEAST AREA OF
TODOS OS SANTOS BAY, BAHIA STATE, BRAZIL: PATTERNS OF
SPATIAL AND SEASONAL DISTRIBUTION
Ana Maria S. Pires-Vanin1*, Pablo Muniz2 and Fabio Cabrera De Léo1,3
1Instituto Oceanográfico da Universidade de São Paulo - Laboratório de Ecologia Bêntica
(Praça do Oceanográfico 191, 05508-120 São Paulo, SP, Brasil)
2Sección Oceanología, Facultad de Ciencias
(Iguá 4225, 11400 Montevideo, Uruguay)
3University of Hawaii at Manoa - Department of Oceanography
(1000 Pope Road, Honolulu, HI 96822, USA) *Corresponding author: [email protected]
A
B S T R A C TStructure of intertidal and subtidal benthic macrofauna in the northeastern region of Todos os Santos Bay (TSB), northeast Brazil, was investigated during a period of two years. Relationships with environmental parameters were studied through uni- and multivariate statistical analyses, and the main distributional patterns shown to be especially related to sediment type and content of organic fractions (Carbon, Nitrogen, Phosphorus), on both temporal and spatial scales. Polychaete annelids accounted for more than 70% of the total fauna and showed low densities, species richness and diversity, except for the area situated on the reef banks. These banks constitute a peculiar environment in relation to the rest of the region by having coarse sediments poor in organic matter and rich in biodetritic carbonates besides an abundant and diverse fauna. The intertidal region and the shallower area nearer to the oil refinery RLAM, with sediments composed mainly of fine sand, seem to constitute an unstable system with few highly dominant species, such as Armandia polyophthalma and Laeonereis acuta. In the other regions of TSB, where muddy bottoms predominated,
densities and diversity were low, especially in the stations near the refinery. Here the lowest values of the biological indicators occurred together with the highest organic compound content. In addition, the nearest sites (stations 4 and 7) were sometimes azoic. The adjacent Caboto, considered as a control area at first, presented low density but intermediate values of species diversity, which indicates a less disturbed environment in relation to the pelitic infralittoral in front of the refinery. The results of the ordination analyses evidenced five homogeneous groups of stations (intertidal; reef banks; pelitic infralittoral; mixed sediments; Caboto) with different specific patterns, a fact which seems to be mainly related to granulometry and chemical sediment characteristics.
R
E S U M OA estrutura da macrofauna bêntica das regiões entre marés e infralitoral raso na porção nordeste da Baia de Todos os Santos (BTS), nordeste do Brasil, foi investigada durante um período de dois anos. Sua relação com os parâmetros ambientais mensurados foi estudada através de análises estatísticas uni - e multivariadas, sendo os principais padrões de distribuição espacial e temporal relacionados principalmente ao tipo de sedimento e ao conteúdo de três indicadores da matéria orgânica sedimentar (Carbono, Nitrogênio e Fósforo). A macrofauna, composta majoritariamente por anelídeos poliqueta (cerca de 70% do total), apresentou baixa densidade, riqueza de espécies e diversidade, exceto nas estações amostradas nos bancos recifais. Estes se destacam como ambiente peculiar, formado por sedimentos grosseiros, pobres em matéria orgânica e ricos em carbonatos, apresentando fauna abundante e diversificada. A região entre marés e os locais rasos adjacentes à refinaria RLAM são formados por sedimentos compostos principalmente por areia fina e baixo conteúdo orgânico e constituem ambiente instável, com poucas espécies altamente dominantes, como Armandia polyophthalma e Laeonereis acuta. Em outras regiões da BTS, onde dominam os sedimentos pelíticos, densidade e diversidade foram muito baixas, especialmente nas proximidades da refinaria. Aqui, os indicadores biológicos apresentaram seus mais baixos valores, sendo as estações mais próximas (4 e 7) algumas vezes azóicas. A região adjacente de Caboto, inicialmente considerada como controle, apresentou baixa densidade, porém valores médios para diversidade, o que indica ser este ambiente relativamente menos perturbado. Foi possível identificar a existência de 5 grupos com padrões estruturais próprios (entremarés; bancos recifais; infralittoral pelitico; sedimentos mistos; Caboto), que parecem estar relacionados principalmente às características físicas e químicas do sedimento.
Descriptors: Benthic ecosystem, Community structure, Macrofauna, Intertidal, Infralitoral, Todos os Santos Bay, Western Atlantic.
I
NTRODUCTIONThe availability of monitoring
methodologies capable of indicating an ecosystem´s ecological “status” and the consequences of natural factors as well as those related to anthropogenic activity, are essential for the development of the adequate management of natural resources. This is the only way to implement practicable conservation strategies. Methods for ecosystem monitoring may be divided into physical, chemical (including biochemical and molecular) and biological. Biological monitoring uses organisms to evaluate or indicate the degree of ecological degradation of the environment or the ecosystem´s environmental health using a minimum of field equipment. Once established and standardized, bio-monitoring tends to be efficient and economical, serving as a good method of prevention or surveillance (DAUER, 1993; BUSTOS-BAEZ; FRID, 2003). Coastal benthic habitats especially are among the most productive of the marine environment and also the most affected by the anthropogenic activities resulting from industrial development. Several studies have shown the importance of benthic macrofaunal communities for the description of impacted areas (PEARSON; ROSENBERG, 1978; MIRZA; GRAY, 1981; ZENETOS; BOGDANOS, 1987; MUNIZ; PIRES-VANIN, 2005), while several other authors have collaborated in the identification of these organisms as environmental quality indicators (AMARAL et al., 1998; MÉNDEZ et al., 1998; MUNIZ; PIRES, 1999). One of the main problems with environmental quality assessments is the natural variability of the biota. This variability, whether a result of environmental pressure or inherent to the organisms´ biology, can very often be mistaken for the effect of stressful factors resulting from human activity (ELLIOTT; QUINTINO, 2007). As a consequence, those studies demand a correct sampling design, generally well replicated in time and space and, whenever possible, with a parallel study involving multiple control sites.
So far, few works have been carried out on the benthic communities of unconsolidated bottoms of Todos os Santos Bay (TSB), in spite of its geographic extension and the presence of an oil refinery. The
studies of Souza et al. (1978) and Silva et al. (1981),
reporting the presence of heavy metals in the sediments and in bivalves of some regions of the TSB, stand out. Tavarez et al. (1988) and Porte et al. (1990)
used the bivalve Anomalocardia brasiliana to monitor
hydrocarbons, PCBs and DDTs at several points of the TSB intertidal zone. More recently, Peso-Aguiar et al. (2000) studied the effect of petroleum on the benthic communities of that same region, concluding that the activities of oil refining carried out in the region were the main sources of stress to the intertidal aquatic
fauna. Barroso et al. (2002), who studied the trophic structure of polychaetes, and more recently Venturini and Tommasi (2004), that investigated the distribution of macrofauna on unconsolidated bottoms of the northeastern portion of TSB, reached the same conclusion. They argued that besides the sedimentary and oceanographic structure the anthropogenic impact exerted an important influence on the benthic macrofaunal distribution.
Analyses of aquatic bottom sediments reflect water column dynamics and the input of continental matter and may tell about the degree of the benthic-pelagic coupling. The intrinsic relationship between grain size and sedimentary organic matter content is well known, as is their relation with organic and inorganic contaminants. So, the geochemical composition of sediments may reflect the processes occurring in the area and contribute to a better system for the evaluation of monitoring procedures. Among the organic matter´s main constituents carbon, nitrogen and phosphorus are frequently analyzed for addressing eutrophication processes, but can also indicate the origin of the organic matter, whether continental or marine. Variations in elemental C:N:P ratios with depth are interpreted as resulting predominantly from changing proportions of terrestrially derived vs. marine-derived organic matter (RUTTENBERG; GOÑI, 1997).
The present work aims to characterize, both qualitatively and quantitatively, the macrobenthic community of the subtidal and intertidal zones in the TSB area under influence of the Landulpho Alves Refinery-Mataripe (RLAM); monitor the spatial and temporal (seasonal scale) variations in distribution and structure during two consecutive years and compare them with those of the adjacent area of Caboto embayment. It also seeks to discover patterns in the ecological structure of the macrofaunal assemblages, relating them to granulometry and sediment chemical variables (total organic Carbon, total Nitrogen and Phosphorus). The present study is part of the “Program of estuarine ecosystem environmental monitoring in the Landulpho Alves-Mataripe Refinery area” (PROMARLAM) undertaken under the auspices of the IOUSP/PETROBRAS-CENPES partnership.
M
ATERIAL ANDM
ETHODSThe present study was carried out in the northeastern section of Todos os Santos Bay, central
coast of Bahia State, situated from 12o43’ to 12o45’S
and 38o32’ to 38o36’W (Fig. 1), at 35 sampling
stations over two years. Six stations (identified as B stations) were placed in the intertidal zone, an area under direct RLAM influence, 3 of them on the intertidal sand banks closest to the plant and mouth of Mataripe River, and 3 others – the control banks (Bc),
in the western part of the area. Twenty stations were placed in the subtidal zone, at depths between 1.5 and 9.0 m, on the shelf around the plant and in the second year 5 extra points were added to the eastern transect at increasing depths (9.0 to 17.5 m) in order to investigate the effect of the increase in distance from the source of contamination. Further, 4 other stations were placed in the adjacent Caboto region, chosen as a control area for the subtidal stations due to their environmental similarity and to their greater distance from the refinery (Fig. 1).
Benthic organisms were collected on board
two boats hired in the area, the schooner Dona Laura
and the boat Ract Mar, the latter being capable of
collecting at the shallower stations and at low tide. A
van Veen grab of 0.05 m2 of sampling area was used to
collect triplicate samples at each station. PVC 15-cm diameter cylinders, introduced down to a depth of 20 cm, were used in the intertidal zone. The samples were washed in the field over a 0.5 mm-mesh sieve. The material retained on the sieve was fixed with 4% buffered formaldehyde. At the laboratory, after being transferred to a 70% ethanol solution, they were sorted under a stereo microscope, for counting and identification of groups to the smallest possible taxonomical level.
The methodology used to obtain
granulometric fractions followed the standard dry-sieve and pipette method (SUGUIO, 1973) and the parameter calculations of Folk and Ward (1957). The quantity of carbonates was measured by acid dissolution (GROSS, 1971). The methods for Total Organic Carbon (C), Total Nitrogen (N) and Organic Phosphorus (P) quantification are described, respectively, in Gross (1971), Grasshoff et al. (1983) and Aspila (1976).
An ordination technique (“non-metric multi-dimensional scaling”, NMDS) (KRUSKAL; WISH, 1978) was applied to group stations in terms of species. Data were log (x+1) transformed and the dBray-Curtis similarity coefficient was calculated. Since the biological pattern observed basically corresponded well with the sedimentological pattern, the study area was divided into 4 station groups derived from the ordination analysis obtained for the granulometric data, plus a fifth group, of the Caboto stations. After identifying and checking station groups in terms of species, a similarity percentage analysis (SIMPER) (CLARKE; WARWICK, 1994) was used to identify which species contributed to the formation of each group.
Fig. 1. Study area showing the oceanographic stations where the benthic macrofauna was collected. 1-25; B1, 2, 3: sand banks; BC1, 2, 3 (control banks); C1, 2, 3, 4: Caboto. Stations 21-25 were sampled only in the second year of the study.
The abundance and number of species were used to estimate the following community descriptors:
species richness (S; species number/0.05 m2); density
(N; number of individuals/0.05 m2); Pielou evenness
(J´); Shannon-Wiener diversity index (H´loge); relative
abundance, and crustacean-polychaete ratio
(Crus/Poly) (STARK, 1998).
The differences between the stations and groups obtained according to common granulometric characteristics, and in relation to the descriptors mentioned above, were evaluated by analysis of
variance (ZAR, 1999) with α = 0.05.
To identify which environmental variables were most closely related to the faunal distribution patterns, the BIO-ENV (BIOtic-ENVironment) (CLARKE; AINSWORTH, 1993) analysis was performed using weighted Spearman’s correlation test.
Brief Characterization of the Environment
Todos os Santos Bay has an area of about
1233 km2, being the second largest bay in Brazil. The
area is an example of urban-industrial occupation since it is populated by nearly 3 million people, houses 10 port terminals, the industrial center of Aratu and the petrochemical complex of Camaçari (HATJE; ANDRADE, 2009). The Landulpho Alves oil refinery is located in the northeastern area of the TSB, in the Mataripe area (RLAM), and the resultant effluents are discharged into the bay. Petroleum extraction, transportation and refining activities have been carried out in this area since 1950. An extensive mangrove swamp/forest borders the coast which it shares with estuaries, sand flats and with coral reef extensions to the northeast.
The estuarine system presents a semidiurnal tidal regime, with a lunar component estimated at 91 cm, decreasing in intensity towards the bottom. The currents at the surface are constrained by tides and flow from N to S most of the time, with maximum intensities of 0.22 m/s in winter (rainy season) and 0.73 m/s in summer (dry season). Near the bottom the maximum value in the winter reached 0.17 m/s. The water column presented a weak stratification during both periods of sampling, with maximum values of temperature and salinity ranging from 25 to 26.5oC
and 31 to 33 in July/August (rainy season) and 28.7 to 30.6oC and 35.9 to 36.2 in December (dry season)
(SILVEIRA; MIRANDA, 2005; LESSA et al., 2009). The infralittoral region is shallow, with depths not exceeding 14 m. In the RLAM area sand predominates along the coast whereas muddy sites are more frequent in the centre of the area. In the central-west part lie sandy sediments originating mainly from the erosion of carbonated reefs and in the east, in the Caboto Bay, siltic sediments predominate, except at station Cab 1, which presents a sandy bottom
(FURTADO, 2005). The fine sediment areas deserve attention since they are places that favor the retention of chemical elements.
R
ESULTSA total of 11,442 individuals were collected. They corresponded to 8 phyla: Nemertinea, Annelida (predominance of Polychaeta), Sipuncula, Echiura, Arthropoda (predominance of Crustacea), Mollusca, Echinodermata and Chordata. Of this total, 5,886 individuals were recorded in the first year, and 5,556 in the second. A total of 181 species were identified, nearly 60% of them belonging to Polychaeta.
The polychaete stood out due to their numerical abundance and frequency of occurrence, and together accounted for 4,163 individuals (70%) in the first year and 3,167 (57%) in the second. The pattern observed in the two-year study was of a great
abundance of Armandia polyophthalma (Opheliidae),
characterizing the group of intertidal stations and also the subtidal stations 1, 2 and 3 during the winter.
Crustacea was the second most numerous group, although with a much smaller contribution than Polychaeta. In the first year, Crustacea varied from 18% (Jul/2003) to 10% (Dec/2003) of the whole macrofauna, and the most common species in both
periods were the amphipod Psammogammarus sp.,
and the tanaidacean Bunakenia sudvestatlantica,
especially in December. In the second year, the crustacean relative contribution reached 32% in Aug/2004, due to the great abundance of Leptocheliidae sp.1 (Tanaidacea), and in Jan/2005
amounted to 20%, especially due to
Psammogammarus sp. and the isopod Neohyssura sp.
Mollusca were represented by bivalves. The relative contribution of the group ranged from 7 to 10 % in the first study year, in July and December.
The dominant species in both periods were Nucula
semiornata and Tagelus divisus. Anomalocardia brasiliana was abundant in winter (Jul/2003) and
Macoma constricta in the summer (Dec/2003). In the
second year Mollusca ranged from 10 to 14%, also being dominated by the same species as in the first year.
Structure of the Communities
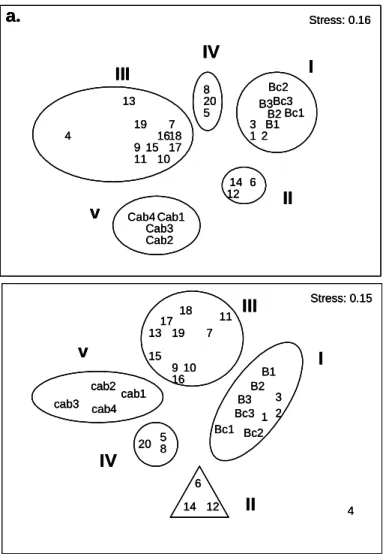
In the results of the NMDS analyses from winter (July 2003 and August 2004) and summer (December 2003 and January 2005), basically the same 5 station groups (Group I to V) were distinguished (Fig. 2). The diagrams presented here for both periods were drawn up on the mean percentages for the two winters and two summers.
Fig. 2. Diagram of the NMDS ordination analysis showing stations arranged as a function of species density data for the winters and summers studied. Density values correspond to the mean value of 3 replicates of each station. The “stress” value is given for the two-dimensional configuration for the log (x + 1) transformed data, using Bray-Curtis similarity. Station groups are identified by Roman numerals.
Group I: consisted of stations 1, 2, 3 and stations from the intertidal zone (B and Bc). In general, densities were higher in winter 2003 (July)
and in summer 2005 (January). Armandia
polyophthalma dominated in the first period, whereas
Laeonereis acuta was the most abundant species in the
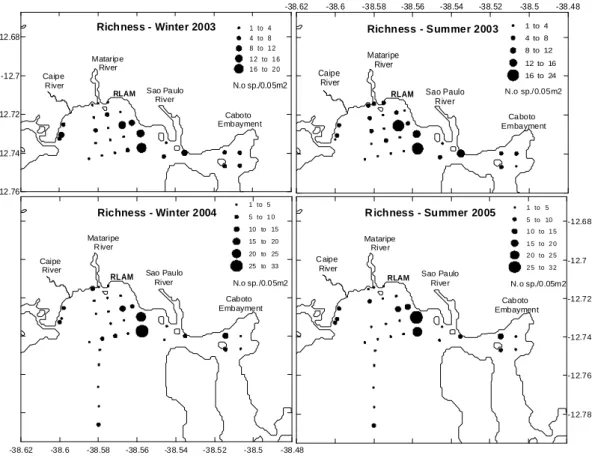
second one. Figure 3 shows the density patterns during the four sampling surveys.
Comparing the intertidal region (B stations) with the control region (Bc stations) in terms of total individual density, bifactorial analysis of variance revealed both spatial and temporal differences between the two areas, and there was also an interaction
between ‘space’ (B and Bc) and ‘time’ (variation among the 4 surveys) (Table 1).
With regard to species richness (S), Figure 4 shows that the 2003 winter survey presented a large number of species at the control stations, where station Bc2 displayed the highest number of species with an average of 11. In the second year, in general, higher values were also detected at the control stations, with station Bc1 standing out with 9 species. In both summers average richness never exceeded 6 species. Analysis of variance showed significant differences between the two regions (B and Bc), but not between samplings (Table 1).
1 2 3 4 5 6 7 8 9 10 11 12 13 14 15 16 17 18 19 20 Cab1 Cab2 Cab3 Cab4 B1B2 B3 Bc1 Bc2 Bc3 Stress: 0.16
II
I
III
IV
v
a.
2 3 1 4 5 6 7 8 9 10 11 12 13 14 15 16 17 18 19 20 cab1 cab2 cab3 cab4 B1 B2 B3 Bc1 Bc2 Bc3 Stress: 0.15II
I
IV
III
v
1 2 3 4 5 6 7 8 9 10 11 12 13 14 15 16 17 18 19 20 Cab1 Cab2 Cab3 Cab4 B1B2 B3 Bc1 Bc2 Bc3 Stress: 0.16II
I
III
IV
v
a.
1 2 3 4 5 6 7 8 9 10 11 12 13 14 15 16 17 18 19 20 Cab1 Cab2 Cab3 Cab4 B1B2 B3 Bc1 Bc2 Bc3 Stress: 0.16II
I
III
IV
v
a.
2 3 1 4 5 6 7 8 9 10 11 12 13 14 15 16 17 18 19 20 cab1 cab2 cab3 cab4 B1 B2 B3 Bc1 Bc2 Bc3 Stress: 0.15II
I
IV
III
v
2 3 1 4 5 6 7 8 9 10 11 12 13 14 15 16 17 18 19 20 cab1 cab2 cab3 cab4 B1 B2 B3 Bc1 Bc2 Bc3 Stress: 0.15II
I
IV
III
v
-38.62 -38.6 -38.58 -38.56 -38.54 -38.52 -38.5 -38.48
indiv./0.05m2
Density - Winter 2004
Sao Paulo River
Mataripe River
Caipe River
RLAM
Caboto Embayment -12.76
-12.74 -12.72 -12.7 -12.68
1 to 20 20 to 40 40 to 60 60 to 80 80 to 100 100 to 125
indiv./0.05m2 Density - Winter 2003
Mataripe River Caipe River
RLAM Sao Paulo River
Caboto Embayment
-12.78 -12.76 -12.74 -12.72 -12.7 -12.68
indiv./0.05m2
Density - Summer 2005
Sao Paulo River
Mataripe River
Caipe River
RLAM
Caboto Embayment
-38.62 -38.6 -38.58 -38.56 -38.54 -38.52 -38.5 -38.48
indiv./0.05m2 Density - Summer 2003 1 to 20 20 to 40
40 to 60 60 to 80 80 to 100 100 to 175 Sao Paulo
River Mataripe
River Caipe
River
RLAM
Caboto Embayment
1 to 30
3 0 to 60
6 0 to 90
9 0 to 120
1 20 to 150
1 50 to 204.4
1 to 20 20 to 40 40 to 60 60 to 80 80 to 104
Fig. 3. Benthic macrofauna average density (N = no indiv./0.05 m2) distribution at the oceanographic stations
sampled (a: Jul/2003; b: Dec/2003; c: Aug/2004; d: Jan/2005). Stations not marked with symbols present mean density values under 1 individual/0.05 m2.
Table 1. Results of the two-factor analysis of variance performed on biological community descriptors among the two groups of stations from the intertidal zone. Two treatments were considered (stations 1-3 B and stations 1-3 B control) (space) and 4 blocks (sampling times). N = 9 (3 samples of each B and B-c stations). Statistically significant values (α < 0.05) are given in bold type.
DENSITY
F (space) 7.65 p = 0.007
F (time)
11.01 p < 0.0001
F (space x time interaction) 9.76 p = 0.0001
RICHNESS
F (space) 16.01 p = 0.0004
F (time) 0.45 p = 0.72
F (space x time interaction) 4.61 p = 0.006 DIVERSITY
F (space) 57.71 p < 0.0001
F (time) 6.54 p = 0.001
F (space x time interaction) 9.65 p = 0.0001 EVENNESS
F (space) 49.01 p = 0.0001
F (time) 9.81 p < 0.0001
F (space x time interaction) 5.45 p = 0.0001
Values of Shannon’s diversity index (H’) obtained for the intertidal stations (sand banks - B) are in general larger at the control stations (control banks - Bc), except for the December 2003 campaign (Fig. 5). The evenness values also corroborate this pattern as shown in Table 2. The extremely low values recorded at the B stations in July 2003 and at B1 in January
2005 resulted from the dominance of Armandia
polyophthalma and Laeonereis acuta, respectively.
The examination of the Crustacea/Polychaeta ratio indicates a greater dominance of crustaceans,
especially cumaceans (Picrocuma and Cyclaspis) in
the control region (Table 2). Maximum values were found at Bc1 (5.0 in Dec/03) and Bc2 (8.0 in Aug/04).
The results of the SIMPER analysis performed on abundance data to determine the most important species within each intertidal station group, showed different patterns for both group B and Bc, and for the seasons studied (winter and summer). Station group B (average similarity 48%) showed that in both winter surveys the most important species
were A. polyophthalma, Picrocuma sp.1 and L. acuta,
contributing 78%, 11% and 4% to intra-group similarity, respectively. Station group Bc contributed
with a larger number of species, Picrocuma sp.1
(24%), Nemertea (21%), Armandia polyophthalma
(20%) and Cyclaspis sp.1 (17%). In the summer
surveys L. acuta dominated in both group B and Bc. In
group B this species was extremely dominant (97%), while at the control stations dominance (36%) was
shared with more species: Anomalocardia brasiliana
(21%), Nemertinea (16%), Capitella capitata (9%)
and Sigambra grubii (6%).
The biological variables showed no significant differences among the three stations of the group of stations 1, 2 and 3 of the subtidal/RLAM, when considered the sampling period (Table 3). In temporal terms, analysis of variance revealed that only the July/03 survey presented significantly higher densities than the other periods. The dominant species
at those stations was the above-mentioned A.
polyophthalma, followed by Goniada littorea and A. brasiliana, species also characteristic of the intertidal
station group. Lower values of diversity and evenness were recorded in the winter campaigns (2003 and
2004), mainly due to greater dominance of A.
polyophthalma. The other species that co-occurred in
this region showed neither spatial nor temporal variation.
Group II: comprised stations 6, 12 and 14 of the subtidal RLAM area and was composed mainly of medium and coarse sand, with an important calcium carbonate component. Total density varied over the four surveys but also among stations. The highest average value was recorded in the first summer (December 2003). In the following winter survey (August 2004), station 14 reached an average of 200 individuals/0.05 m2 (Fig. 3). In none of the four
surveys were significant differences among these three stations detected, because of the high standard deviations (Table 4).
-12.76 -12.74 -12.72 -12.7 -12.68
N.o sp./0.05m2
Richness - Winter 2003
Mataripe River Caipe
River
RLAM Sao Paulo River
Caboto Embayment
1 to 4 4 to 8 8 to 1 2 1 2 to 1 6 1 6 to 2 0
-38.62 -38.6 -38.58 -38.56 -38.54 -38.52 -38.5 -38.48
1 to 4 4 to 8
8 to 12
12 to 16 16 to 24
N.o sp./0.05m2 Richness - Summer 2003
Sao Paulo River Mataripe
River Caipe
River
RLAM
Caboto Embayment
-38.62 -38.6 -38.58 -38.56 -38.54 -38.52 -38.5 -38.48 N.o sp./0.05m2 Richness - Winter 2004
Sao Paulo River Mataripe
River
Caipe River
RLAM
Caboto Embayment
1 to 5
5 to 1 0
10 to 15
15 to 20
20 to 25
25 to 33
-12.78 -12.76 -12.74 -12.72 -12.7 -12.68
N.o sp./0.05m2 R ichness - Summer 2005
Sao Paulo River Mataripe
River C aipe
River
RLAM
Caboto Embayment
1 to 5
5 to 10
1 0 to 1 5
1 5 to 2 0
2 0 to 2 5
2 5 to 3 2
Fig. 4. Benthic macrofauna average species richness (S = no. spp./0.05 m2) distribution at the oceanographic
stations sampled (a: Jul/2003; b: Dec/2003; c: Aug/2004; d: Jan/2005). Stations not marked with symbols present mean richness values under 1 species/0.05 m2.
-12.76 -12.74 -12.72 -12.7 -12.68
nats/indiv x 0.05m2 Diversity - Winter 2003
Mataripe River Caipe
River
RLAM Sao Paulo River
Caboto Embayment
0.15 to 0.55 0.55 to 0.95
0.95 to 1.35
1.35 to 1.75
1.75 to 2.15
2.15 to 2.55
-38.62 -38.6 -38.58 -38.56 -38.54 - 38.52 -38.5 -38.48
nats/indiv x 0.05m2
Diversity - Summer 2003
Mataripe River
Caipe River
RLAM Sao Paulo
River
Caboto Embayment
0.21 to 0.58
0.58 to 0.94
0.94 to 1.31 1.31 to 1.67
1.67 to 2.04 2.04 to 2.40
-38.62 -38.6 - 38.58 -38.56 -38.54 -38.52 -38.5 -38.48
nats/indiv. x 0.05m2 Diversity - Winter 2004
Sao Paulo River Mataripe
River Caipe
River
RLAM
Caboto Embayment
0.15 to 0.58 0.58 to 1.02 1.02 to 1.45 1.45 to 1.89 1.89 to 2.32 2.32 to 2.76
-12.78 -12.76 -12.74 -12.72 -12.7 -12.68
nats/indiv. x 0.05m2 Diversity - Summer 2005
Sao Paulo River Mataripe
River Caipe
River
RLAM
Caboto Embayment
0.00 to 0.50 0.50 to 0.99
0.99 to 1.49
1.49 to 1.98 1.98 to 2.48
2.48 to 2.98
Fig. 5. Benthic macrofauna average Shannon-Wiener diversity indices (H´ = nats/ind.x0.05 m2) at the oceanographic
stations sampled (a: Jul/2003; b: Dec/2003; c: Aug/2004; d: Jan/2005).
Overall, species richness was variable but also high (Fig. 4). The highest value was observed in August 2004 at station 14, with 44 species and a mean species richness of 33 species. The lowest value was recorded at station 12 in July and December 2003, with 8 species each one. The mean values were more homogeneous and smaller in the first year of study. The ANOVA showed significant differences among stations only for the January 2005 survey, a period in which station 6 presented lower species richness than station 12, and the latter larger values than station 14 (Table 4). Considering our time scale, the richness values in the second year were higher than those of the first year, but no significant differences were detected between them.
This group of stations presented the highest diversity values for the whole area (Fig. 5). In-group and among sampling period comparisons revealed no significant differences except for January 2005 (Table 4), when station 6 presented lower values than the other two. On a temporal scale, diversity was smaller in both periods of the first year than in the second. Evenness was high and homogeneous, both spatially
and temporally (Table 2), reflecting a relatively uniform organism distribution among the species, and indicating the lack of marked specific dominance.
The best-represented species were the
polychaetes Nematonereis schmardae, Magelona
papillicornis, Typosyllis sp.1, the isopod Quantanthura menziesi and the bivalves Corbula caribaea and Macoma constricta. In both the winters
the polychaete Goniada littorea stood out.
In relation to the Crus/Poly ratio, station 12 presented the highest values, due to the isopod and amphipod contribution (Table 2).
Group III: consisted of stations 4, 7, 9, 10, 11, 13, 15-19 and 21-25 of the subtidal RLAM region and corresponded mainly to the central and eastern regions of the Todos os Santos Bay study area. It was characterized by the almost absolute predominance of pelitic sediments (91 to 99.8% of silt and clay) (FURTADO, 2005), high organic content and by
Heterophoxus videns, Neohyssura sp.1, Nucula semiornata, Corbula caribaea, Cirrophorus americanus, Diplodonta cf. notata and Lumbrinereis tetraura.
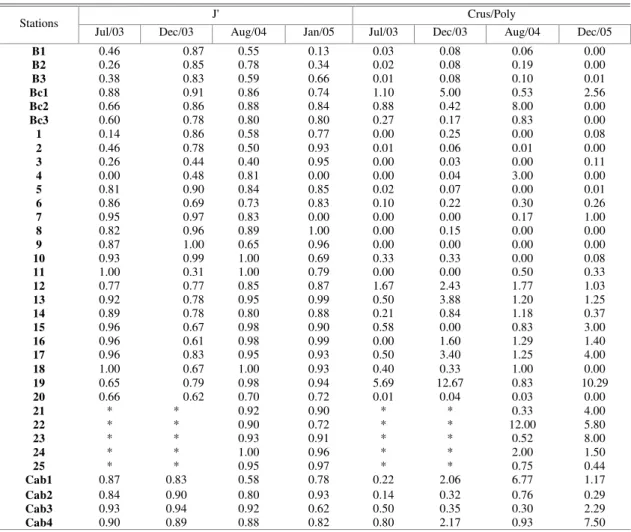
Table 2. Pielou’s equitability (J’) and Crustacea/Polychaeta ratios (Crus/Poly) obtained for the entire study period. * No data available
Table 3. Result of the analyses of variance performed on the group of stations 1, 2 and 3 and Subtidal RLAM area. Statistically significant values (α < 0.05) are given in bold type.
J' Crus/Poly
Stations
Jul/03 Dec/03 Aug/04 Jan/05 Jul/03 Dec/03 Aug/04 Dec/05
B1 0.46 0.87 0.55 0.13 0.03 0.08 0.06 0.00
B2 0.26 0.85 0.78 0.34 0.02 0.08 0.19 0.00
B3 0.38 0.83 0.59 0.66 0.01 0.08 0.10 0.01
Bc1 0.88 0.91 0.86 0.74 1.10 5.00 0.53 2.56
Bc2 0.66 0.86 0.88 0.84 0.88 0.42 8.00 0.00
Bc3 0.60 0.78 0.80 0.80 0.27 0.17 0.83 0.00
1 0.14 0.86 0.58 0.77 0.00 0.25 0.00 0.08
2 0.46 0.78 0.50 0.93 0.01 0.06 0.01 0.00
3 0.26 0.44 0.40 0.95 0.00 0.03 0.00 0.11
4 0.00 0.48 0.81 0.00 0.00 0.04 3.00 0.00
5 0.81 0.90 0.84 0.85 0.02 0.07 0.00 0.01
6 0.86 0.69 0.73 0.83 0.10 0.22 0.30 0.26
7 0.95 0.97 0.83 0.00 0.00 0.00 0.17 1.00
8 0.82 0.96 0.89 1.00 0.00 0.15 0.00 0.00
9 0.87 1.00 0.65 0.96 0.00 0.00 0.00 0.00
10 0.93 0.99 1.00 0.69 0.33 0.33 0.00 0.08
11 1.00 0.31 1.00 0.79 0.00 0.00 0.50 0.33
12 0.77 0.77 0.85 0.87 1.67 2.43 1.77 1.03
13 0.92 0.78 0.95 0.99 0.50 3.88 1.20 1.25
14 0.89 0.78 0.80 0.88 0.21 0.84 1.18 0.37
15 0.96 0.67 0.98 0.90 0.58 0.00 0.83 3.00
16 0.96 0.61 0.98 0.99 0.00 1.60 1.29 1.40
17 0.96 0.83 0.95 0.93 0.50 3.40 1.25 4.00
18 1.00 0.67 1.00 0.93 0.40 0.33 1.00 0.00
19 0.65 0.79 0.98 0.94 5.69 12.67 0.83 10.29
20 0.66 0.62 0.70 0.72 0.01 0.04 0.03 0.00
21 * * 0.92 0.90 * * 0.33 4.00
22 * * 0.90 0.72 * * 12.00 5.80
23 * * 0.93 0.91 * * 0.52 8.00
24 * * 1.00 0.96 * * 2.00 1.50
25 * * 0.95 0.97 * * 0.75 0.44
Cab1 0.87 0.83 0.58 0.78 0.22 2.06 6.77 1.17
Cab2 0.84 0.90 0.80 0.93 0.14 0.32 0.76 0.29
Cab3 0.93 0.94 0.92 0.62 0.50 0.35 0.30 2.29
Cab4 0.90 0.89 0.88 0.82 0.80 2.17 0.93 7.50
DENSITY RICHNESS
July/03 F = 1.55 p = 0.29 July/03 F = 1.33 p = 0.33
December/03 F = 5.31 p = 0.05 December/03 F = 4.33 p = 0.07
August/04 F = 0.76 p = 0.57 August/04 F = 0.02 p = 0.98
January/05 F = 0.89 p = 0.54 January/05 F = 0.81 p = 0.51
Among surveys F = 11.09 p = 0.0001 Among surveys F = 1.92 p = 0.21
DIVERSITY EVENNESS
July/03 F = 2.38 p = 0.31 July/03 F = 1.21 p = 0.42
December/03 F = 1.17 p = 0.45 December/03 F = 2.21 p = 0.19
August/04 F = 2.22 p = 0.09 August/04 F = 1.13 p = 0.54
January/05 F = 0.99 p = 0.50 January/05 F = 1.48 p = 0.38
Among surveys F = 15.26 p = 0.0001 Among surveys F = 11.92 p = 0.002
Table 4. Result of the analyses of variance performed on the group of stations 6, 12 and 14 of the Subtidal RLAM area (Group II). Statistically significant values (α < 0.05) are given in bold type.
DENSITY RICHNESS
July/03 F = 0.21 p = 0.81 July/03 F = 0.29 p = 0.76 December/03 F = 1.91 p = 0.23 December/03 F = 3.41 p = 0.10 August/04 F = 1.41 p = 0.31 August/04 F = 3.34 p = 0.10 January/05 F = 3.98 p = 0.08 January/05 F = 12.94 p = 0.007 Among surveys F = 1.41 p = 0.31 Among surveys F = 32.58 p < 0.001
DIVERSITY EVENNESS
July/03 F = 1.06 p = 0.41 July/03 F = 0.42 p = 0.51 December/03 F = 1.28 p = 0.34 December/03 F = 0.62 p = 0.43 August/04 F = 4.21 p = 0.07 August/04 F = 1.39 p = 0.28 January/05 F = 34.12 p = 0.001 January/05 F = 3.87 p = 0.06 Among surveys F = 11.72 p = 0.003 Among surveys F = 3.41 p = 0.07
This was the group with the lowest overall density figures (Fig. 3). Station 4, located nearer the effluent discharge of the refinery, always presented extremely low densities, with several azoic replicates in three out of four samplings. The exception was the
December 2003 survey, when Capitella capitata was
present with 10 individuals/0.05 m2. Another area with
low density was represented by station 11 and, as with station 4 in December 2003, a low density increase took place due to the presence of another opportunistic
capitellid, Mediomastus capensis. The five new
stations added in the second year of monitoring (21 to 25) also presented low densities, ranging from 1 to 23 individuals (Fig. 3).
Diversity reached the lowest values in Group III, especially at stations 4, 7 and 9-11, where they varied between 0.0 and 0.5 (Fig. 5). In the central transect diversity seems to grow with the distance from the refinery, as shown in figure 5, reaching its maximum value at station 25 (1.72). No clear seasonal variation was observed for richness (F = 2.21; p = 0.12) or diversity (F = 1.28; p = 0.09) among the four surveys.
Evenness was more variable in the first year of study than in the second (Table 2). Significantly lower values were observed for stations 4 and 19 (July/2003), stations 4 and 11 (December/2003) and 4 and 7 (January/2005).
Group III presented a strong numerical predominance of polychaetes, except for stations 19 and 21 to 24, where the crustacean contribution was almost always higher (Table 2).
Group IV: is represented by stations of the second transect parallel to the coast positioned in the
subtidal RLAM area (stations 5 and 8) and at the
mouth of the São Paulo River (station 20). The group was characterized by sandy-muddy sediments with variable concentrations of biodetritic carbonate. The most abundant species in all four surveys was
Sternaspis sp.1, a subsurface deposit-feeder. This species, together with Cirratullidae type 1 and
Cirrophorus branchiatus, contributed over 90% to average intragroup similarity.
The density pattern was variable and station 8 usually presented the lowest values. At station 20, densities were higher in the first year than in the second, while at station 5 the inverse trend was registered (Fig. 3). High values were related to the
abundance of the dominant species Sternaspis sp.1
The highest mean species richness was observed at station 5 in January 2005, and the lowest at station 8, in the same survey (Fig. 4). In the surveys of the first year, unlike those of the second, there were no significant differences among stations (F = 2.15; p = 0.19; F = 2.28; p = 0.18; Jul/03 and Dec/03 respectively). No significant differences were observed among the sampling periods (F = 1.38; p = 0.31).
Diversity showed significant differences only in July 2003 (station 5 with higher diversity than station 20; F = 5.45; p = 0.04) and in January 2005, when diversity at station 5 was higher than at the others (F = 22.89; p = 0.002). Considering the four surveys performed, no sharp changes were detected (F = 1.04; p = 0.39), except for the extremely low Jan/05 diversity value at station 8 (Fig 5).
Evenness presented great variability in the first year (Table 2), but in the second, no significant differences were detected among stations or surveys. In July 2003 station 5 presented an evenness index significantly higher than those of stations 8 and 20 (F = 11.14; p = 0.01). Temporal differences were observed only between those of July 2003 and December 2003, when the highest values were observed in the summer (F = 19.82; p = 0.002).
The Crus/Poly ratio at these stations was always lower than 0.15, indicating the extremely low crustacean contribution to the total fauna (Table 2).
Group V: Caboto Region. The Caboto stations were dominated by fine sediment fractions, mostly silty, and characterized by the presence of the
crustaceans Hexapanopeus schmitti (Brachyura),
Globosolembos sp. (Amphipoda), and of the
polychaetes Sternaspis sp1, Cirrophorus branchiatus,
Dasybranchus glabrus and Notomastus lobatus.
This group was distinguished by stable and relatively low densities, species richness and diversity but medium values of the Crustacean/Polychaete ratio. Caboto densities were generally low, except for Cab1 station, which presented average values over 60 indiv./0.05m2 in the second study year (Fig 3). The
species that most contributed to this high value were
Sternaspis sp 1. and C. branchiatus. Species richness
varied between 3 and 13, and Cab1 stood out in the second study year, with an average of 10 species/0.05
m2 (Fig. 4). The Crus/Poly ratio mostly evidenced the
small crustacean contribution, except for Cab1 and Cab 4 stations, where brachyuran and amphipod abundances elevated ratio values to a maximum of 6.77 and 7.50, respectively (Table 2).
Significant seasonal mean variation (F= 4.48; p = 0.001) was found when comparing diversity values between Group III (infralittoral RLAM stations) and Group V (Caboto stations), with lower values in Group III.
The BIO-ENV analysis, encompassing all the stations and environmental variables, revealed, for
both the winter and summer samplings, that the percentage of fine sand, the sediment selection coefficient and the organic carbon concentration were the factors that best explained the observed biological
patterns (ρw = 0.49 and 0.54 for winters and summers,
respectively). On the other hand, when considering only granulometry the BIO-ENV results showed that the best correlation was reached with coarse sand, fine sand and very fine sand (ρw = 0.38 for summer and
ρw = 0.36 for the winter).
Table 5 presents a summary of the main biological and environmental characteristics of the five groups of stations found in the northeastern area of Todos os Santos Bay. As observed, the C/N ratio varied between 7.9 (intertidal western stations) and 22.2 (pelitic stations) whereas organic carbon content was higher than 2.5% at stations 7, 9 and 11. Besides the differential granulometry and sedimentary organic content each group showed a distinct structure based also on biological indicators including species composition and dominance.
Table 5. Main environmental and biological variables of the different station groups considered in this study. Mean data within each group and of the four surveys of each variable studied are given. Values in bold type represent the variables that best explained the biological pattern for each group. CS = Coarse Sand; S = Sand; FS = Fine Sand; VFS = Very Fine Sand. TOC = Total organic Carbon; N = Nitrogen
Variable/
Stations Intertidal Group I (B 1-3, Bc 1-3)
Group I
Sts 1, 2, 3 Sts 6, 12, 14 Group II Remaining Group III Stations
Group IV
Sts 5, 8, 20 Caboto Stations Group V
Year
1 Year 2 1 Year Year 2 1 Year Year 2 1 Year Year 2 Year 1 Year 2 1 Year Year 2 Granulometry Fine to Very Fine
Sand Fine Sand Gravelly Sand Siltic clay Siltic Sand Silt Richness 5.1 4.8 3.7 4.4 15.1 22.4 7.6 6.3 2.7 3.0 5.1 7.2 Density 31.3 45.5 62.2 12.6 70.7 68.3 38.9 39.4 5.7 6.3 10.9 27.6
Evenness 0.7 0.59 0.49 0.88 0.74 0.86 0.77 0.86 0.78 0.79 0.89 0.79
Diversity 1.07 0.94 0.63 1.21 2.01 2.63 1.44 1.19 0.74 0.84 1.39 1.4
TOC (%) 0.27 0.3 0.17 0.21 0.26 0.46 0.88 1.21 1.7 2.01 1.29 1.16
N (%) 0.04 0.03 0.02 0.02 0.03 0.04 0.06 0.07 0.09 0.12 0.09 0.11
C/N (mol) 7.9 11.7 10.0 12.3 10.2 13.5 17.2 20.3 22.2 19.7 15.7 12.4
P (mg.Kg-1) 35.62 48.33 10.64 10.84
56.9 62.0 322.05 313.28 84.83 122.42 287.03 319.69
Main species Armandia polyophthalma Laeonereis acuta Picrocuma sp.1 Anomalocardia brasiliana
A. polyophthalma Goniada littorea A. brasiliana
Nematonereis schamardae Magelona papillicornis Typosyllis sp. 1 Quantanthura menziesi Corbula caribaea
Sternaspis sp.1 Cirratullidae sp C. branchiatus
Heterophoxus videns Neohyssura sp.
Psammogam-marus sp. 1 Nucula semiornata C. caribaea D. notata A. maculata C. branchiatus
M. capensis C. capittata
Hexapanopeus schmitti Globosolembos sp
D
ISCUSSIONAmong the typical benthic macrofaunal organisms polychaetes were generally the most abundant and frequent at the majority of the stations. So the high dominance of some species found in the area studied is not surprising, given that several authors have reported a similar pattern for intertidal and subtidal zones, and for shallow and deep sea areas, both in temperate, subtropical and/or tropical zones (WILDE et al., 1989; PETTI; NONATO, 2000; MUNIZ; PIRES-VANIN, 2005, among others). It is important to notice the low crustacean contribution in relation to polychaetes found at several stations, mainly of the intertidal and sand bar areas (Group I). The Crustacean/Polychaete (Crus/Poly) ratio is frequently utilized as a quick method to assess possible changes in the ecosystem. Crustaceans appear to be more sensitive than polychaetes and become less abundant at altered or contaminated sites (GRALL;
GLÈMAREC, 1997; STARK, 1998), while
polychaetes, more resistant and/or more opportunistic, are able to dominate under such conditions (WARWICK; CLARKE, 1994).
The results highlight some temporal variation in species dominance, especially at the intertidal stations. Also, the analyses of variance carried out with the biological community descriptors showed significant differences among the places sampled and also among the places sampled and season (summer and winter) but not between years, thus suggesting some temporal stability in the ecosystem dynamics. It has been proposed that this kind of variation may occur as a function of the species’ biology itself, or of some sort of interaction among species (MENGE;
SUTHERLAND, 1976; WALDBUSSER;
MARINELLI, 2006). But it is important to consider the biological data in their relationship with the environment, which is characterized by marked seasons caused by peculiar winter and summer conditions. During the two summers under observation the rainfall registered in the region was low and as a result the continental runoff was much reduced, thus increasing the stability of the water column (SILVEIRA; MIRANDA, 2005). In the winter months, on the other hand, the higher rainfall volume and the passage of frontal systems contributed to the instability of the water column and to the greater stirring of the sea floor, providing conditions for nutrient recycling. As a consequence the quantity of the organic matter increases and its quantity is enhanced and this affects the organisms living in the sediments. The highest values of abundance (Group I) and species diversity (Group II and IV) were found in winter (rainy season), giving support to this hypothesis.
Carbonate sediments may cover a greater area than do hard substrata in coral reefs, as shown by Riddler (1988) for some middle shelf reefs on the central Great Barrier Reef, and constitute important deposits for organic detritus (HATCHER 1983). Reef coralline bottoms occur in the northeastern part of Todos os Santo Bay, from south Maré Island to the east coast of Frades Island (HATJE; ANDRADE, 2009), and the stations which presented higher diversity and abundance values (Group II of stations) were placed on extensions of that area. High diversity is a good indicator of the degree of complexity of the ecosystem, and can indicate positive interactions among the species responsible for promoting stability and resistance to different forms of disturbance (LEVIN et al., 2001). Also, according to Fresi et al. (1983), diversity is greater in more heterogeneous sediments, given the greater microhabitat complexity associated with substrate characteristics.
On the other hand, stations of the central and eastern part of the study region are sites of low hydrodynamic energy, which favors greater deposition of fine sediment and accumulation of organic compounds (FURTADO, 2005). The observed pattern of low density, diversity and species richness in the pelitic sediments of those areas, corroborated by correlation analysis, is to be expected since they tend to generate reducing conditions when highly enriched with organic matter. Consequently, with this shift the bottom becomes unsuitable for most benthic organisms (PEARSON; ROSENBERG, 1978). It may even become azoic in highly disturbed environments (GRAY et al., 2002).
Tropical and subtropical regions usually present high species richness and high diversity as compared to those of temperate regions (WARWICK; RUSWAHYUNI, 1987; ALONGI, 1990). In the present study, richness was generally low at most stations and, together with the high dominance of only a few species, led to moderate diversity indices. In coastal regions containing oil refineries the impact is usually greater near the outlets of effluent discharges with a decrease towards distant sites (WAKE, 2005). In the present study this pattern was most evident in relation to diversity, mainly when station group III, the most homogeneous in relation to granulometry and organic matter content, was considered. The introduction of compounds that cause alterations in a system may stimulate the increase of tolerant and/or opportunistic species and cause the disappearance of more sensitive ones, given the high toxicity of some compounds (JEWETT et al., 1999; VENTURINI;
TOMMASI, 2004). First- and second-order
opportunists (PEARSON; ROSENBERG, 1978; BORJA et al., 2003; BIGOT et al., 2006) are able to colonize disturbed sediments in the absence of other
competitors. Therefore, the presence of Capitella
capitata, an opportunistic species (PEARSON; ROSENBERG, 1978), at station 4 in the summer surveys, might be an indication of some type of disturbance taking place in that area. In fact, Nicolaidou et al. (1993), studying the organic pollution of the sewer outfall in Saronikos Gulf in the vicinity of Athens, Greece, found a decline in the number of species and diversity and an increase in the density of opportunistic polychaete species such as Capitella capitata and Cirratulus cirratus.
The stations 7, 9, 10 and 11 could also be distinguished from the other pelitic sites of Group III by their extremely low density, diversity and organic carbon values above 2.5% (except at station 10). Because TOC concentrations are simply surrogates that can indicate potential problems in a system, gross changes in these concentrations are good indicators of potential threats (MÉNDEZ et al., 2008).
Although correlation with contaminants
(hydrocarbons, metals and metalloids) is lacking and we cannot conclusively establish a cause-effect relationship, the present results suggest that the study area represents a poor quality environment, especially in the northeastern and central parts. Besides, the sediment selection coefficient and the organic carbon concentration only partially explained the observed
biological patterns (ρw = 0.49 and 0.54 for winter and
summer, respectively). Similarly, this possibly harmful effect of an excess of organic compounds upon the benthic macrofauna may also be seen at the stations of the Caboto region. These sites were dominated by polychaetes, with a high capitellid contribution, and presented relatively low density, richness and diversity indices.
Early work designed for investigating the benthic macrofaunal distribution on unconsolidated bottoms of the northeastern portion of TSB (infralittoral area of the present project), ascertained that the structural differences in benthic associations were related not only to natural factors, such as type of sediment, but also to the human impact caused by
petroleum hydrocarbons and derivatives
(VENTURINI; TOMMASI, 2004). The authors reported that the area near the oil refinery´s effluent discharge outlet was azoic and presented the largest concentration of petroleum-derived hydrocarbons. Also, the anthropogenic influence was more intense closer to the refinery plant and at the mouth of the São Paulo River, tending to decrease towards more distant localities. More recently, Venturini et al., (2008) obtained further results for the same region by analyzing hydrocarbon indices and concentration ratios together with the ecological descriptors of macrobenthic fauna. The authors showed that the area is subject to chronic oil pollution and highlighted the importance of the petroleum related variables (specific concentration ratios and indices of petroleum
components), as the major structuring factors of the communities. Comparing the geochemical and biological data obtained by Venturini and Tommasi (2004) and Venturini et al. (2008) with the present findings, a clear similarity appears. So the existence of an important structural factor linked to the contamination acting on the community structure of the benthic macrofauna together with granulometry and organic content may be inferred.
The Caboto region was seen to be a well defined site in faunal terms due to the high average similarity obtained in both years. It should be noted, however, that in the second year of sampling Caboto1 presented much higher densities than the other stations, with a great amphipod and tanaidacean contribution. In spite of the general similarity of the sediment in Caboto, in the second year of study the proportion of gravel in relation to mud (silt plus clay) was more than twice as high as that at the Caboto1 station in the first year (FURTADO, 2005). The 3 stations of group IV presented mean values for the biological indicators closely similar to those of Caboto, except for density which was higher in group IV. This finding suggests that heterogeneous granulometry may provide space enough to support a larger quantity of organisms (FRESI et al., 1983; ALONGI, 1990). Further, they seem to enjoy more favorable environmental conditions than those provided by the other pelitic sites of the RLAM area. The abundance of organisms of different trophic guilds and life styles, such as the tubicolous melitoid
amphipod Psammogammarus sp. and the anthurid
isopod Neohyssura sp., the burrower crab
Hexapanopeus schmitti, the motile deposit-feeder
polychaetes (surface deposit-feeders and subsurface
deposit-feeders) besides the
suspension-feeder clam Corbula caribaea, are indicative of higher
ecosystem complexity (LEVIN et al., 2001). The suspension-feeders bring new particulate organic matter from the water column to the benthic system and bioturbators may bury it or bring it to the surface, thus intensifying the benthic-pelagic coupling (LEVIN et al., op. cit.).
Attention should also be paid to the large number of rare species found in the study region, as previously reported by Barroso et al. (2002) and by Venturini and Tommasi (2004). The importance of rare species in the interpretation of multivariate analyses is, to a certain degree, polemic (CAO; LARSEN; THORNE, 2001). Usually these species are removed from the analyses, since they account for a low percentage of variance and lead to high noise,
misleading results, especially when running
multivariate analyses (BOULTON et al., 1992; PIRES, 1992; MUNIZ; PIRES, 2000). This elimination is frequently arbitrary, lacking a clear biological and/or ecological explanation, with a possibly significant
information loss. Some authors argue that the concept of rare species in aquatic communities is relative to the sample size (CAO et al., 1997; 1998). They also alert to the possibility that their exclusion, whether explicit or implicit, may lead to misinterpretation in studies of impact assessment and/or ecology. In the present study the rare species were not excluded from the analyses, since on many occasions they did in fact explain the differentiation of station groups.
In conclusion, the results obtained in this present study make it clear that the biological characteristics of the macrofauna in the intertidal and infralittoral RLAM area do reflect the region’s
sedimentological pattern, and probably an
environmental disturbance gradient as well. As regards the pelitic areas, Caboto was seen to be biologically more complex, but cannot be considered a control area by virtue of the low values of the biological indices obtained there.
A
CKNOWLEDGEMENTSWe are grateful to PETROBRAS for the opportunity to collect and analyze the macrofauna samples related to the PROMARLAM project. We also wish to thank our colleagues of the Ecologia Bêntica Laboratory of the IO-USP for their help in the various stages of this work and for their critical reading of the manuscript. Two anonymous reviewers are acknowledged for their suggestions that improve the manuscript.
R
EFERENCESALONGI, D. M. The ecology of tropical soft-bottom benthic ecosystems. Oceanogr. mar. Biol. a. Rev.,v. 28, p. 381-496, 1990.
AMARAL, A. C. Z.; MORGADO, E. H ; SALVADOR, L. B. Poliquetas indicadores de poluição orgânica em praias paulistas. Revta Bras. Biol., v. 58, p. 307-316, 1998.
ASPILA, K. I.; AGEMIAN, A. S.; CHAU, Y. A semi-automatic method for determination of inorganic, organic and total phosphate in sediments. Analyst, v. 101, p. 187-197, 1976.
BARROSO, R.; PAIVA, P. C.; ALVES, O. F. S. Polychaete trophic structure in Todos os Santos Bay (BA-Brazil).
Bolm Mus. Nac., Zool., Rio de Janeiro, v. 494, p. 1-11, 2002.
BIGOT, L.; CONAND, C.; AMOUROUX, J M.; FROUIN, P.; BRUGGEMANN, H. ; GRÉMAREC, A. Effects of industrial outfalls on tropical macrobenthic sediment communities in Reunion Island (Southwest Indian Ocean). Mar. Pollut. Bull., v. 52, p. 865–880, 2006.
BORJA, A.; MUXICA, I ; FRANCO, J. The application of a marine Biotic Index to different impact sources affecting soft-bottom benthic communities along European coasts.
Mar. Pollut. Bull., v.47, p. 835-845, 2003.
BOULTON, A. J.; PETERSON, C. G.; GRIMM, N. B.; FISHER, S. G. Stability of an aquatic macroinvertebrate community in a multiyear hydrologic disturbance regime. Ecology, v. 73, p. 2192-2207, 1992.
BUSTOS-BAEZ, S.; FRID, C. Using indicator species to assess the state of macrobenthic communities.
Hydrobiology, v. 496, p. 299-309, 2003.
CAO, Y; BARK, A. W.; WILLIAMS, W. P. Effects of sample size on similarity measures in river benthic Aufwuchs macro-invertebrate community analysis. Wat. environ. Res., v. 69, p. 107-114, 1997.
CAO, Y.; WILLIAMS, D. D.; WILLIAMS, N. How important are rare species in aquatic community ecology and bioassessment? Limnol. Oceanogr. v. 43, p. 1403-1409, 1998.
CAO, Y.; LARSEN, D. P.; THORNE, R. ST-J. Rare Species in Multivariate Analysis for Bioassessment: Some Considerations. J. N. Am. Benthol. Soc., v. 20, p.
144-153, 2001.
CLARKE, K. R.; AINSWORTH, M. A method of linking multivariate community structure. Austr. J. Ecol., v. 18, p. 117-143, 1993.
CLARKE, K. R.; WARWICK, R. M. Change in marine communities: an approach to statistical analysis and interpretation. Plymouth: Plymouth Marine Laboratory Ed., 1994. 144 p.
DAUER, D. M. Biological criteria, environmental health and estuarine macrobenthic community structure. Mar. Pollut. Bull., v. 26, p. 249-257, 1993.
ELLIOTT, M.; QUINTINO, V. M. The estuarine quality paradox, environmental homeostasis and the difficulty of detecting anthropogenic stress in naturally stressed areas.
Mar. Pollut. Bull., v. 54, p. 640-645, 2007.
FOLK, R. L.; WARD, W. C. Brazos River bar: a study of the significance of grain size parameters. J. sedim. Petrol., v. 27, n. 1, p. 3-27, 1957
FRESI, E; GAMBI, M. C; FOCARDI, S; BARGAGLI, R; BALDI, F ; FALLIACI, L. Benthic community and sediment types: a structural analysis. Mar. Ecol. (P.S.Z.N.I), v. 4, p. 101-121, 1983.
FURTADO, V. V. Geologia. In: Programa de monitoramento ambiental do ecossistema estuarino na área deinfluência da Refinaria Landulpho Alves.
IOUSP/PETROBRAS/ CENPES, 2005. p. 575-598. GRALL, J.; GLÈMAREC, M. Using biotic indices to
estimate macrobenthic community perturbations in the Bay of Brest. Estuar. coast. Shelf Sci., v. 44, p. 43-53,
1997.
GRAY, J. S.; WU, R. S.; OR Y. Y. Effects of hypoxia and organic enrichment on the coastal marine environment.
Mar. Ecol. Progr. Ser., v. 238, p. 249-279, 2002.
GRASSHOFF, K.; EHRHARDT M.; KREMLING, K.
Methods of seawater analysis. 2nd. ed.. Weinhein:
Verlag Chemie, 1983. 419p.
GROSS, M. G. Carbon Determination. In: CARVER. R.E. (Ed). Procedures in sedimentary Petrology. New York: WILEY – INTERSCIENCE, 1971. p. 573-596.
HATCHER, B. G. The role of detritus in the metabolism and secondary production of coral reef ecosystems. In: BAKER, J. T. et al. (ed.). INAUGURAL GREAT BARRIER REEF CONFERENCE, Townsville, 28 Aug-2 Sep 1983. Proceedings …Townsville: JCU Press. p. 317-324, 1983.
HATJE, V.; ANDRADE, J. B. (Org.). Baía de Todos os Santos. Aspectos Oceanográficos. Salvador: EDUFBA, 2009. 304 p.
JEWEET, S. C.; DEAN, T.; SMITH, R. O.; BLANCHARD, A. Exxon Valdez´ oil spill: impacts and recovery in the soft-bottom benthic community in and adjacent to eelgrass beds. Mar. Ecol. Progr. Ser., v. 185, p. 59-83, 1999.
KRUSKAL, J. B.; WISH, M. Multidimensional scaling. Beverly Hills: Sage Publications, 1978. 93 p.
LESSA, G. C.; CIRANO, M.; GENZ, F.; TANAJURA, C. A. S; SILVA, R. R. Oceanografia Física. In: HATJE, V.; ANDRADE, J. B. (Org.). Baía de Todos os Santos. Aspectos Oceanográficos. EDUFBA, 2009. p. 71-119. LEVIN L. A.; BOESCH D. F.; COVICH A. et al. The
function of marine critical transition zones and the importance of sediment biodiversity. Ecosystems, v.4,
p.430-51, 2001.
MÉNDEZ, N.; FLOS, J.; ROMERO, J. Littoral soft-bottom polychaete communities in a pollution gradient in front of Barcelona (western Mediterranean, Spain). Bull. mar. Sci., v. 63, p. 167-178, 1998.
MENGE, B.; SUTHERLAND, J. P. Species Diversity Gradients: synthesis of the roles of predation, competition, and temporal heterogeneity. Am. Naturalist., v. 110, n. 973, p. 351-369, 1976.
MIRZA, F. B.; GRAY, J. S. The fauna of benthic sediments from the organically enriched Oslofjord, Norway. J. expl mar. Biol. Ecol., v. 54, p. 181-207, 1981.
MUNIZ, P.; PIRES, A. M. S. Trophic structure of polychaetes in the São Sebastião Channel (Southeastern Brazil). Mar. Biol., v. 134, p. 517-534, 1999.
MUNIZ, P.; PIRES, A. M. S. Polychaete associations in a subtropical environment (São Sebastião Channel, Brazil): a structural analysis. Mar. Ecol. (P. S. Z. N. I),
v. 21, p. 145-160, 2000.
MUNIZ, P.; PIRES-VANIN, A. M. S. More about taxonomic sufficiency: a case study using polychaete communities in a subtropical bay moderately affected by urban sewage. Ocean Sci. J., v. 40, p. 127-143, 2005.
NICOLAIDOU, A.; ZENETOS, A.; PANCUCCI, M. A.; SIMBOURA, S. Comparing ecological effects of two different types of pollution using multivariate techniques.
Mar. Ecol., v.14, n. 2, p. 113 - 128, 1993.
PEARSON, T. H ; ROSENBERG, R. 1978. Macrobenthic succession in relation to organic enrichment and pollution of the marine environment. Oceanogr. mar. Biol. a. Rev., v. 16, p. 229-331, 1978.
PESO-AGUIAR, M. C.; SMITH, D. H.; ASSIS, R. C.; F.; SANTA-ISABEL, L. M.; PEIXINHO, S.; GOUVEIA, E. P.; ALMEIDA, T. C. A.; ANDRADE, W. S.; CARQUEIJA, C. R..G.; KELMO, F.; CAROZO, G.; RODRÍGUEZ, C. V.; CARVALHO, G. C.; JESÚS, A. C. S. Effects of petroleum and its derivatives in benthic communities at Baía de Todos os Santos/Todos os Santos Bay, Bahia, Brazil. Aquat. Ecos. Hlth Mgmt, v. 3, p. 459-470, 2000.
PETTI, M.A.V ; NONATO, E. F. Temporal variation of Polychaetes from Picinguaba and Ubatumirim bights (Southeastern Brazil). Bull. mar. Sci., v. 67, p. 127-136, 2000.
PIRES, A. M. S. Structure and dynamics of benthic megafauna on the continental shelf offshore of Ubatuba, southeastern Brazil. Mar. Ecol. Progr. Ser., v. 86, p.
63-76, 1992.
PORTE, C.; BARCELÓ, D.; TAVARES, T. M.; ROCHA, V.; ALBAIGÉS, J. The use of the mussel watch and molecular marker concepts in studies of hydrocarbons in a tropical bay (Todos os Santos, Bahia, Brazil).
Archs environ. Contamin. Toxicol., v.19, p. 263-274, 1990.
RIDDLE, M. J. Patterns in the distribution of macrofaunal communities in coral reef sediments on the central Great Barrier Reef. Mar. Ecol. Progr. Ser., v. 47, p. 281-292, 1988.
RUTTENBERG, K.; GOÑI, M. A. Phosphorus distribution, C: N: P ratios, and δ13Coc in arctic, temperate and tropical coastal sediments: tools for characterizing bulk sedimentary organic matter. Mar. Geol., v.139, p.
123-145, 1997.
SILVA, A. M. B. S.; TAVARES, T. M.; LANDIM, H. B. Determination of mercury in intertidal bivalves along the coast of Todos os Santos Bay. Ciênc. Cult., S. Paulo,
Supl 33, p. 519, 1981.
SILVEIRA, I. C. A.; MIRANDA, L.B. Oceanografia Física. In: Programa de Monitoramento Ambiental do Ecossistema Estuarino na Área de Influência da
Refinaria Landulpho Alves.
IOUSP/PETROBRAS/CENPES, 2005. p. 54-153. SOUZA, S. P.; TAVARES, T. BRANDÃO, A. M.
Distribution of lead, cadmium and zinc in sediments of the Subaé river estuary, Bahia.Ciênc. Cult., S. Paulo, Supl 30, p. 406, 1978.
STARK, J.S. Effects of copper on macrobenthic assemblages in soft-sediments: a laboratory experimental study.
Ecotoxicology, v. 7, p. 161-173, 1998.
SUGUIO K. Introdução à sedimentologia. São Paulo: Edgar Blucher. 1973. 317 p.
TAVAREZ, T. M.; ROCH, V. C.; PORTE, C.; BARCELÓ, D ; ALBAIGÉS, J. Application of the mussel watch concept in studies of hydrocarbons, PCBs and DDT in the Brazilian Bay of Todos os Santos (Bahia). Mar. Pollut. Bull., v. 19, p. 575-578, 1998.
VENTURINI, N ; TOMMASI, L. R. Polycyclic aromatic hydrocarbons and changes in the trophic structure of polychaete assemblages in sediments of Todos os Santos Bay, Northeastern Brazil. Mar. Pollut. Bull., p. 97-107, 2004.
WAKE, H. Oil refineries: a review of their ecological impacts on the aquatic environment. Estuar. coast. Shelf Sci., v. 62:, p. 31–140, 2005.
WALDBUSSER, G. G.; MARINELLI, R.L. Macrofaunal modification of porewater advection: role of species function, species interaction, and kinetics. Mar. Ecol. Progr. Ser., v. 311: 217–231, 2006.
WARWICK, R. M.; CLARKE, K. R. Relearning the ABC: taxonomic changes and abundances/biomass relationships in disturbed benthic habitats. Mar. Biol., v.
118, p. 739-744, 1994.
WARWICK, R. M.; RUSWAHYUNI. Comparative study of the structure of some tropical and temperate marine soft-bottom macrobenthic communities. Mar. Biol., v. 95, p. 641-649, 1987.
WILDE, P. A.; KASTORO, W. W.; BERGHUIS, E. M.; ASWANDY, I.; ALHAKIM, I.; KOK, A. Structure and energy demand of the benthic soft-bottom communities in the Java Sea and around the Islands of Madura and Bali, Indonesia. Netherl. J. Sea Res., v. 23, p. 449-461, 1989.
ZAR, J. H. Biostatistical analysis. Upper Saddle River,
N.J.: Prentice Hall, 1999. 663 p.
ZENETOS, A.; BOGDANOS, C. Benthic community structure as a tool in evaluating effects of pollution in Elefsis Bay. Thalassographica, v. 10, p. 7-21, 1987.
(Manuscript received 05 November 2009; revised 05 March 2010; accepted 20 July 2010)