www.ann-geophys.net/26/3783/2008/ © European Geosciences Union 2008
Annales
Geophysicae
Simultaneous observations of Polar Mesosphere Summer Echoes at
two different latitudes in Antarctica
H. Nilsson1, S. Kirkwood1, R. J. Morris2, R. Latteck3, A. R. Klekociuk2, D. J. Murphy2, M. Zecha3, and E. Belova1 1Swedish Institute of Space Physics, Kiruna, Sweden
2Australian Antarctic Division, Kingston, Tasmania, Australia 3Leibniz-Institute of Atmospheric Physics, K¨uhlungsborn, Germany
Received: 28 April 2008 – Revised: 21 October 2008 – Accepted: 22 October 2008 – Published: 27 November 2008
Abstract. Simultaneous observations of Polar Mesosphere Summer Echoes (PMSE) at Wasa and Davis in Antarctica have been compared. Data with simultaneous observations were obtained for 16 days between 18 January and 5 Febru-ary 2007. Wasa is at a higher geographic latitude than Davis, but at lower geomagnetic latitude. PMSE strength and oc-currence frequency were significantly higher at Wasa. The variation of daily PMSE occurrence over the measurement period was in agreement with temperature and frost-point estimates from the Microwave Limb Sounder on the Aura spacecraft for both Wasa and Davis. The diurnal variation of PMSE strength and occurrence frequency as well as the shape of the altitude profiles of average PMSE strength and occurrence frequency were similar for the two sites. The deepest part of the evening minimum in PMSE occurrence frequency occurred for the same magnetic local time at the two sites rather than for the same local solar time. The study indicates that PMSE strength and occurrence increase between 68.6◦and 73◦ geographic latitude, consistent with
observed differences in mesospheric temperatures and water vapor content. The average altitude distribution of PMSE varies relatively little with latitude in the same hemisphere. Keywords. Atmospheric composition and structure (Aerosols and particles; Middle atmosphere – composition and chemistry) – Meteorology and atmospheric dynamics (Middle atmosphere dynamics)
1 Introduction
Polar Mesosphere Summer Echoes (PMSE) are radar echoes from the summer mesopause. PMSE results from electron density inhomogeneities at the radar Bragg scale, mainly caused by charged subvisual aerosols. Layered atmospheric
Correspondence to:H. Nilsson ([email protected])
turbulence appears to play a role as well. The aerosols may grow to visual size to cause the related phenomena of polar mesospheric clouds. PMSE requires temperature below the frost point and an ionization source: solar Lymanα or en-ergetic charged particle precipitation. For a recent review of the formation mechanism behind PMSE see Rapp and L¨ubken (2004).
As more VHF radars have become available for the study of PMSE, it has become possible to investigate latitudinal and hemispheric differences in the strength and occurrence frequency of these strong radar echoes. The reports regard-ing latitude dependence are somewhat contradictory: L¨ubken et al. (2004b) found PMSE to be more prevalent at higher lat-itudes in the European sector, whereas Huaman et al. (2001) found PMSE to be less prevalent at higher latitude. Initial measurements of PMSE in the Southern Hemisphere failed to detect any PMSE at 62◦S latitude (Balsley et al., 1993),
and later measurements from the same site showed only weak PMSE (Woodman et al., 1999). This could be interpreted as a large temperature difference of 7.5 K between the two hemi-spheres. Sounding rocket measurements of the temperature at 68◦ did not find such a large temperature difference
be-tween the hemispheres (L¨ubken et al., 2004a). Later PMSE measurements has also been made from Davis, Antarctica, (Morris et al., 2006, 2007) and Wasa, Antarctica (Kirkwood et al., 2007). Direct latitude comparisons have so far only been reported for the Northern Hemisphere.
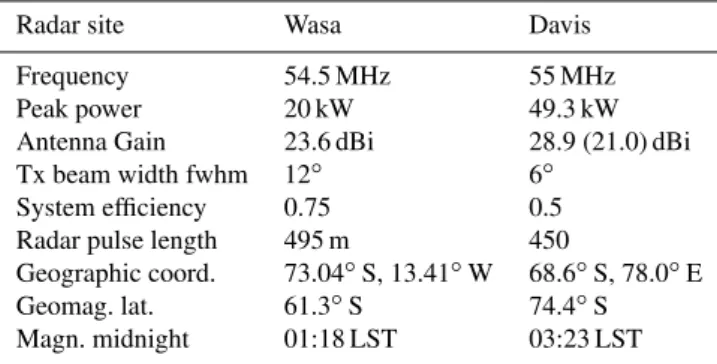
Table 1. Summary of radar parameters.
Radar site Wasa Davis
Frequency 54.5 MHz 55 MHz
Peak power 20 kW 49.3 kW
Antenna Gain 23.6 dBi 28.9 (21.0) dBi
Tx beam width fwhm 12◦ 6◦
System efficiency 0.75 0.5
Radar pulse length 495 m 450
Geographic coord. 73.04◦S, 13.41◦W 68.6◦S, 78.0◦E
Geomag. lat. 61.3◦S 74.4◦S
Magn. midnight 01:18 LST 03:23 LST
the Northern Hemisphere and Davis in the Southern Hemi-sphere (Latteck et al., 2008). What these studies found was that for comparable geographical latitudes (Andenes (69.3◦N) and Davis (68.6◦S) the PMSE occurrence
fre-quency and strength were significantly lower in the South-ern Hemisphere. When comparing PMSE between Kiruna (67.9◦N), and Wasa Antarctica, at a higher geographical
lat-itude (73.0◦S), the PMSE strength and occurrence frequency
were similar. Finally the PMSE strength and occurrence fre-quency at Resolute Bay (75◦N) were much less than at the
lower latitude Andenes site.
Interhemispheric and latitude differences have been mod-elled by L¨ubken and Berger (2007) using the LIMA/ice model. Their model reproduces the interhemispheric differ-ence in PMSE strength and occurrdiffer-ence between Andenes and Davis (Latteck et al., 2007). They also find that the differ-ences between the hemispheres are smaller at higher latitudes and that generally PMSE should be more prevalent and the PMSE season longer at higher latitudes. The latitude depen-dence of the model is however at odds with the Resolute Bay results (Latteck et al., 2008; Huaman et al., 2001). Clearly it is worthwhile to further compare simultaneous PMSE data from different latitudes and compare this with the LIMA/ice model.
In this paper we compare simultaneous calibrated mea-surements from Davis at 69◦S and Wasa at 73◦S geographic
latitude. These two sites are also at very different geomag-netic latitudes: 74.4◦for Davis vs. 61.3◦for Wasa.
2 Observational technique
We use data from the Movable Atmospheric Radar for Antarctica (MARA) and the MST radar at Davis. The MARA radar is described in Kirkwood et al. (2007). The Davis radar is described in Morris et al. (2006) and Latteck et al. (2007). Some of the characteristics are given in Table 1. Radar pulse length is given for the radar mode used in this study. In order to compare calibrated values, we calculate
the volume radar reflectivity for both radars (Gage, 1990). The volume radar reflectivity is given by
η= Pr Pt
256(2 ln 2)r2 π eGrλ21rF
(1) wherePr is the received power,Pt is the transmitted power,
r is the distance to the scattering volume, 1r is the pulse length in meters,eis the efficiency factor given in Table 1, Gris the antenna receiver gain andF is the volume fill factor.
The formula is valid for the case when the whole scattering volume defined by the transmitter antenna contribute to the scatter, and is within the volume received by the receiver an-tenna. For the MARA radar at Wasa the receiver antenna is the same as the transmitter antenna. For Davis, only one antenna group has been used in the estimate of the received signal strength, so the receiver antenna gain is about 1/6 of the transmitter gain (value in brackets in Table 1). We have assumed a fill factor of 1 in our calculations; i.e. that is we have isotropic volume scatter and that transmitter beam width is less than or equal to the beam width on reception. The lat-ter condition is satisfied by the experimental configuration. The former condition may not be satisfied. For the purpose of comparison between the radars the most important factor is that the scatter may be stronger from close to zenith than in the rest of the scattering volume. For exactly the same PMSE this would lead to a higher volume reflectivity estimate from the Davis radar than the Wasa radar due to the concentration of the transmitter beam closer to zenith for Davis.
We have also used temperature and water vapor estimates from the Microwave Limb Sounder (MLS) on the Aura spacecraft. The temperature and geopotential height esti-mates from MLS processing software V2.2 are discussed in detail by Schwartz et al. (2008), and the MLS middle at-mosphere water vapor data are discussed in Lambert et al. (2007). We used data gridded with 3 km resolution in geopo-tential height. Such a comparison between Aura MLS data and Davis radar data has previously been reported by Mor-ris et al. (2007), for the PMSE season 2004/2005. We also use wind estimates from the medium frequency (MF) radar at Davis (Murphy et al., 2007) in order to compare the presence of PMSE with zonal and meridional winds.
3 Results
3.1 Day-to-day variation of PMSE strength and occurrence For the occurrence frequency study we have used a detection threshold at a volume reflectivity of 10−15m−1. The
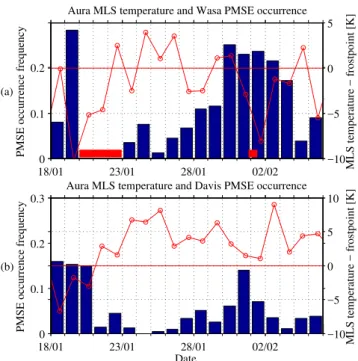
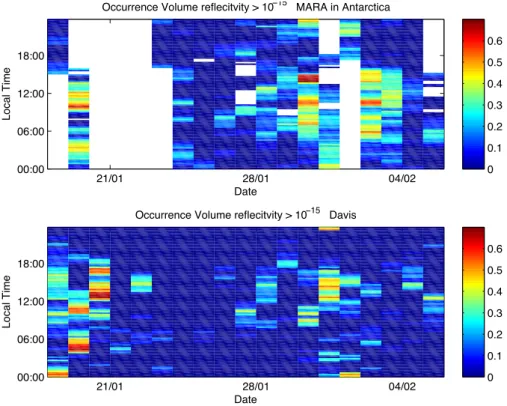
shows the relative occurrence of PMSE above this thresh-old for each day with observations. Wasa data are shown in the upper panel, and Davis data in the lower panel. The oc-currence frequency is calculated over all altitude gates and sampling times in the 80 to 90 km altitude region. There-fore PMSE above the threshold in half the altitude gates all the time would yield an occurrence frequency of 50%. Oc-currence shown is for the time the radar was running on each day, which is always 24 h for Davis. For Wasa this is on some occasions only a fraction of the day. Days without measure-ments at Wasa or with significant data gaps are indicated with horizontal red bars in Fig. 1. Some other days contain smaller data gaps of about 1 h. If the occurrence frequency for Davis is calculated only for time periods when we have data from the Wasa radar the occurrence frequency at Davis is some-what lower. The data gaps and the distribution of the PMSE is shown with 15 min time resolution in Fig. 2. The y-axis of Fig. 2 shows the date, and the y-axis shows the local so-lar time. Occurrence frequency is colour coded according to the bar to the right of the main panels, and were calculated for the altitude range 80 to 90 km. White in panel (a) (Wasa) indicates data gaps. There are no data gaps in the Davis data. PMSE above a volume reflectivity of 10−15m−1 is more
common above Wasa. A marked minimum in PMSE occur-rence can be seen; from 23 January to 26 January at Davis, around the time of a minimum at Wasa on 25 January. Both radars show peaks in the PMSE occurrence rates in the begin-ning of the measurement period (18–20 January for Davis) and in the period 31 January to 1 February (Davis) and 30 January to 3 February (Wasa). There is no clear evidence that these variations are due to planetary waves. For example the 5 day planetary wave which is well known to modulate PMSE and noctilucent clouds in the Northern Hemisphere (Kirkwood et al., 2002; Kirkwood and Stebel, 2003) would have a 5 day cycle and more than 1 day phase shift between Wasa and Davis. Some variability with approximately a 5 day period can be discerned in the Davis data, but the closest corresponding peaks/troughs at Wasa have a rather variable phase relation. There is no evident 5 day wave modulation in the Wasa data.
Davis MF radar winds show strong positive (equatorward) meridional wind around the time of the first maximum in PMSE occurrence frequency and generally positive merid-ional wind during the second maximum as shown in Fig. 3, panel (b). The MF radar data is averaged over 1 day to re-move the influence of tides. During the PMSE occurrence minimum period the MF radar indicates variable meridional wind with some occurrence of significant negative (pole-ward) values. The zonal wind showed a shear in the middle of the PMSE region around 85 km altitude throughout the period as is expected at the summer mesopause (Fig. 3a).
18/01 23/01 28/01 02/02
0 0.1 0.2
PMSE occurrence frequency
Aura MLS temperature and Wasa PMSE occurrence
(a)
MLS temperature − frostpoint [K]
−10 −5 0 5
18/01 23/01 28/01 02/02
0 0.1 0.2 0.3
Date
PMSE occurrence frequency
Aura MLS temperature and Davis PMSE occurrence
(b)
MLS temperature − frostpoint [K]
−10 −5 0 5 10
Fig. 1.Occurrence frequency of PMSE for each day for Wasa (top panel) and Davis (bottom panel), left y-axis. Data between 80 and 90 km were used. Periods when the MARA radar at Wasa was not operating are indicated by thick horizontal red lines. The temper-ature minus the frostpoint as estimated from Aura MLS measure-ments are shown with red lines, right y-axis.
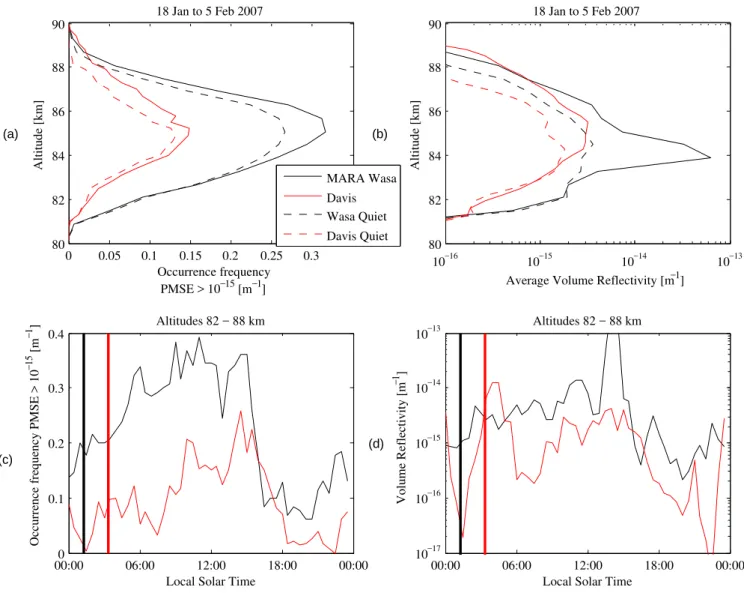
3.2 Altitude and diurnal distribution of PMSE
The occurrence frequency and strength of PMSE above Wasa and Davis varied considerably during the measurement pe-riod. We have therefore opted to calculate average altitude and diurnal profiles of PMSE strength and occurrence for the entire period and for a more uniform background period. The background period excludes the strong PMSE events on 18– 20 January and 30 January. Data from the whole PMSE sea-son at Davis indicates that the relatively stronger PMSE dur-ing 18 to 20 January is actually more typical for the entire season (not shown). The diurnal and altitude distributions of the PMSE echoes are summarized in Fig. 4. Magnetic midnight occurs at 03:23 local solar time (LST) at Davis and at 01:18 LST at Wasa and these are indicated by verti-cal bars in Fig. 4, panels (c) and (d), with black for Wasa and red for Davis, and were calculated using the NASA GSFC web service at http://modelweb.gsfc.nasa.gov/models/cgm/ cgm.html.
21/01 28/01 04/02 00:00
06:00 12:00 18:00
Date
Local Time
Occurrence Volume reflecitvity > 10−15 MARA in Antarctica
0 0.1 0.2 0.3 0.4 0.5 0.6
21/01 28/01 04/02
00:00 06:00 12:00 18:00
Date
Local Time
Occurrence Volume reflecitvity > 10−15 Davis
0 0.1 0.2 0.3 0.4 0.5 0.6
Fig. 2.Occurrence frequency of PMSE for each day for Wasa (top panel) and Davis (bottom panel). Data between 80 and 90 km were used.
Thex-axis shows the Date and the y-axis the local solar time.
echo profile for the background (dashed line) period. There is a significant difference in the shape of the profile only at the lowest altitude around 82 km.
The diurnal distributions of the PMSE occurrence and av-erage volume reflectivity are similar for Davis and Wasa. Both distributions show pronounced minima starting at about 15:00 to 16:00 LST. The decline in occurrence is steeper at Wasa. The minimum is more pronounced at Davis, with particularly low occurrence frequency between 18:00 and 22:00 LST. It is difficult to set a clear end for the minimum from the Wasa data but there is an increasing trend from about 21:00 LST. Day-to-day variability is large, and the on-set of the evening minimum is the statistically most signif-icant feature. The deepest part of the occurrence frequency minimum is reached at about the same magnetic local time for both sites, as is the end of the deepest minimum. The deepest part of the occurrence frequency minimum is be-tween 15:00 and 19:00 MLT at both sites. Variability in oc-currence frequency is also lower for the deepest minimum, making it clearly significant from a statistical point of view, despite the large day to day variability. We show this in Fig. 5 where we show the standard deviation of the occurrence fre-quency in the 82 to 88 km altitude interval for Wasa (black) and Davis (red). The plot is rather similar to the occurrence frequency plot. The most notable features are that the vari-ance goes down at about the same local solar time at both sites, and increase rather suddenly at about the same
mag-netic local time, just after 19:00 MLT. Vertical bars indicates 19:00 MLT for Wasa (black) and Davis (red).
We provide a plot of the diurnal variation of the average volume reflectivity in Fig. 4d. The average volume reflectiv-ity varies by orders of magnitude and features in such a plot may come from individual days when only 16 days of data are available. This is the case for the peak around magnetic midnight at Davis.
3.3 MLS estimates of temperature and frostpoint
procedure, they do not represent the noise level in the data. The temperature estimate varies more than the frost point estimate in the time series. Despite this, and the large er -ror estimates for the frost point, agreement between PMSE occurrence is better for the temperature minus frost point than for just temperature. We have chosen not to use the 89 km frost point value because of the enormous error es-timate from the version 2.2 data processing software. One may further note that the absolute level of the MLS temper-ature minus frost point has changed considerably between MLS version 1.5 and version 2.2 processing software. There-fore one should mainly consider the relative variation in tem-perature minus frost point for this comparison. We present data using the latest public version of the MLS data, ver-sion 2.2. Because of the orbit of the Aura satellite and the way the MLS instrument is operated MLS data for the lo-cations of Wasa and Davis were obtained for two local so-lar time ranges each day: around 15:00 to 16:00 LST and around midnight LST. We will only use the former data set. The temperature minus the frost point is shown as red lines in Fig. 1, using the right hand scale. Data for the location of Wasa is shown in panel (a) and for Davis in panel (b). A rather good general agreement can be found with higher oc-currence frequency for lower temperature relative to the frost point. In Fig. 6 we show a scatter plot of the daily occur-rence frequency as a function of the temperature minus frost point at 15:00 to 16:00 LST. Data for Wasa is shown with black circles and Davis data with red triangles. A trend can be seen, though the Wasa data shows some scatter. Least square fits of a linear function are shown with solid lines. A thick black line indicates a fit to all the data, with PMSE oc-currence frequency=0.08−0.012×(T−Tfrost). The correla-tion coefficient is−0.7 and within the range−0.45 to−0.84
with 95% confidence. The likelihood that the real correla-tion is 0 is 10−5. The relationship between temperature and
daily occurrence frequency is almost the same for the indi-vidual sites, the coefficient for the temperature dependence is within 0.001 of the value for the combined data set. MLS data shows that the temperature was typically further below the frost point before 18 January (not shown). The time in-terval of simultaneous measurements appears to represent a transition from the main PMSE season to an end of season interval when the average mesopause state is no longer fa-vorable for PMSE formation.
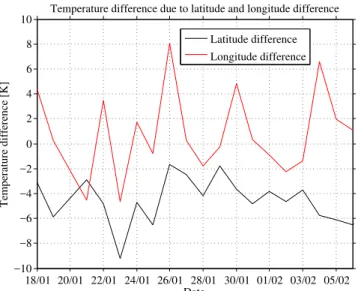
The previous studies cited in the introduction have con-cerned a latitude dependence of the PMSE strength and oc-currence frequency. Is it possible that the difference between the Wasa and Davis sites is due to a consistent longitude dif-ference in the atmosphere, rather than due to the change of latitude? Wasa and Davis are almost 90◦apart in longitude.
In order to assess this possibility we have compared the tem-perature difference between the Wasa site and a point at the same longitude as Davis but the same latitude as Wasa, and with a point at the same latitude as Wasa but the same lon-gitude as Davis. We used Aura MLS data from the three
Fig. 3. Davis MF radar wind data, running average over 1 day. The top panel shows the zonal wind and the bottom panel the meridional
wind [m s−1], as a function of date (x-axis) and height (y-axis).
pressure levels corresponding approximately to altitudes of 83, 86 and 89 km. The result is shown in Fig. 7. Tempera-ture data was averaged over 5 degree latitude and 30 degree longitude around the sites of interest. As can be seen there is a consistent difference with latitude, on average −4.4 K
over the measurement period. This is about the same as the zonal average temperature difference between the two lati-tudes (not shown). There is also some difference with longi-tude, +0.9 K over the measurement period. This means that the longitude of Wasa was somewhat warmer than the longi-tude of Davis for this period. Averaging over longer periods yields an average longitudinal difference close to zero as can be expected for traveling wave disturbances (not shown).
4 Discussion
4.1 Day-to-day variation of PMSE
The PMSE daily occurrence rates are, with our threshold of volume reflectivity above 10−15m−1, typically higher at
0 0.05 0.1 0.15 0.2 0.25 0.3 80
82 84 86 88 90
18 Jan to 5 Feb 2007
Occurrence frequency PMSE > 10−15 [m−1]
Altitude [km]
(a)
MARA Wasa Davis Wasa Quiet Davis Quiet
10−16 10−15 10−14 10−13 80
82 84 86 88 90
18 Jan to 5 Feb 2007
Average Volume Reflectivity [m−1]
Altitude [km]
(b)
00:000 06:00 12:00 18:00 00:00 0.1
0.2 0.3 0.4
Altitudes 82 − 88 km
Occurrence frequency PMSE > 10
−
1
5 [m
−
1 ]
Local Solar Time
(c)
00:00 06:00 12:00 18:00 00:00 10−17
10−16 10−15 10−14 10−13
Altitudes 82 − 88 km
Volume Reflectivity [m
−
1 ]
Local Solar Time
(d)
Fig. 4. The two upper panels show average altitude profiles of PMSE occurrence frequency (left) and PMSE volume reflectivity (right). The solid lines show the average for all days. Dashed lines show the average when days with unusually strong PMSE have been removed (see text for details). The two lower panels shows the average occurrence frequency (left) and the average volume reflectivity (right) in the altitude interval 82–88 km as a function of local solar time. Data from MARA Wasa are shown with a black line, data from Davis with a red line. Thick vertical bars indicate magnetic midnight at Wasa (black) and at Davis (red).
frost point then increases with a corresponding decrease in PMSE occurrence. During the second maximum in PMSE occurrence we once again see temperatures well below the frost point at Wasa in the 15:00 to 16:00 LST range. At Davis we see for the same time the lowest temperatures since the first maximum, but still above the frost point. Occurrence frequencies are also lower at Davis than at Wasa for this time. The generalday-to-day variation follows what can be expected from the measured mesopause conditions regarding temperature and frost point. The relation between mesopause temperature below the frost point and daily PMSE occur-rence frequency was found to be the same at the two sites.
Wasa and Davis are located at both different latitudes and different longitudes. Zonal mean temperatures observed with
MLS clearly decrease between the latitude of Davis and the latitude of Wasa. The temperature difference between the latitudes of Wasa and Davis for a restricted longitude in-terval around Wasa for our measurement period showed an average difference of−4.4 K If there are standing waves or
00:000 03:00 06:00 09:00 12:00 15:00 18:00 21:00 00:00 0.05
0.1 0.15 0.2 0.25 0.3 0.35 0.4
Local Solar Time
Standard deviation Occurrence frequency PMSE > 10
−
1
5 [m
−
1]
Wasa
Davis
Fig. 5. The standard deviation of the occurrence frequency in the altitude interval 82–88 km as a function of local solar time. Data from MARA Wasa are shown with a black line, data from Davis with a red line. Thick vertical bars indicate 19 magnetic local time at Wasa (black) and at Davis (red).
at Wasa and associated temperature difference between Wasa and Davis cannot be attributed to the different longitudes of the two observation sites. It is clear that it is the difference in latitude which is the most important factor.
Our observations therefore support the latitude depen-dence of the LIMA/ice model presented by L¨ubken and Berger (2007) which shows that mean temperatures should be lower and PMSE should be more frequent at Wasa than at Davis. The difference should be greatest at the start and the end of the PMSE season. In L¨ubken and Berger (2007) their Fig. 7, we can see that for the start of our PMSE ob-servations (i.e. 18 January) PMSE occurrence frequency in the LIMA/ice model was about 40% at the latitude of Davis and about 80% at the latitude of Wasa. We can therefore confirm that we indeed see differences between the two lat-itudes at the end of the PMSE season similar to those seen in the LIMA/ice model. The length of the season differs be-tween the model and our observations. One reason for this can be a year to tear difference. However, just as for the Davis radar data discussed in L¨ubken and Berger (2007) the end of strong PMSE and relatively high PMSE occurrence frequency at Davis coincide fairly well with the end of the season from the LIMA/ice model (i.e. at about 20 January).
There is also a clear tendency towards strong equatorward winds during extended periods of increased PMSE occur-rence, in accordance with previous findings (Morris et al., 2006, 2007). PMSE was typically associated with low tem-peratures as estimated from satellite data and equatorward meridional wind measured by MF radar. Also for winter con-ditions in 2002 Espy et al. (2003) have reported simultane-ous abrupt shifts in the OH nightglow temperature estimates at Rothera (67.6◦S) and Halley (75.6◦S) which were
associ-−10 −8 −6 −4 −2 0 2 4 6 8
0 0.05 0.1 0.15 0.2 0.25
MLS temperature − frostpoint [K]
PMSE occurrence frequency
Wasa Davis
Fig. 6. Scatter plot of temperature minus frost point from Aura MLS data, average of data points centered on 83 and 86 km altitude (x-axis [K]) and PMSE occurrence frequency (y-axis). Wasa data is shown with black circles, Davis with red triangles. Least square fits of a linear function are shown with solid lines. A thick black line indicates a fit to all the data.
ated with changes in the meridional flow as measured by the Rothera MF radar. Temperatures were lower for equatorward flow and the variations were interpreted as changes in the inter-hemispheric meridional jet and a corresponding modu-lation of the mesospheric descent and adiabatic heating rates over the polar region. The coincidence of PMSE minimum at both Davis and Wasa, increased temperature relative to the frost point, and reduced equatorward winds 22–27 January suggests an overall weakening of the mesospheric summer wind system during that time.
4.2 Diurnal distribution of PMSE
18/01 20/01 22/01 24/01 26/01 28/01 30/01 01/02 03/02 05/02 −10
−8 −6 −4 −2 0 2 4 6 8 10
Date
Temperature difference [K]
Temperature difference due to latitude and longitude difference
Latitude difference
Longitude difference
Fig. 7. Temperature difference between different sites due to lat-itude and longlat-itude difference. The black curve shows the MLS observed mesopause temperature difference between the Wasa site and a a site at the same longitude as Wasa and the same latitude as Davis. The red line shows the temperature difference between Wasa and a site at the same latitude as Wasa and the same longi-tude as Davis. MLS temperature data from three pressure levels corresponding to approximate altitudes of 83 to 89 km were used.
maps of the latitudinal and magnetic local time distribution of medium energy (30 keV–2.5 MeV) charged particle pre-cipitation likely to affect the mesopause region show that the precipitation can be expected to be very similar at the two sites (Codrescu et al., 1997), each site on different sides of the statistical maximum in electron precipitation. The mag-netic local time dependence of the precipitation is the same, with a minimum in charged electron precipitation in the after-noon between about 14:00 to 19:00 MLT. This agrees fairly well with the time of the deepest minimum in our data. The occurrence frequency starts to fall earlier than that, and at dif-ferent MLT but similar LST at the two sites. The daily vari-ation is large and clearly more data is needed before we can determine if the charged particle precipitation plays a role in the evening minimum in PMSE occurrence. The fact that the variability is lower in the evening minimum period is how-ever encouraging.
The similarity between the expected charged particle pre-cipitation at Wasa and Davis, and the difference in PMSE occurrence and strength, further emphasize the importance of the geographic latitude-dependent temperature and water vapor for the PMSE occurrence in general. The high latitude station will also have a somewhat more favorable solar zenith angle for the time of minimum charged particle precipitation, so that the difference in the evening minimum can be related to availability of an ionization source.
4.3 Altitude distribution of PMSE
Removing days which were extreme for the period of study, the difference in altitude distribution between the two sites is smaller than the general variability. This can be compared with lidar observation results compiled by Chu et al. (2003). Their survey of Northern Hemisphere observations showed that the mean altitude of polar mesospheric clouds in the Northern Hemisphere varied very little depending on latitude (mean altitudes between 81.8 and 83.4 km were reported for sites from 54◦N to the pole). Our observations also indicate
that the average altitude of PMSE is not strongly latitude de-pendent, but more data would certainly be needed before any firm conclusions can be made.
5 Conclusions
We have found that PMSE over Antarctica for the period 18 January to 5 February 2007 were generally stronger at the higher geographic latitude station Wasa, than at the lower geographic latitude site Davis. It has previously been shown that PMSE at Davis were weaker and less frequent than at a similar geographic latitude site in the Northern Hemisphere, Andenes (Latteck et al., 2007). It has also been shown that PMSE at the end of the PMSE season at the high latitude Southern Hemisphere station Wasa were similar to end of the season PMSE at Kiruna which is at a lower latitude in the Northern Hemisphere (Kirkwood et al., 2007). Our results tie these findings together by showing with truly simultane-ous measurements that we see more and stronger PMSE at the higher geographic latitude of Wasa than at Davis. We have also investigated the potential importance of the dif-ferent longitude of the two radar sites by looking at Aura MLS temperature data. It was found that the longitude re-gion around Wasa was on average 0.9 K warmer than the longitude region around Davis, so that longitude differences did not contribute to the higher PMSE occurrence at Wasa as compared to Davis.
Comparison with Aura MLS data of the temperature and the frost point indicated that the day-to-day variability in PMSE occurrence frequency, as well as the difference be-tween the two Antarctic sites, can largely be explained by differences in the mesopause temperature and water vapor content. For the interval 15:00 to 16:00 LST the relation between daily PMSE occurrence frequency and temperature minus frost point was the same at the two sites. The main reason for the latitude variation is thus a change in temper-ature and water vapor content with latitude for the particu-lar observation period reported here. The variation with lati-tude is in qualitative agreement with the latilati-tude variation of the LIMA/ice model, in particular for the end season of the PMSE.
followed by a clear evening minimum in PMSE occurrence frequency. Occurrence frequencies remained low for a longer time at Davis after the onset of the evening minimum. The occurrence frequency started to fall at about the same LST towards the values in the deepest part of the evening PMSE occurrence frequency minimum. The deepest part of the minimum started and ended at the same MLT, 15:00 to 19:00 MLT. This in turn is in agreement with a minimum in energetic charged particle precipitation likely to affect the mesopause region. More data will be needed to discriminate between LST and MLT influences on the diurnal variation. It is however encouraging that the variability of the PMSE oc-currence was low during the evening minimum and increased for both sites at the same MLT but at rather different LST.
The shapes of the altitude profiles for the conditions pre-vailing during the measurement period were rather similar. The shape differed at low altitudes, 82 km and below, with relatively more and stronger echoes at Wasa. For some more intense events, there was more PMSE at high altitude at Davis. The differences in the shapes of the altitude distri-butions were smaller than the general variability.
Acknowledgements. We thank Knut and Alice Wallenberg’s foun-dation for funding MARA, Swedish Polar Research Secretariat and the Davis MST radar technical support crew for technical assis-tance. Aura MLS data used in this study was distributed by Goddard Earth Sciences Data and Information Services Center Distributed Active Archive Center.
Topical Editor U.-P. Hoppe thanks R. F. Woodman and another anonymous referee for their help in evaluating this paper.
References
Balsley, B. B., Woodman, R. F., Sarango, M., Urbina, J., Rodriguez, R., Ragaini, E., and Carey, J.: Southern hemisphere PMSE: Where are they?, Geophys. Res. Lett., 20, 1983–1985, 1993. Chu, X., Gardner, C. S., and Roble, R. G.: Lidar studies of
in-terannual, seasonal and diurnal variation of polar mesosperic clouds at the South Pole, J. Geophys. Res., 108, 8447, doi:10.1029/2002JD002524, 2003.
Codrescu, M. V., Fuller-Rowell, T. J., Roble, R. G., and Evans, D. S.: Medium energy particle precipitation influences on the mesosphere and lower thermosphere, J. Geophys Res., 102, 19 977–19 987, 1997.
Espy, P. J., Hibbins, R. E., Jones, G. O. L., Riggin, D. M., and Fritts, D. C.: Rapid, large-scale temperature changes in the polar mesosphere and their relationship to meridional flows, Geophys. Res. Lett., 30, 1240, doi:10.1029/2003GL016452, 2003. Gage, K. S.: Radar observations of the free atmospher: Structure
and dynamics, in: Radar in Meteorology, edited by Atlas, D., pp. 534–565, Am. Meteorol. Soc., Boston, 1990.
Huaman, M. M., Kelley, M. C., Hocking, W. K., and Woodman, R. F.: Polar mesosphere summer echo studies at 51.5 MHz ar Resolute Bay, Canada: Comparison with Poker Flat results, Ra-dio Sci., 36, 1823–1837, 2001.
Kirkwood, S. and Stebel, K.: Influence of planetary waves on noc-tilucent cloud occurrence over NW Europe, J. Geophys. Res., 108, 8440, doi:10.1029JD002356, 2003.
Kirkwood, S., Barabash, V., Br¨andstr¨om, B. U. E., Mostr¨om, A., Stebel, K., Mitchell, N., and Hocking, W.: Noctilucent clouds, PMSE and 5-day planetary waves: a case study, Geophys. Res. Lett., 29, 1411, doi:10.1029/2001GL014022, 2002.
Kirkwood, S., Wolf, I., Nilsson, H., Dalin, P., Mikhaylova, D., and Belova, E.: Polar mesosphere summer echoes at Wasa,
Antarc-tica(73◦S): First observations and comparison with 68◦N,
Geo-phys. Res. Lett., 34, L15803, doi:10.1029/2007GL030516, 2007. Lambert, A., Read, W. G., Livesey, N. J., Santee, M. L., Manney, G. L., Froidevaux, L., Wu, D. L., Schwartz, M. J., Pumphrey, H. C., Jimenez, C., Nedoluha, G. E., Cofield, R. E., Cuddy, D. T., Daffer, W. H., J.Drouin, B., Fuller, R. A., Jarnot, R. F., Knosp, B. W., Pickett, H. M., Perun, V. S., Snyder, W. V., Stek, P. C., Thurstans, R. P., Wagner, P. A., Waters, J. W., Jucks, K. W., Toon, G. C., Stachnik, R. A., Bernath, P. F., Boone, C. D., Walker, K. A., Urban, J., Murtagh, D., Elkins, J. W., and Atlas, E.: Vali-dation of the Aura Microwave Limb Sounder middle atmosphere water vapor and nitrous oxide measurements, J. Geophys. Res., 112, D24S36, doi:10.1029/2007JD008724, 2007.
Latteck, R., Singer, W., Morris, R. J., Holdsworth, D. A., and
Murphy, D. J.: Observations of polar mesosphere summer
echoes with calibrated VHF radars at 69◦ in the Northern
and Southern hemispheres, Geophys. Res. Lett., 34, L14805, doi:10.1029/2007GL030032, 2007.
Latteck, R., Singer, W., Morris, R. J., Hocking, W. K., Murphy, D. J., Holdsworth, D. A., and Swarnalingam, N.: Similarities and differences of Polar Mesosphere Summer Echoes observed in the Arctic and Antarctica, Ann. Geophys., 26, 2795–2806, 2008, http://www.ann-geophys.net/26/2795/2008/.
L¨ubken, F. J. and Berger, U.: Interhemispheric comparison of meso-spheric ice layers from the LIMA model, J. Atm. Sol. Terr. Phys., 69, 2292–2308, doi:10.1016/j.jastp.2007.07.006, 2007. L¨ubken, F. J., M¨ullemann, A., and Jarvis, M.: Temperatures and
horizontal winds in the Antarctic summer mesosphere, J. Geo-phys Res., 109, D24112, doi:10.1029/2004JD005133, 2004a. L¨ubken, F. J., Zecha, M., H¨offner, J., and R¨ottger, J.:
Tem-peratures, polar mesosphere summer echoes, and noctilucent
clouds over Spitsbergen(78◦), J. Geophys Res., 109, D11203,
doi:10.1029/2003JD004247, 2004b.
Morris, J., Klekociuk, A. R., Latteck, R., Singer, W., Holdsworth,
D. A., and Murphy, D. J.: Inter-hemispheric
asymme-try in polar mesosphere summer echoes and temperature at
69◦ latitude, J. Atmos. Solar Terr. Phys., published online,
doi:10.1016/j.jastp.2008.09.042, 2008.
Morris, R. J., Murphy, D. J., Vincent, R. A., Holdsworth, D. A., Klekociuk, A. R., and Reid, I. M.: Characteristics of the wind, temperature and PMSE field above Davis, Antarctica, J. Atmos. Solar Terr. Phys., 68, 418–435, 2006.
Rapp, M. and L¨ubken, F.-J.: Polar mesosphere summer echoes (PMSE): Review of observations and current understanding, At-mos. Chem. Phys., 4, 2601–2633, 2004,
http://www.atmos-chem-phys.net/4/2601/2004/.
Schwartz, M. J., Lambert, A., Read, G. L. M. W. G., Livesey, N. J., Froidevaux, L., Ao, C. O., Bernath, P. F., Boone, C. D., Cofield, R. E., Daffer, W. H., J.Drouin, B., Fetzer, E. J., Fuller, R. A., Jarnot, R. F., Jiang, J. H., Knosp, B. W., Kr¨uger, K., Li, J.-L. F., Mlybcak, M. G., Pawson, S., III, J. M. R., Santee, M. L., Snyder, W. V., Stek, P. C., Thurstans, R. P., Tompkins, A. M., Wagner, P. A., Walker, K. A., Waters, J. W., and Wu, D. L.: Validation of the Aura Microwave Limb Sounder Temperature and Geopo-tential Height Measurements, J. Geophys. Res., 113, D15511, doi:10.1029/2007JD008783, 2008.
![Fig. 3. Davis MF radar wind data, running average over 1 day. The top panel shows the zonal wind and the bottom panel the meridional wind [m s −1 ], as a function of date (x-axis) and height (y-axis).](https://thumb-eu.123doks.com/thumbv2/123dok_br/18377148.355972/5.892.463.824.83.498/davis-radar-running-average-panel-meridional-function-height.webp)
![Fig. 6. Scatter plot of temperature minus frost point from Aura MLS data, average of data points centered on 83 and 86 km altitude (x-axis [K]) and PMSE occurrence frequency (y-axis)](https://thumb-eu.123doks.com/thumbv2/123dok_br/18377148.355972/7.892.69.426.96.366/scatter-temperature-average-points-centered-altitude-occurrence-frequency.webp)