*e-mail: [email protected]
1. Introduction
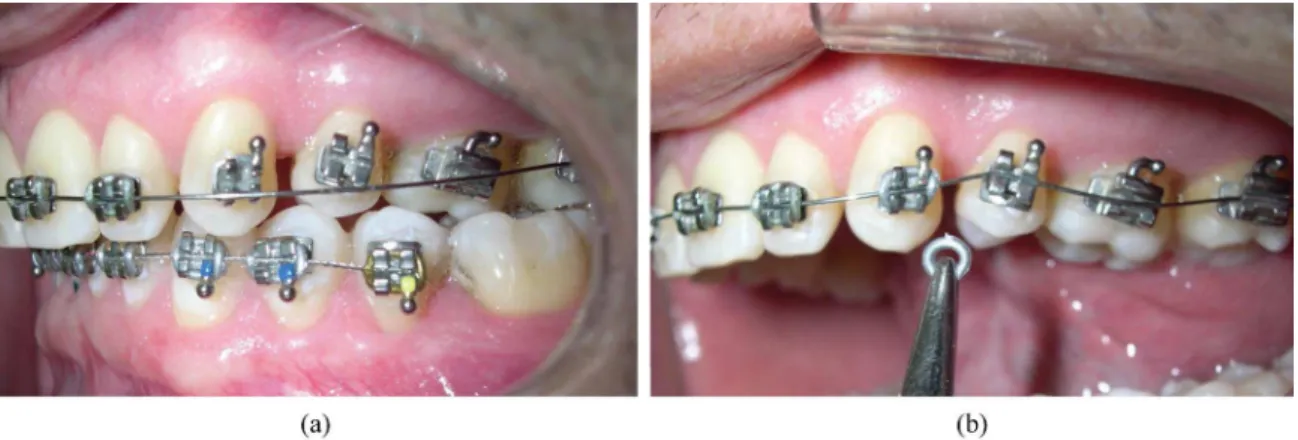
NiTi alloys are currently used for biomedical purposes because of their superelastic (SE) behavior, which can reach more than 10% strain during tension, the one way (1way) effect, good corrosion resistance and biocompatibility1. These properties lead to a wide use in many applications, such as medical implants, stents and orthodontic wires2. For orthodontic purposes, NiTi wires attend the requirements for an archwire performance, which include low elastic modulus, high lexibility, minimal plastic deformation, resistance to fatigue, good corrosion resistance and production of constant small forces over a wide range of displacements3. The promising values of strength and resilience have made it possible to reduce the number of archwire replacements during orthodontic treatments and consequently the frequency of clinical appointments. Figure 1 shows a clinical example of NiTi orthodontic wire application. Note the degree of misalignment and unleveling that the wire can tolerate due to superelastic properties.
It is common knowledge that shape memory and pseudoelasticity behavior are based on a thermoelastic martensitic transformation in which the phases for the binary alloy are a BCC austenite (B2), a trigonal R phase (intermediate martensitic phase) and monoclinic (B19) or orthorhombic martensite (B19’)4.
The martensitic transformation is an instantaneous thermoelastic irst-order crystalline displacive military process. During phase transformation, the atoms move cooperatively, often by a shear-like mechanism5. The
austenite to martensite transformation can be induced by cooling or loading. In the irst case, the austenite phase is more stable at high temperatures, while the martensite phase is more stable at low temperatures. This process can be described by a temperature dependent chemical energy which is different for austenite (cubic B2) and martensite (monoclinic B19’), but not for symmetry-related variants of the same phase6. The temperature at which martensitic transformation upon cooling begins is called Ms and the temperature at which the transformation ends is called Mf[7]. The temperature at which austenitic transformation begins upon heating is called As and the temperature at which the transformation ends is called Af. The R-phase is an intermediate phase with rhombohedral structure that can form during transformation from martensite to austenite on heating and reverse transformation (austenite to martensite) on cooling. The Rs and Rf temperatures for transformation involving the R-phase are deined in a similar manner. The irst-order transformation of NiTi alloy is responsible for the shape recovery ability demonstrated by the super/pseudoelasticity and shape memory effects, which are stress-induced and temperature-induced phase transformations, respectively8.
The stress-strain behavior of a NiTi archwire under constant temperature (above Af) is schematically shown in Figure 2. The material follows two different paths during loading and unloading. The mechanical hysteresis is related to the difference between the loading and unloading stress plateaus where energy is dissipated or absorbed6. The phase transformation can be followed by considering some particular points in the stress versus strain curve shown in Figure 2.
Mechanical Performance of Nickel-titanium Archwires
Daniel Jogaib Fernandesa,b*, Carlos Nelson Eliasa, Rafael Vidala, Alvaro de Moraes Mendesb
aLaboratory of Biomaterials, Instituto Militar de Engenharia – IME, CEP 22290-270, Rio de Janeiro, RJ, Brazil
bSchool of Dentistry, Universidade do Estado do Rio de Janeiro – UERJ,
CEP 20551-030, Rio de Janeiro, RJ, Brazil
Received: August 4, 2015; Revised: September 25, 2015
The purpose of the present work is to compare the mechanical properties of commercially available NiTi orthodontic archwires lots. Superelastic (SE) and heat-activated (HA) NiTi archwires from two lots of six manufacturers (3M, GAC, Tp, Orthosource, Orthometric and Morelli) were partitioned into eleven groups (n=132) and tested under three-point bending tests. The difference between the highest (151.35 gf, Tp) and lowest (98.43 gf, 3M) unloading stresses among SE groups was 53.77% (p<.05), while the difference between Tp and Orthosource HA group was 168.20% (p<.05). Between same manufacturer lots, Tp SE showed the highest average unloading stress difference (50.7%) while GAC SE disclosed the lowest difference (0.25%) at p<.05. HA wires showed better mechanical properties than SE wires, however there was no evidences of shape memory effect. Matches were seen between SE and HA from different and same manufacturers (p>.05), whereupon there are equivalences in wires commercial offered at different costs.
At point A, the material is completely austenitic and has a BCC structure (B2). In the loading plateau (B-C), stress-induced martensite is formed by shear between a high-symmetry parent phase (austenite) and a low-symmetry product phase (martensite), resulting from a monoclinic distortion of a B19’ lattice9. If loading continues, martensite can assume a predominantly monovariant form (points E and F) while austenite domains undergo a dislocation slip to accommodate the transformation strain10. Nevertheless, a small amount of plastic strains remains and is accumulated during the different loading-unloading cycles, until the alloy recovery ability is deteriorated, in many cases due to dislocation motion and glide9. Stresses beyond point F can produce deformation of the martensite until plastic yielding is induced. During unloading, the plateau occurs at a lower stress level (G-D) due to the mechanical hysteresis phenomenon and the transformation is reversed and martensite returns to austenite along the previous crystallographic route to austenite.
Commercial NiTi alloys for orthodontic applications are superelastic (austenitic) or heat activated (martensitic) at mouth temperature; orthodontic wires available are predominantly superelastic once the mouth temperature, even in heat activated (HA) wires, could be not suficient to provide enough energy to revert crystallographic transformation from monoclinic state. Besides that, considering the superelasticity may not exhibit a clearly discernible unloading plateau when testing in bending, the objective of this study is to evaluate the loading/unloading behavior under bending of six brands of superelastic and heat activated orthodontic archwires and compare their performance.
2. Material and Methods
NiTi orthodontic archwires from 3M (3M Unitek, Monrovia, CA, USA), GAC (Dentsply GAC International, Bohemia, NY, USA), Tp (LaPorte, IN, USA), Orthosource
Figure 1. Superelastic NiTi 0.014-inch during initial alignment orthodontic stage, before (left) and after (right) bracket engagement. Note the degree of misalignment that the wire can tolerate due to superelastic properties.
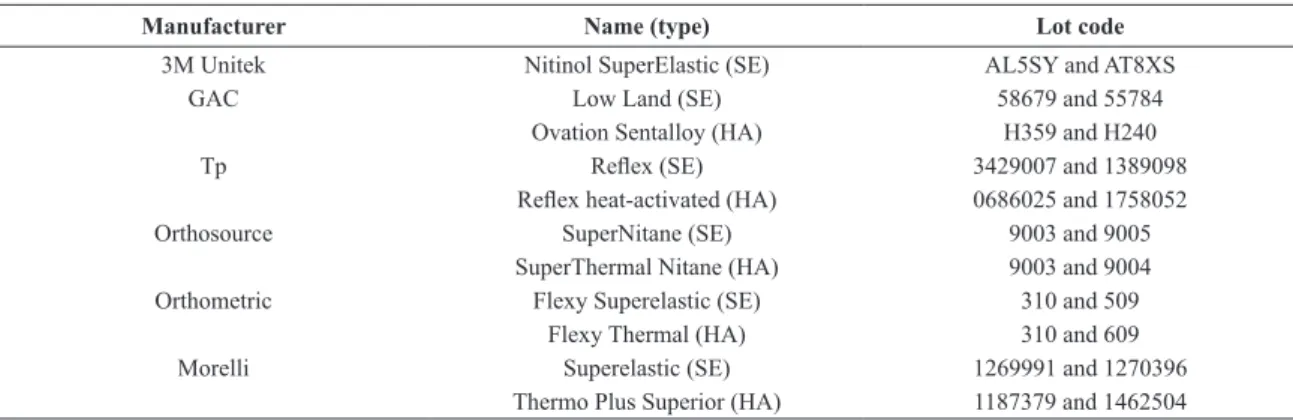
(Sc) (North Hollywod, CA, USA), Orthometric (Mt) (Marilia, SP, Brazil) and Morelli (Mo) (Sorocaba, SP, Brazil) were tested. Two lots of each type (SE and HA) orthodontic archwires from each brand designated by the companies as superelastic and heat-activated. Specimens with 0.014-in diameter and 30 mm length were cut from the straighter section of the arch. Twenty two groups with 6 specimens each one were tested under 3-point bending tests. Table 1 shows the description of the samples (manufacturer, commercially wire name, type and lot code).
The three-point bending tests were carried out with an Emic DL10000 universal testing machine (Emic Co, São José dos Pinhais, PR, Brazil) itted with a 10 N load cell. The machine was operated at a crosshead speed of 6.0 mm/minute and the fulcrum and cutlass radii were 0.1 mm, as shown in Figure 3. The distance between the supports was 10 mm and tests were performed in lexion until a delection of 3.1 mm at 37 °C was reached, which is in accordance with ISO 15841:2014[11]. Heating was provided by a light bulb controlled by a rheostat, as shown in Figure 3. Residual delection was measured after unloading by the universal testing machine.
The strength (N) versus delection (mm) curves were
compared using the width of the loading and unloading
plateaus (distance between points B-C and D-G, respectively), as shown in Figure 2. Load and unload mean forces were calculated from the different values that made up the load and unload plateaus showed in Figure 2. These mean values were used for load and unload mean stress calculations, using the equation presented in results section.
The results were analyzed using the software Graphpad Prism version 5.0 (Graphpad Software Inc, La Jolla, CA, USA). Analysis of variance (one-ANOVA) and Tukey post hoc analysis were used to compare the average stress and force in the loading and unloading plateaus.
3. Results
Table 2 shows the average loading and unloading stress and force between points B and C (loading plateau) and between D and G (unloading plateau). The stress was computed using the Equation 1:
. ³
2 55FL d
=
σ (1)
where σ is the stress, F is the average bending force in the plateau, L (10 mm) is the distance between the supports (fulcrum) and d (0.014 inch) is the archwire diameter.
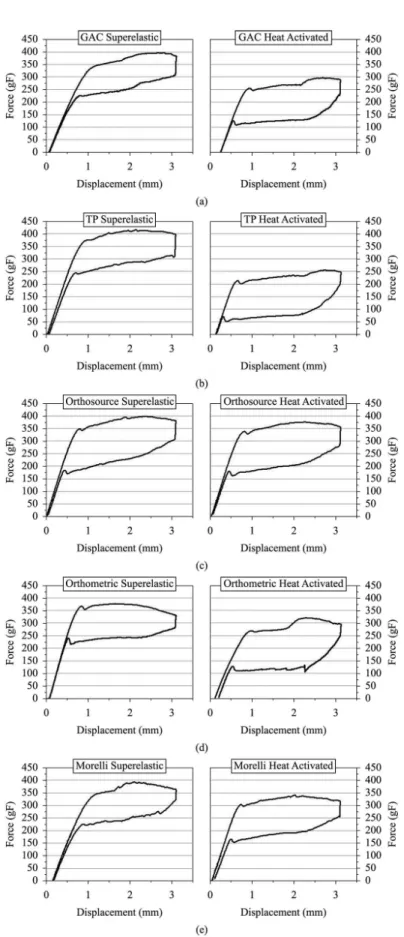
Figure 4 shows that the loading stress is higher than the average stress for all samples. In the case of clinical applications, the most important is the unloading plateau, which relects the force that is effectively applied to the teeth.
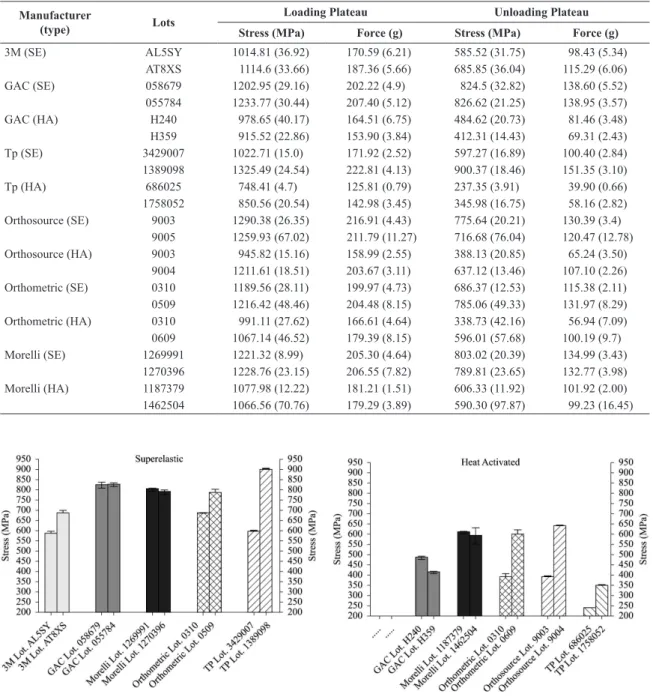
Comparing the loading and unloading stresses (Table 2) it is possible to observe that the Tp lot 1389098 archwires showed the highest stress during loading (1325.49 + 24.54 MPa). The difference in SE between the highest (900.37 + 18.46 MPa, Tp) and lowest (585.52 + 31.75 MPa, 3M) unloading stresses among the 11 groups was 53.77%, while the difference between HA group was 168.20%. The fact that this difference is very high means that it is dificult to apply an adequate force to the teeth during an orthodontic treatment.
Comparing the behavior of several lots from the same manufacturer, it is observed that there are signiicant differences between lots of the same manufacturer (Figure 5). The average unloading stress of Tp SE wire showed the highest difference between lots (50.7%), which means that Tp showed the highest heterogeneity behavior. The GAC
Table 1. Description of NiTi wires used in this work.
Manufacturer Name (type) Lot code
3M Unitek Nitinol SuperElastic (SE) AL5SY and AT8XS
GAC Low Land (SE) 58679 and 55784
Ovation Sentalloy (HA) H359 and H240
Tp Relex (SE) 3429007 and 1389098
Relex heat-activated (HA) 0686025 and 1758052
Orthosource SuperNitane (SE) 9003 and 9005
SuperThermal Nitane (HA) 9003 and 9004
Orthometric Flexy Superelastic (SE) 310 and 509
Flexy Thermal (HA) 310 and 609
Morelli Superelastic (SE) 1269991 and 1270396
Thermo Plus Superior (HA) 1187379 and 1462504
Figure 4. Load/delection curves of 0.014’ NiTi Superelastic and Heat-Activated archwires until 3.1 mm delection at 37 °C. Manufacturers
Table 2. Means (standard deviation) of loading and unloading stress (MPa) and force (g) for 3.1 mm delection of superelastic (SE) and
heat-activated (HA) NiTi 0.014-in inch orthodontic archwires.
Manufacturer
(type) Lots
Loading Plateau Unloading Plateau
Stress (MPa) Force (g) Stress (MPa) Force (g)
3M (SE) AL5SY 1014.81 (36.92) 170.59 (6.21) 585.52 (31.75) 98.43 (5.34)
AT8XS 1114.6 (33.66) 187.36 (5.66) 685.85 (36.04) 115.29 (6.06)
GAC (SE) 058679 1202.95 (29.16) 202.22 (4.9) 824.5 (32.82) 138.60 (5.52)
055784 1233.77 (30.44) 207.40 (5.12) 826.62 (21.25) 138.95 (3.57)
GAC (HA) H240 978.65 (40.17) 164.51 (6.75) 484.62 (20.73) 81.46 (3.48)
H359 915.52 (22.86) 153.90 (3.84) 412.31 (14.43) 69.31 (2.43)
Tp (SE) 3429007 1022.71 (15.0) 171.92 (2.52) 597.27 (16.89) 100.40 (2.84)
1389098 1325.49 (24.54) 222.81 (4.13) 900.37 (18.46) 151.35 (3.10)
Tp (HA) 686025 748.41 (4.7) 125.81 (0.79) 237.35 (3.91) 39.90 (0.66)
1758052 850.56 (20.54) 142.98 (3.45) 345.98 (16.75) 58.16 (2.82)
Orthosource (SE) 9003 1290.38 (26.35) 216.91 (4.43) 775.64 (20.21) 130.39 (3.4)
9005 1259.93 (67.02) 211.79 (11.27) 716.68 (76.04) 120.47 (12.78)
Orthosource (HA) 9003 945.82 (15.16) 158.99 (2.55) 388.13 (20.85) 65.24 (3.50)
9004 1211.61 (18.51) 203.67 (3.11) 637.12 (13.46) 107.10 (2.26)
Orthometric (SE) 0310 1189.56 (28.11) 199.97 (4.73) 686.37 (12.53) 115.38 (2.11)
0509 1216.42 (48.46) 204.48 (8.15) 785.06 (49.33) 131.97 (8.29)
Orthometric (HA) 0310 991.11 (27.62) 166.61 (4.64) 338.73 (42.16) 56.94 (7.09)
0609 1067.14 (46.52) 179.39 (8.15) 596.01 (57.68) 100.19 (9.7)
Morelli (SE) 1269991 1221.32 (8.99) 205.30 (4.64) 803.02 (20.39) 134.99 (3.43)
1270396 1228.76 (23.15) 206.55 (7.82) 789.81 (23.65) 132.77 (3.98)
Morelli (HA) 1187379 1077.98 (12.22) 181.21 (1.51) 606.33 (11.92) 101.92 (2.00)
1462504 1066.56 (70.76) 179.29 (3.89) 590.30 (97.87) 99.23 (16.45)
Figure 5. Mean stress (MPa) on the unloading plateau at 3.1 mm delection of superelastic and heat activated NiTi 0.014-in inch from
different orthodontic archwires lots.
SE showed the lowest difference between lots (0.25%) and the best homogeneity behavior.
Table 3 shows the residual strain after 3-point bending tests. The residual strain is very low, which means that at 37 °C and delection until 3.1 mm the wires recover their shapes.
Statistical multiple comparisons were performed by Tukey test and matches (p>.05) between groups from different manufacturer, wire type and commercial lot are presented on Tables 4-8. These tables provide easy observation of the equivalence in mechanical behavior of different wires groups as well as a combination of different mechanical
features in order to achieve a more robust comparison upon possible matches from different wires. Matches in wires from different type and assorted manufacturers, different type and same manufacturer and different lots from same company were also disclosed.
3.1. Effect of type of wire on load/unloading
mean values
Table 3. Average residual strain (standard deviation - SD) of the superelastic (SE) and heat-activated (HA) NiTi 0.014-in inch orthodontic archwires tested.
Wires (type) Lot code Residual delection (mm) SD
3M (SE) AL5SY 0.044 0.008
AT8XS 0.032 0.017
GAC (SE) 58679 0.103 0.083
55784 0.014 0.099
GAC (HA) H240 0.051 0.077
H359 0.023 0.019
Tp (SE) 3429007 0.025 0.008
1389098 0.045 0.022
Tp (HA) 686025 0.018 0.010
1758052 0.058 0.089
Orthosource (SE) 9003 0.052 0.009
9005 0.029 0.012
Orthosource (HA) 9003 0.027 0.007
9004 0.017 0.013
Orthometric (SE) 310 0.064 0.042
509 0.064 0.085
Orthometric (HA) 310 0.065 0.048
609 0.109 0.084
Morelli (SE) 1269991 0.028 0.008
1270396 0.032 0.005
Morelli (HA) 1187379 0.040 0.011
1462504 0.057 0.031
Table 4. Load mean stress comparison among different groups and commercial lots by Tukey test (p=0.05).
Load Mean Stress
3M SE 1 3M SE 2 GAC SE 1 GAC SE 2 GAC HA
1
GAC HA
2
Tp SE 1 Tp SE 2 Tp HA
1
Tp HA
2
Sc SE 1 Sc SE 2 Sc HA
1
Sc HA
2
Mt SE 1 Mt SE 2 Mt HA
1
Mt HA
2
Mo SE 1 Mo SE 2 Mo HA
1
Mo HA
2
3MSE1 - 0 ** * ** ** ** ** **
3MSE2 0 - ** ** **
GACSE1 - - - X * * ** * * * *
GACSE2 - - X - * ** * * * *
GACHA1 - - - - - X ** * *
GACHA2 - - - - X - * *
TpSE1 - - - - 0 * *
TpSE2 - - - 0 - ** ** ** **
TpHA1 - - - - 0
TpHA2 - - - 0
-ScSE1 - - - - X * * ScSE2 - - - X - *** * * * * ScHA1 - - - - 0 *
ScHA2 - - - 0 - ** ** ** **
MtSE1 - - - - X * * MtSE2 - - - X - * * MtHA1 - - - - 0
MtHA2 - - - 0 - ** **
MoSE1 - - - - X
MoSE2 - - - X
-MoHA1 - - - - X
MoHA2 - - - X
Table 5. Unload mean stress comparison among different groups and commercial lots by Tukey test (p=0.05).
Unload Mean Stress
3M SE 1 3M SE 2 GAC SE 1 GAC SE 2 GAC HA
1
GAC HA
2
Tp SE 1 Tp SE 2 Tp HA
1
Tp HA
2
Sc SE 1 Sc SE 2 Sc HA
1
Sc HA
2
Mt SE 1 Mt SE 2 Mt HA
1
Mt HA
2
Mo SE 1 Mo SE 2 Mo HA
1
Mo HA
2
3MSE1 - 0 ** * ** ** **
3MSE2 0 - * * * ** * *
GACSE1 - - - X * * * * * * *
GACSE2 - - X - * ** * * *
GACHA1 - - - - - X ** ** ** **
GACHA2 - - - - X - * * **
TpSE1 - - - - 0 * *
TpSE2 - - - 0 - ** ** ** **
TpHA1 - - - - 0
TpHA2 - - - 0 - * *
ScSE1 - - - - X * * * ScSE2 - - - X - *** * * * * ScHA1 - - - - 0 *
ScHA2 - - - 0 - ** * ** **
MtSE1 - - - - X * * MtSE2 - - - X - * * MtHA1 - - - - 0
MtHA2 - - - 0 - ** **
MoSE1 - - - - X MoSE2 - - - X -MoHA1 - - - - X MoHA2 - - - X -Matches (p>.05) were from SE-SE and TA-TA (*), SE-TA from different (**) and same (***) manufacturer. Lots comparison from same brand were (0) revealing diferences (p<.05) and (X) similarities (p>.05). Manufacturers were 3M/UNitek(3M), GAC, Tp, Orthosource (Sc), Orthometric (Mt) and Morelli (Mo). Table 6. Total resilience comparison among different groups and commercial lots by Tukey test (p=0.05). Total Resilience 3M SE 1 3M SE 2 GAC SE 1 GAC SE 2 GAC HA 1 GAC HA 2 Tp SE 1 Tp SE 2 Tp HA 1 Tp HA 2 Sc SE 1 Sc SE 2 Sc HA 1 Sc HA 2 Mt SE 1 Mt SE 2 Mt HA 1 Mt HA 2 Mo SE 1 Mo SE 2 Mo HA 1 Mo HA 2 3MSE1 - 0 * ** ** ** 3MSE2 0 - * ** * ** ** ** ** GACSE1 - - - X ** * * * * ** ** GACSE2 - - X - * * * ** ** GACHA1 - - - - - 0 ** * * *
GACHA2 - - - - 0 - * *
TpSE1 - - - - 0 * *
TpSE2 - - - 0 - ** ** **
TpHA1 - - - - 0
TpHA2 - - - 0 - *
ScSE1 - - - - X *** * ScSE2 - - - X - *** * ScHA1 - - - - 0 * *
ScHA2 - - - 0 - ** ** ** **
MtSE1 - - - - X * *
MtSE2 - - - X - * *
MtHA1 - - - - X *
MtHA2 - - - X - ** **
MoSE1 - - - - X *** ***
MoSE2 - - - X - ***
MoHA1 - - - - X
MoHA2 - - - X
Table 7. Potential resilience comparison among different groups and commercial lots by Tukey test (p=0.05).
Potential Resilience
3M SE 1 3M SE 2 GAC SE 1 GAC SE 2 GAC HA
1
GAC HA
2
Tp SE 1 Tp SE 2 Tp HA
1
Tp HA
2
Sc SE 1 Sc SE 2 Sc HA
1
Sc HA
2
Mt SE 1 Mt SE 2 Mt HA
1
Mt HA
2
Mo SE 1 Mo SE 2 Mo HA
1
Mo HA
2
3MSE1 - 0 * * ** **
3MSE2 0 - * * ** * ** ** **
GACSE1 - - - X * * ** * * * *
GACSE2 - - X - * * ** * * * *
GACHA1 - - - - - 0
GACHA2 - - - - 0 - * * *
TpSE1 - - - - 0
TpSE2 - - - 0 - ** ** **
TpHA1 - - - - 0
TpHA2 - - - 0 - * *
ScSE1 - - - - X * * * ScSE2 - - - X - *** * * * * ScHA1 - - - - 0 *
ScHA2 - - - 0 - ** ** **
MtSE1 - - - - 0 * **
MtSE2 - - - 0 - * *
MtHA1 - - - - 0
MtHA2 - - - 0 - ** **
MoSE1 - - - - X MoSE2 - - - X -MoHA1 - - - - X MoHA2 - - - X -Matches (p>.05) were from SE-SE and TA-TA (*), SE-TA from different (**) and same (***) manufacturer. Lots comparison from same brand were (0) revealing diferences (p<.05) and (X) similarities (p>.05). Manufacturers were 3M/UNitek(3M), GAC, Tp, Orthosource (Sc), Orthometric (Mt) and Morelli (Mo). Table 8. Hysteresis resilience comparison among different groups and commercial lots by Tukey test (p=0.05). Hysteresis Resilience 3M SE 1 3M SE 2 GAC SE 1 GAC SE 2 GAC HA 1 GAC HA 2 Tp SE 1 Tp SE 2 Tp HA 1 Tp HA 2 Sc SE 1 Sc SE 2 Sc HA 1 Sc HA 2 Mt SE 1 Mt SE 2 Mt HA 1 Mt HA 2 Mo SE 1 Mo SE 2 Mo HA 1 Mo HA 2 3MSE1 - X * * ** ** * * * * ** * * ** ** 3MSE2 X - * * * * * ** * * GACSE1 - - - X * * * ** * * GACSE2 - - X - * * * ** * * GACHA1 - - - - - X * * ** ** * * ** ** * * * GACHA2 - - - - X - ** * * ** ** * ** ** * * * TpSE1 - - - - X * * ** * * ** ** TpSE2 - - - X - * ** * * TpHA1 - - - - X ** ** * * ** * * TpHA2 - - - X - ** ** * * ** * * ScSE1 - - - - X *** * * ** ** ** ScSE2 - - - X - *** *** * ** ** ScHA1 - - - - X ** * ScHA2 - - - X - ** * MtSE1 - - - - 0 *** ** **
MtSE2 - - - 0 - ** * * ** **
MtHA1 - - - - 0
MtHA2 - - - 0 - ** * *
MoSE1 - - - - X
MoSE2 - - - X
-MoHA1 - - - - X
MoHA2 - - - X
and the amount of energy represented by the three kinds (total, potential and hysteresis) of resilience proposed in this work.
Table 2 shows the mean values (stress and force) of loading and unloading plateau from different brands and lots of SE and HA archwires, whereas statistical differenced regarding this two parameters are revealed in Tables 4 and 5.
3.2. Total, potential and hysteresis resilience
Tables 6-8 show statistical matching between the energy regarding the area below curves in load plateau (total), unloading plateau (potential) and difference regarding total and potential (hysteresis resilience) resiliencies.
These trends upon SE and HA archwires described above are seen in the load/delection curves presented in Figure 4a-e, where the energy assorted in the three types of resilience from the two types of wires are disclosed.
4. Discussion
When a wire segment is engaged inside the bracket’s slot, an amount of force extend arises from the delection of the material, whereas the stress is suficient to provide the initial energy necessary to initiate a phase transformation represented by stress induced martensite in general austenitic superelastic wires. In fact, in shape memory alloys, this stress is represented by the loading plateau and exactly reveals the amount of stress, which is maintained inside bracket slot.
Surprisingly, when analyzing the comparisons emerged from Table 4, there are some equivalences between SE and HA wires from different brands and even from the same manufacturer. This inding is in the opposite direction of what is expected upon the HA wires. This state of NiTi alloys is supposed to be in predominant martensite state in order to resort the reduced Young modulus of this phase, which could allow a full bracket/wire engagement with lower stress even in cases of severe misalignment. Loading mean stress matches (Table 4) could be the irst evidence of the absence of shape memory effect in the HA NiTi archwires evaluated.
Regarding the statistical comparisons of unloading plateau mean stress from Table 5, there are also some equivalence in SE and HA wires from different brands and one from the same manufacturer. Unload mean stress (Table 5) represents the residual stress not consumed by hysteresis phenomenon, being the amount of stress which is transmitted to tooth after wire activation during orthodontic appointments. Equivalences between SE and HA are not expected because the shape memory effect addressed to HA by manufacturers should be able to release stress just upon the energy absorption by alloy due to intraoral environment heating. Figure 4 reveals that the real mechanical behavior of HA wires is a quite far away from a real shape memory effect, addressed by manufacturers. Moreover, there is no reason to expect the effectiveness of processing routes, believed to maintain Ms temperature able to be activated by oral temperature. Just a mild enhancement in mechanical properties was observed in the loading/delection curves when compared with SE wires. This fact is in accordance with conclusions of Lombardo et al. who observed lighter forces and longer plateau from HA wires12.
Herein the force delivery during unloading, comparing the force considered suitable for clinical purposes described in orthodontic journals, Gatto et al.13 showed values between 60-100g when comparing different manufacturers, Bartzela et al.14 presented an interval between 139-239g and Lombardo et al.15 disclosed values between 78.4-109.6g[13-15]. All the authors tested different manufacturers of superelastic orthodontic .014’archwires, with exception of Bartzela et al. who tested a .016’round wire. Although the effort to compare manufacturers and mechanical test parameters, none of the authors followed the 3.1 mm delection stated by the ISO 15841. The literature reports compare wire from different manufacturer, but we do not have reports among lots from the same manufacturer.
Despite there is not a clear statement of the optimal force delivered to ensure an eficient orthodontic movement13, the interval of different lots described in the present work (104.8-161.1g = 102.7-157.8cN) is a little higher but still in accordance with literature results described above (60-239g = 58.8-234.2cN). The difference should be credited to divergences in the delection maximum value, crosshead speed and span, which did not observe the recommendation of ISO 15841 or due to differences in the material behavior provided by different manufacturers and commercial available lots.
One of the most important properties regard the ability of the wire in releasing forces, is resilience. Authors propose by this work, three kinds of resilience and it depends on which stage NiTi wire is submitted. During loading, a plateau is deined by the constant stress maintained during martensitic transformation when the wire is engaged in bracket slot. The amount of energy graphically represented by the area limited on the loading plateau is deined as total resilience. It is well known that SMA can delivery stress under lower levels, because of the friction between slip planes which result in energy consumption determined by hysteresis phenomenon. This energy is deined as hysteresis resilience. The third type of resilience is represented by the energy truly available during unloading, which is called as potential resilience and is represented by the area below unloading plateau.
has not been found in literature. Another innovation of this work is the effort to deine resilience based on the amount of energy generated after the different stages identiied in stress-delection curves.
Signiicant variations in the bending properties between lots of the same manufacturers were seen at least in one of the properties evaluated of the ive manufacturers. Differences in lots from the same manufacturers were observed in Load Mean Stress between 3M (SE), Tp (SE and HA), Sc (HA), Mt (HA); Unload Mean Stress between 3M (SE), Tp (SE and HA), Sc (HA), Mt (HA); Total Resilience between 3M (SE), GAC (HA), Tp (SE and HA), Sc (HA); Potential Resilience between 3M (SE), GAC (HA), Tp (SE and HA), Sc (HA), Mt (SE and HA) and Hysteresis Resilience just between Mt SE and HA lots (Tables 4-8) This is probably due to a poor standardization of the methods of thermomechanical treatment. Figure 5 and Table 2 show that the highest differences between lots from the same manufacturer (intergroups) were seen during unloading in HA groups, which Orthometric exhibited difference of 75.95% between lots, followed by Orthosource HA with difference of 64.16% and Tp with 45.76%. During loading, Orthosource showed difference of 28.10% between lots, followed by Tp with difference of 13.64% and GAC with 6.89%. In SE groups, Tp groups showed a difference of 50.74% between lots during unloading and 29.6% during loading, 3M groups exhibited a difference of 17.12% during loading and 9.83%
on loading, Orthometric presented differences of 14.37% during unloading and 2.25% on loading tests. The most uniform mechanical properties were from GAC SE during unloading (0.25%) and Morelli HA during loading (1.07%).
According to the values of standard deviation of the unloading force in the clinical plateau in the same group, Orthometric SE lot 310 showed the highest intragroup homogeneity (std deviation = 2.11 g,) and Morelli HA lot 1462504 showed the lowest homogeneity (std deviation = 16.45g). This results show that quality control during thermomechanical treatment of NiTi alloys is very important.
In superelastic wires, thermomechanical treatment (training) of the alloy is necessary in order to recover the shape of the parent phase. One of the principles behind all thermomechanical process is the production of internal stress ields that resemble the same type of martensite variants during transformation that were generated during training9. The stress can be created by mechanisms such as dislocation arrays resulting from the thermomechanical treatment. The results should be retention of the martensite, some point defects, aligned coherent precipitates or a stabilized stress induced martensite8,9. Fine and coherent Ni
4Ti3 precipitates formed during aging of Ni-rich NiTi alloys affect the transformation sequence, the transformation temperature and even the mechanical properties of the alloy2. All of these mechanisms may contribute to the differences seen in this work, even in lots trained by the same manufacturers, since industrial
Table 9. Mechanical hysteresis comparison among different groups and commercial lots by Tukey test (p=0.05).
Mechanical hysteresis
3M SE 1 3M SE 2 GAC SE 1 GAC SE 2 GAC HA
1
GAC HA
2
Tp SE 1 Tp SE 2 Tp HA
1
Tp HA
2
Sc SE 1 Sc SE 2 Sc HA
1
Sc HA
2
Mt SE 1 Mt SE 2 Mt HA
1
Mt HA
2
Mo SE 1 Mo SE 2 Mo HA
1
Mo HA
2
3MSE1 - X * ** ** * ** ** * * * * ** * * ** **
3MSE2 X - * * ** ** * * ** ** * * * * ** * * ** **
GACSE1 - - - X * * * * *
GACSE2 - - X - * * * * *
GACHA1 - - - - - X * * ** ** ** ** * ** ** * *
GACHA2 - - - - X - ** * * ** ** * ** * ** * *
TpSE1 - - - - X * * *
TpSE2 - - - X - * * *
TpHA1 - - - - X ** ** * ** * ** * *
TpHA2 - - - X - ** ** ** ** * ** ** * *
ScSE1 - - - - X *** * ** * ** **
ScSE2 - - - X - *** * ** * ** **
ScHA1 - - - - X *
ScHA2 - - - X - ** *
MtSE1 - - - - 0 *** * ** **
MtSE2 - - - 0 - ** * * ** **
MtHA1 - - - - 0
MtHA2 - - - 0 - ** ** * *
MoSE1 - - - - X
MoSE2 - - - X - *** **
MoHA1 - - - - X
MoHA2 - - - X
producers have their own empirical assumptions about the effects of cold working on mechanical performance and transformation behavior. Others variables might be the temperature of the thermomechanical cycles, the annealing conditions, the stress mode, grain size and microstructure9.
In heat-activated wires, the thermomechanical treatment has the same relevance as in superelastic wires, once both superelastic and shape memory properties are optimized by cold-working and heat treatment. Analyzing the delection curves of heat-activated groups, it is dificult to presume that the shape memory effect exists. According to manufacturers, HA wires are able to perform a smart feature during unloading from which the original shape memorized could be reached after full bracket engagement. However, this condition is associated with martensite state and stress curve for T<Mf presents a loading plateau with less stress than an SE loading one, over a much larger strain range during which energy should be necessary to reverse thermal martensite. This shape of the stress curve was not veriied for the HA wires evaluated at intraoral temperature whereas Mf should be stayed above room temperature to ensure T<Mf during full bracket engagement. Even though HA wires were stored, for few moments, in refrigerator, before clinical appointment, there should be not enough time to engage all brackets before predominant thermal martensite was reversed. The curves observed for HA wires are more similar to an improved superelasticity involving stress induced transformation followed by strain recovery rather than a shape memory effect associated with thermal martensite.
The maximum archwire delection adopted in this work was 3.1 mm and is in accordance with ISO 15841:2006[16]. Different wire delections were reported in literature up to 5 mm; some authors have used delections between 2 mm and 4 mm and it was stated that although these values were greater than the 5% delection limit for the span length used, they reproduce the clinical use of the material and are regularly used in the oral environment3-10,13,14,17,18. Mallory et al.19 reported that during 5-mm deactivation of all heat activated wires, there was a sharp decline in force production. The authors attributed this phenomenon to a possible inability of the martensitic transformation to be reverted under a severe delection coupled with a lack of enough heat19. Besides following the ISO standard, the delection of 3.1 mm stayed in 2-4 mm range and should represent a feasible level of delection for clinical applications. Since the span length used was 10 mm, if the 5% limit was obeyed, a delection of only 0.5 mm would be used. In that case, however, not enough stress induced martensite would formed and the superelastic behavior would not be seen in the stress-strain curves. This consideration is conirmed by previous works20,21.
In all curves of the present work, a plateau was observed during unloading and it means that all wires presented superelastic behavior, even in HA groups. Although the transformation temperature was not tested, the temperature of the bending testing was maintained stable at 37 °C. This baseline portrays in SE groups, a limit where transformation from the R-phase to austenite is half complete22. In this condition (T>Af or As<T<Af), the material is nearly austenite and becomes partially martensite when the load is applied since
shear occurs between a high-symmetry parent phase with the BCC structure and a low-symmetry product (stress induced martensite). When the material is unloaded, martensite becomes unstable and the transformation is reverted along the crystallographic route to austenite. The unloading plateau is characterized by a horizontal region where a constant force is exerted over a particular range of tooth movements. This is called superelasticity and is responsible for many of the applications of this alloy for biomedical purposes.
Permanent strain of NiTi can occur when the stress necessary to produce stress martensite is higher than the level at which plastic yielding is induced. Beyond this limit, deformation of the stress induced martensite continues until elastic and then plastic yielding comes true by dislocation mechanisms. This prevents the reversible route to austenite and has clinical relevance for teeth alignment and leveling. A permanently delected wire is not able to delivery forces and has to be replaced. In this work (Table 3), permanent strain was irrelevant for all groups evaluated since all specimens showed a shape recovery to 99% of its original shape. Similar results were presented by Lombardo et.al even when 4-mm bending was performed at 55 °C[12].
The archwire resistance to attachment into bracket slots and intensity force delivery to teeth on unloading are mechanical factors that affect the tooth movement. Although there is no evidence that orthodontic inlammatory root resorption may be caused by the sequential use of different archwires, there is a clear relation between type (continuous
vs. intermittent) and intensity (heavy vs. light) of force applied by the archwires and the amount of root resorption induced by the orthodontic treatment23,24. Other mechanical factors that should be considered include duration of the force, extent of tooth movement and type of movement25. Continuous forces, such as those produced by NiTi alloys, are more effective for tooth movement, but may induce root resorption because of the long times of force application involved23.
properties of orthodontic archwires; however, a wide range of variation upon materials and methods is observed13,17,18,30. The results reported by Gatto et al.13 and Oltjen et al.31 include a lower range of forces during unloading, 40-50gf for GAC and 3M groups13 and between 40-60gf13,31. This is probably due to differences in the crosshead rate and span length. Gatto et al.13 and Oltjen et al.31 used cross speeds of 3 mm/min and 1.27 min/min, while in the present work speed was 6 mm/min. The speed range between 5-6 mm/min is supported by ISO standards and was adopted by other authors which used this standardization as a reference for three bending tests21. There are also differences in the span length since the present work and Dechkunakorn et al.21 used 10 mm of distance between the supporting points, while Gatto et al.13 used 12 mm and Oltjen et al.31 used 13 mm. Bartzela et al.14 found higher unloading values under the same delection used in this work; however, the cross section of the round Nitinol wire evaluated was 0.016” and the specimen was not superelastic. Probably, the reduced mechanical hysteresis behavior of this kind of wire could not absorb the same amount of energy due to friction between the slip planes and, thus, the unload value remained higher (239 gf) than the ranges reported in this work.
Classical papers have advocated that the force required to produce a minimal rate of tooth movement to distalize a canine, for example, is between 150-200gf[32-34]. If we take this statement as reference, all groups evaluated might be employed without the risk of hyalinization and undermining resorption. Nevertheless, many of these reports have considered the force needed to distalize a tooth instead of the force necessary for alignment and leveling, which is the main use of NiTi wires in orthodontics. Therefore, the authors think that lower forces should be adopted, and, as reported in literature, probably 50 gf might be an optimal value for maxillary premolars23,24. Assuming this limit, just Tp HA lot 686025 (39.9gf) was able to release this strength on the unloading baseline. However, many authors have stated that 25gf should be considered as a light force and a heavy force limit was calculated multiplying by 9 this lower baseline, leading to a 225gf, which is a much higher level than observed in all wires tested during unloading25-27,29. It should also be considered that an orthodontic appliance is not composed just of one wire solely, but by an interaction of brackets and wires, which result in a multipoint load system when the wire is completely tied. Moreover, there are multifactorial factors such as the interbracket distance, the degree of irregularity (teeth misalignment), the full-bracket slot engagement, the critical angle in the wire-bracket slot
interface, and other biomechanical considerations which could make reasonable that a baseline above the referenced 50gf might be considered acceptable for the unloading plateau. Some of these factors were partially reproduced in experimental setups for mimicking the effect of SMA in orthodontic treatments35,36. According to Ren et al.37, there is not a consensus on the optimal force levels in orthodontics. It is important to emphasize that all NiTi archwires tested in the present work are used for orthodontic treatment. The orthodontists employ different methods to control tooth movement. Based on clinical experience, the orthodontists can control the force to move the teeth with different types of archwire. It is the purpose of this study to lead clinicians in choosing NiTi archwires which exhibit similar mechanical performance, however are commercial offered at different costs.
5. Conclusions
1. HA archwires showed better mechanical performance than SE ones, with lower stress level on loading and unloading plateau, greater mechanical hysteresis and thus, lower forces should be delivery to tooth;
2. There was no evidence of shape memory effect behavior by the HA wires;
3. There were multiple differences between different lots of the same manufacturer regard LMS, UMS, TR, PR and HR;
4. Similarities were seen between SE and HA wires from the same manufacturer in all mechanical properties evaluated;
5. Matches were showed between SE and HA from different manufacturers, whereupon there are equivalences in wires commercial offered at different costs.
Acknowledgements
The authors thank professor Ronaldo de Biasi (Military Institute of Engineering) for reading and considerably improving the manuscript; Carlos Chagas Foundation for Research Support from the Rio de Janeiro State (FAPERJ) and Capes Foundation from Brazilian Government for support this investigation by the grants: E-26/102.766/2012 and BEX 539012-5/2013.
References
1. Neelakantan L, Monchev B, Frotscher M and Eggeler G. The influence of secondary phase carbide particles on the passivity behaviour of NiTi shape memory alloys. Materials and Corrosion. 2012; 63:979-984.
2. Abbasi-Chianeh V, Khalil-Allafi J and Kazemi-choobi K. The effect of post-deformation aging on superelastic properties of Ni50.9Ti thin wires attaining micro and nano-substructure. Journal of Alloys and Compounds. 2013; 563:44-50. http:// dx.doi.org/10.1016/j.jallcom.2013.02.027.
3. Garrec P, Tavernier B and Jordan L. Evolution of flexural rigidity according to the cross-sectional dimension of a superelastic nickel titanium orthodontic wire. European Journal of Orthodontics. 2005; 27(4):402-407. http://dx.doi.org/10.1093/ejo/cji014. PMid:16043477.
4. Biesiekierski A, Wang J, Gepreel M and Wen C. A new look at biomedical Ti-based shape memory alloys. Acta Biomaterialia. 2012; 8(5):1661-1669. http://dx.doi.org/10.1016/j.actbio.2012.01.018. PMid:22326786.
2011; 2011:132408. http://dx.doi.org/10.5402/2011/132408. PMid:21991455.
6. Heinen R and Miro S. Micromechanical modeling of NiTi shape memory alloys including austenite, R-phase, and martensite. Computational Methods in Applied Mathematics. 2012; 229:44-55.
7. Robertson SW, Pelton AR and Ritchie RO. Mechanical fatigue and fracture of Nitinol. International Materials Reviews. 2012; 57(1):1-36. http://dx.doi.org/10.1179/1743280411Y.0000000009. 8. Benafan O, Padula SAI 2nd, Noebe RD, Sisneros TA and
Vaidyanathan R. Role of B19’ martensite deformation in stabilizing two-way shape memory behavior in NiTi. Journal of Applied Physics. 2012; 112(9):093510. http://dx.doi. org/10.1063/1.4764313.
9. Elahinia MH, Hashemi M, Tabesh M and Bhaduri SB. Manufacturing and processing of NiTi implants: a review. Progress in Materials Science. 2012; 57(5):911-946. http:// dx.doi.org/10.1016/j.pmatsci.2011.11.001.
10. Ezaz T, Wang J, Sehitoglu H and Maier HJ. Plastic deformation of NiTi shape memory alloys. Acta Materialia. 2013; 61(1):67-78. http://dx.doi.org/10.1016/j.actamat.2012.09.023. 11. International Organization for Standardization – ISO. ISO
15841:2014: dentistry: wires for use in orthodontics. Geneva: ISO; 2014.
12. Lombardo L, Toni G, Stefanoni F, Mollica F, Guarneri MP and Siciliani G. The effect of temperature on the mechanical behavior of nickel-titanium orthodontic initial archwires. The Angle Orthodontist. 2012; 83(2):298-305. http://dx.doi. org/10.2319/040612-287.1. PMid:22908946.
13. Gatto E, Matarese G, Di Bella G, Nucera R, Borsellino C and Cordasco G. Load-deflection characteristics of superelastic and thermal nickel-titanium wires. European Journal of Orthodontics. 2013; 35(1):115-123. http://dx.doi.org/10.1093/ ejo/cjr103. PMid:22023884.
14. Bartzela TN, Senn C and Wichelhaus A. Load-deflection characteristics of superelastic nickel-titanium wires. The Angle Orthodontist. 2007; 77(6):991-998. http://dx.doi. org/10.2319/101206-423.1. PMid:18004922.
15. Lombardo L, Marafioti M, Stefanoni F, Mollica F and Siciliani G. Load deflection characteristics and force level of nickel titanium initial archwires. The Angle Orthodontist. 2011; 82(3):507-521. http://dx.doi.org/10.2319/032511-213.1. PMid:21913852. 16. International Organization for Standardization – ISO. ISO
15841:2006: dentistry: wires for use in orthodontics. Geneva: ISO; 2006.
17. Parvizi F and Rock WP. The load/deflection characteristics of thermally activated orthodontic archwires. European Journal of Orthodontics. 2003; 25(4):417-421. http://dx.doi.org/10.1093/ ejo/25.4.417. PMid:12938849.
18. Wilkinson PD, Dysart PS, Hood JAA and Herbison GP. Load-deflection characteristics of superelastic nickel-titanium orthodontic wires. American Journal of Orthodontics and Dentofacial Orthopedics. 2002; 121(5):483-495. http://dx.doi. org/10.1067/mod.2002.121819. PMid:12045766.
19. Mallory DC, English JD, Powers JM, Brantley WA and Bussa HI. Force-deflection comparison of superelastic nickel-titanium archwires. American Journal of Orthodontics and Dentofacial Orthopedics. 2004; 126(1):110-112. http://dx.doi.org/10.1016/j. ajodo.2004.03.012. PMid:15224067.
20. Meling TR and Ødegaard J. The effect of short-term temperature changes on superelastic nickel-titanium activated in orthodontic bending. American Journal of Orthodontics and Dentofacial Orthopedics. 2001; 119(3):263-273. http://dx.doi.org/10.1067/ mod.2001.112451. PMid:11244421.
21. Dechkunakorn S, Isarapatanapong R, Anuwongnukroh N, Chiranavanit N, Kajorchaiyakul J and Khantachawana A.
Mechanical properties of several NiTi alloy wires in three-point bending tests. Applied Mechanics and Materials. 2001; 87:14-19. http://dx.doi.org/10.4028/www.scientific.net/AMM.87.14. 22. Iijima M, Ohno H, Kawashima I, Endo K and Mizoguchi I.
Mechanical behavior at different temperatures and stresses for superelastic nickel-titanium orthodontic wires having different transformation temperatures. Dental Materials. 2002; 18(1):88-93. http://dx.doi.org/10.1016/S0109-5641(01)00025-2. PMid:11740969.
23. Aras B, Cheng LL, Turk T, Elekdag-Turk S, Jones AS and Darendeliler MA. Physical properties of root cementum: Part 23. Effects of 2 or 3 weekly reactivated continuous or intermittent orthodontic forces on root resorption and tooth movement: a microcomputed tomography study. American Journal of Orthodontics and Dentofacial Orthopedics. 2012; 141(2):e29-e37. http://dx.doi.org/10.1016/j.ajodo.2011.07.018. PMid:22284296.
24. Weltman B, Vig KWL, Fields HW, Shanker S and Kaizar EE. Root resorption associated with orthodontic tooth movement: A systematic review. American Journal of Orthodontics and Dentofacial Orthopedics. 2010; 137(4):462-476, discussion 12A. http://dx.doi.org/10.1016/j.ajodo.2009.06.021. PMid:20362905. 25. Montenegro VCJ, Jones A, Petocz P, Gonzales C and Darendeliler
MA. Physical properties of root cementum: Part 22. Root resorption after the application of light and heavy extrusive orthodontic forces: a microcomputed tomography study. American Journal of Orthodontics and Dentofacial Orthopedics. 2012; 141(1):e1-e9. http://dx.doi.org/10.1016/j.ajodo.2011.06.032. PMid:22196196.
26. Wu ATJ, Turk T, Colak C, Elekdag-Turk S, Jones AS, Petocz P, et al. Physical properties of root cementum: Part 18. The extent of root resorption after the application of light and heavy controlled rotational orthodontic forces for 4 weeks: a microcomputed tomography study. American Journal of Orthodontics and Dentofacial Orthopedics. 2011; 139(5):e495-e503. http:// dx.doi.org/10.1016/j.ajodo.2010.01.036. PMid:21536191. 27. Paetyangkul A, Turk T, Elekdag-Turk S, Jones AS, Petocz P,
Cheng LL, et al. Physical properties of root cementum: Part 16. Comparisons of root resorption and resorption craters after the application of light and heavy continuous and controlled orthodontic forces for 4, 8, and 12 weeks. American Journal of Orthodontics and Dentofacial Orthopedics. 2011; 139(3):e279-e284. http:// dx.doi.org/10.1016/j.ajodo.2010.07.021. PMid:21392672. 28. Paetyangkul A, Turk T, Elekdag-Turk S, Jones AS, Petocz P and
Darendeliler MA. Physical properties of root cementum: Part 14. The amount of root resorption after force application for 12 weeks on maxillary and mandibular premolars: a microcomputed-tomography study. American Journal of Orthodontics and Dentofacial Orthopedics. 2009; 136(4):492e1-492.e9, e6. http:// dx.doi.org/10.1016/j.ajodo.2009.03.008. PMid:19815148. 29. Ballard DJ, Jones AS, Petocz P and Darendeliler MA. Physical
properties of root cementum: Part 11. Continuous vs intermittent controlled orthodontic forces on root resorption: a microcomputed-tomography study. American Journal of Orthodontics and Dentofacial Orthopedics. 2009; 136(1):8.e1-8.e8. http://dx.doi. org/10.1016/j.ajodo.2007.07.026. PMid:19577132.
30. Gurgel JA, Kerr S, Powers JM and LeCrone V. Force-deflection properties of superelastic nickel-titanium archwires. American Journal of Orthodontics and Dentofacial Orthopedics. 2001; 120(4):378-382. http://dx.doi.org/10.1067/mod.2001.117200. PMid:11606962.
32. Smith R and Storey E. The importance of force in orthodontics: the design of cuspid retraction springs. Australian Dental Journal. 1952; 56:291-304.
33. Gjessing P. Biomechanical design and clinical evaluation of a new canine-retraction spring. American Journal of Orthodontics. 1985; 87(5):353-362. http://dx.doi.org/10.1016/0002-9416(85)90195-2. PMid:3857860.
34. Reitan K. Some factors determining the evaluation of forces in orthodontics. American Journal of Orthodontics. 1957; 43(1):32-45. http://dx.doi.org/10.1016/0002-9416(57)90114-8. 35. Kim T, Kim K and Baek S. Comparison of frictional forces
during the initial leveling stage in various combinations of
self-ligating brackets and archwires with a custom-designed typodont
system. American Journal of Orthodontics and Dentofacial
Orthopedics. 2008; 133(2):187.e15-187.e24. PMid:18249279.
36. Badawi H, Toogood RW, Carey JPR, Heo G and Major PW. Three-dimensional orthodontic force measurements. American Journal of Orthodontics and Dentofacial Orthopedics. 2009; 136(4):518-528. http://dx.doi.org/10.1016/j.ajodo.2009.02.025. PMid:19815153.