Key words: rail freight; freight trains; utilisation; route; simulations.
Palavras-Chave: transporte ferroviário de mercadorias; trens; utilização; corredor ferroviário; simulações.
Recommended Citation
Research Directory
Submitted 13 Feb 2012; received in revised form 13 Jul 2012; accepted 17 Jul 2012
Simulation modelling to analyse the current level of utilisation of
sections along a rail route
[Modelos de simulação para analisar os níveis correntes de utilização de seções ao longo de uma rota ferroviária]
Newcastle University, United Kingdom Clare Woroniuk, Marin Marinov*
Abstract
This research aims to assess the level of utilisation of sections along a rail route by employing a series of simulation models. For the purposes of this research a multi method approach has been implemented which includes data collection, data analysis, modelling, model exploitation, measures of system performance and conclusion. Analytical methods and concepts in the study of railway freight lines and networks are presented. The discrete event based simulation models employed in this research have been implemented to study the rail route from Silla to Castellbisbal in Eastern Spain. The output from the models suggests that the current rate of utilisation is insignificant therefore different scenarios have been generated. These are based on changes to traffic rules, wherein the total number of services operated on the line is varied between the different scenarios. This paper concludes that it is possible to significantly increase the level of utilisation along the rail route from the current scenario. A contribution to knowledge is presented through the implementation of the simulation software Arena to study utilisation along a rail freight route.
Resumo
Esta pesquisa procura obter o nível de utilização das seções de uma ferrovia através do uso de modelos de simulação. Para este propósito foi implementada uma abordagem de múltiplos métodos que inclui coleta e análise de dados, modelagem, exploração de modelos, métricas de performance e conclusão. Métodos analíticos e estudos conceituais de linhas de transporte ferroviário e redes são apresentados. Especificamente, os modelos de simulação empregados nesta pesquisa foram implementados para estudar a linha férrea de Silla para Castellbisbal. Os modelos sugerem que a atual taxa de utilização é bastante pobre. Foram gerados e analisados diferentes cenários baseados em mudanças das regras de tráfego. Este artigo conclui que é possível aumentar significativamente o nível de utilização de uma linha férrea.
Woroniuk, C. and Marinov, M. (2013) Simulation modelling to analyse the current level of utilisation of sections along a rail route. Journal of Transport Literature, vol. 7, n. 2, pp. 235-252.
* Email: [email protected].
Introduction
Rail freight transport is known to provide benefits to the economy, society and the
environment through serving shipper needs efficiently, leading to opportunities for increased
business. These benefits include a decreased environmental impact in comparison to
competitors such as road and short sea shipping due to less CO2 emissions and air pollution.
The option for greater mobility for citizens is also provided by rail freight, due to a reduction
in congestion (Giannettoni and Savio, 2004), rail also has a proven safety record particularly
in the transportation of hazardous goods, decreasing the potential risk of accidents.
EU freight trends indicate that in 2008 rail held only 10% of the market share of freight
transport for inland modes, (EC 2010, pp 109) and while road freight covered 1878 thousand
mio tonne-kilometres of freight only 443 thousand mio tonne-kilometres was covered by rail
freight (EC 2010 pp 108).
The utilisation of EU rail lines has been highlighted in recent years due to EU rail freight
policy changes. The 2011 White Paper of the European Commission addressed the need for
an increase in the volume of goods transported by rail freight across Europe. The European
Commission recognises rail freight as an environmentally friendly transport mode and as a consequence suggests that, “30% of road freight over 300km should shift to other modes such as rail or waterborne transport by 2030 and more than 50% by 2050, facilitated by efficient and green freight corridors,” (EC 2011, pp 9). This is one of several policy changes which suggest that the utilisation of EU railways may be an area which requires research in the
future as goods currently transported by road have the potential to be transported by rail.
Motivated by this situation, this research aims to understand the level of utilisation of an EU
rail route through providing an insight into the levels of operational performance along the
chosen route and identifying areas for improvement.
The main objective of this paper is to develop a simulation model which will help to gain an
understanding of the level of utilisation along a rail route. This is attained through the
application of a suitable methodology and the use of an appropriate tool for analysis. An
current situation with the movement of train sets has been simulated. Alternative scenarios
have been generated to identify critical points along the route which can be better utilised.
The rest of the paper is organised as follows: Section 1 provides an overview of the literature
analysing railway freight line and network performance. A description of the case study
selected for this research is presented in Section 2. The method employed for modelling in
Arena is presented in Section 3. A summary of the results obtained is provided in Section 4,
while the final section offers a conclusion and recommendations for future work.
1. State of the Art
The decomposition approach, wherein the network is broken down into individual static and
dynamic components is an approach which has often been employed during the study of route
utilisation and has been used for the purposes of this research. The interested reader is
referred to Petersen (1977a and 1977b), Tasev and Karagyozov (1983), Dessouky and
Leachman (1995), Pachl (2002) and Shughart et al. (2006).
Analytical methods and concepts in the study of rail freight lines and networks are presented
in the following section. By design, rail networks are more complex than a rail line, as a result
of the higher number of static and dynamic resources involved. However, in many examples,
railway routes can be considered as a sub rail network, as they integrate yards and lines. As a
consequence, methods applied in the study of rail networks are appropriate in this scenario
also.
Analytical and simulation models are frequently employed to analyse the utilisation of a
railway route. Developments indicate that analytical models are not widespread in analysing
route capacity for tactical planning purposes and that simulation is used more regularly.
Peterson and Taylor (1982) presented a model for rail route optimisation and simulation in
1982, the model divides the rail route into segments which represent the sections of track
between adjacent switches.
Katchaunov et al. (1998) reported a simulation model for the analysis of a railway section; the
model concept is to identify the main technological indices for the development of a railway
configuration and infrastructure. The model applies the General Process System Simulation
(GPSS) language and contains 350 routes of code. The analysis of rail corridors through the
use of simulation modelling is also offered by Tobias et al (2010), through simulation, the
model aims to identify queues and bottlenecks along the route, as a result of predicted traffic
growth. Further contributions to rail route analysis have been provided by Pachl (2002),
Goosens et al. (2004), Moreira et al. (2004), Pachl and White (2004).
Rail network analysis has been implemented through network optimisation methods,
including the subordinated theory of graphs and networks and simulations, in particular event
based simulations. Past research developments by Assad (1980) and Peterson and Taylor
(1982) suggest that queuing theory can be applied effectively to rail networks. Twenty years
later, van Dijk (2000) presents a combination of queuing theory and simulations to study the
same phenomena.
A number of research advances in the study of rail networks are demonstrated in the
literature, analytical optimising network models have been discussed by Assad (1980), these
models aim to identify the optimal network route, while incorporating additional costs.
Crainic and Laporte (1997) presented a model to optimise the network, consisting of arcs and
nodes wherein the network is depicted in graphical form in which the links between the
transport facilities are represented by arcs and the transport facilities are represented by nodes.
The arcs and nodes also represent physical capacity and as a consequence the processing
capability of the network can be depicted by the graph.
A strategic model for rail freight operations is reported by Fernandez et al (2004), the model
aims to predict the levels of service and equilibrium flows when the origin-destination
transport demands have been provided. The model can be used in the evaluation of railway
freight networks including yard operations.
Simulation modelling methodologies are reported by Dessouky and Leachman (1995) and
Marinov and Viegas (2010). Dessouky and Leachman (1995) provided a simulation
modelling methodology for the study of complex rail networks and an analytical methodology
for single and double track networks is identified. Marinov and Viegas (2010) presented a
network components, thus providing an overall analysis of freight operations within a
network.
Simulations have frequently been employed in the study of freight train operations along
corridors and networks as they allow a more detailed analysis and precise evaluation to be
obtained. A number of simulation packages have been implemented to explore rail freight
operations. The software tool VirtuOs has been implemented by Kavicka and Klima (2000) in
the study of railway junctions. In addition, a study incorporating network and timetable
optimisation through the implementation of Opentrack has been presented by Nash and
Huerlimann (2004). RailSys has been employed by Anand and Anayi (2010) to study
timetable and network optimisation. Another software package, Villon Generic Simulation
was originally developed for the study of capacity issues in marshalling yards, further
developments have led to the implementation of Villon in cases which focus on terminals and
other railway nodes (Kavicka et al. 2006). SIMUL8 is an event based simulation package,
which has been implemented by Marinov (2009) and Marinov and Viegas (2011) during the
evaluation of performance capability of rail freight yards in Portugal.
For the purposes of this research a simulation modelling methodology has been developed,
the methodology has been implemented using the event based simulation package Arena,
which is built on the SIMAN simulation language. Previous research has indicated that
significant results can be obtained through the implementation of Arena for rail freight
research. For instance, Arena has been employed by Bontekoning (2006) during the study of
operations at terminals and shunting yards and by Fogliatti de Sinay et al (2008) in the study
2. Route under Study
The Castellbisbal- Silla Corridor is located on the East coast of Spain. The Castellbisbal-Silla
route is an electrified line, with a typical line speed of 100 km/h (75 km/h for freight). The
majority of the route is double track, apart from a 57 km section between Villarreal and
Tarragona, which is single line.
A combination of freight and passenger traffic uses the route, which has a signalling system
of cab radio and colour light signals, train control is managed by automatic blocks. All of the
freight on this line runs from rail yard to rail yard without intermediate service activity on the
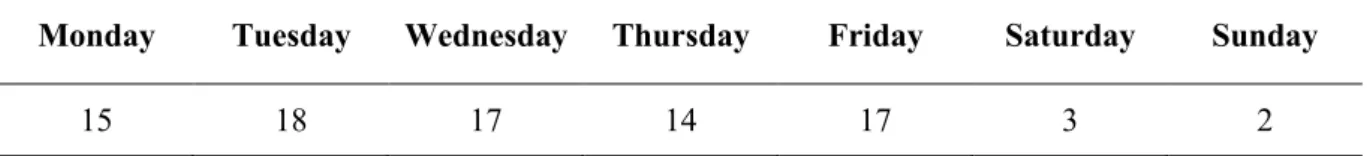
line. The total number of freight trains per day is indicated in Table 1. Bulk commodities such
as iron and steel are transported along the line, as well as cars and intermodal traffic.
Table 1 – Freight Services which use Corridor (total trains per day)1
Monday Tuesday Wednesday Thursday Friday Saturday Sunday
15 18 17 14 17 3 2
3. Modelling with Arena
The methodology adapted for the purposes of this paper is presented in Marinov and Viegas
(2011) and therefore shall not be discussed further here. Instead the alternative scenarios
generated based on changes to traffic rules are discussed in greater detail.
For simulation modelling purposes Arena (Rockwell Software) has been used to produce
simulation models. Arena is a visual event simulation package, with different modules used to
replicate the network.
The entities represent the trains within the Arena environment, with the focus on the flow of
the entities through the system. The entities are produced by create modules, each entity
created represents a new freight service entering the network. The create module includes a
number of variables which can be altered to suit the network being represented.
1
Entity flow is captured as the entity passes through each module, each module has an input
and output port which allows a connection to be made to the next module. When the entity
reaches the dispose module this is the equivalent of a freight train reaching its final
destination and leaving the network. When travelling through the system, the entities seize the
resources in the system to be served. The resources represent the rail freight stations,
passenger stations and rail lines they are represented by the process module.
The interaction between the entity and the server represents the relationship between the
stations and the trains. Similar to the create module the process module includes a number of
pre-programmed variables to allow close replication of the system such as; Logic Action,
Resource capacity and process time. Potential queues within the network are also represented
by the process module. A queue will form if the number of entities is too high for the resource
to process in the given time. If this situation occurs the entities will queue at the previous
module.
Entities exit the system through a dispose module. A dispose module records the number of
entities leaving the system and this data is presented in the model report. Once the route has
been replicated within Arena the run parameters must be set using the run tool. On completion
of the simulation, Arena produces a number of reports; the data from which are important to
assess the rail route in question.
For this purposes of this study, the decomposition approach has been employed in order to
replicate the rail route within Arena. The rail route under study was decomposed into: rail
line, rail freight stations and rail passenger stations. Detailed data regarding these components
was provided by the operator Administrador de Infraestructuras Ferroviarias (ADIF) along
with timetable data for the route.
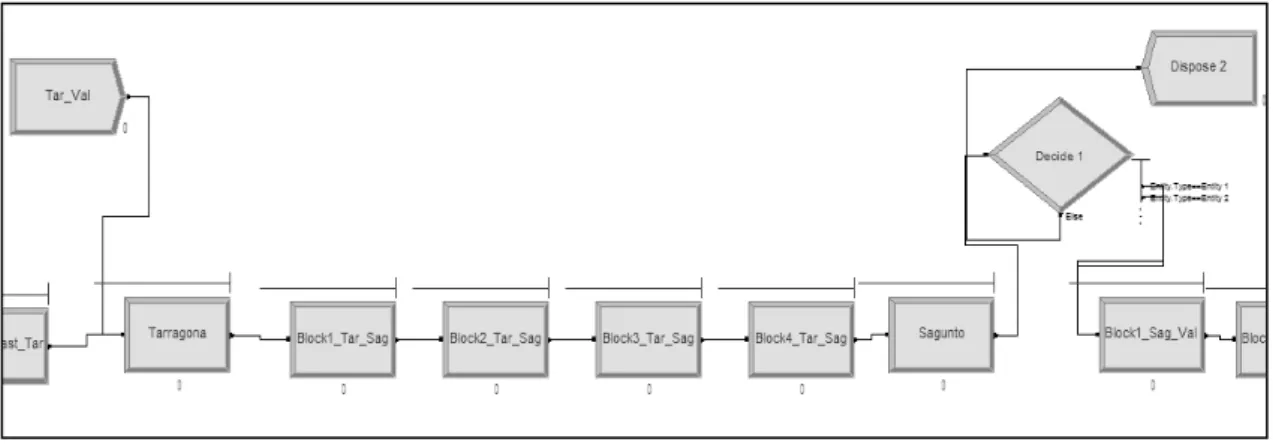
The route was replicated using a combination of create, process, decide and dispose modules
(Figure 1). The freight represented in these models is scheduled freight, this was replicated
using the create modules which create the entities or trains using the timetable provided. Note
Figure 1 – Create, Process, Decide and Dispose Modules
Figure 2 - Rail Route broken down in Arena
The rail route was represented by a process module. Initially each 2.5km block is represented
by one process module. In addition the rail freight stations and rail passenger stations were
also represented by process modules. The logic of the process module was edited to seize,
delay and release wherein the entity/train seized by the process module, is served by the
resource and then releases the resource after a set parameter of time in line with the process
time.
To ensure that the results produced by the simulation model are as accurate as possible, on
completion the model must be calibrated and validated. As timetable data for this route was
available this was done through the comparison of the model with the timetable data and the
data produced by Arena on completion of the model run time. Data for waiting times and total
journey time were compared with the timetable data in order to gauge the accuracy of the
model. The similarities identified between both sets of results suggest a significant
correlation.
4. Application
4.1 Measures of Performance
To ensure a reliable set of results, 150 replications of the model were run. It should be noted
that this model focuses on the assessment of planned utilisation of the route through the
simulation of timetable data. Therefore 150 replications were considered sufficient to meet the
objectives of this study. However, if the model was assessing real world data a higher number
of replications may need to have been considered. In order to provide a comparison between
different sections along the route, on completion of simulation, several measures of
performance were collected. These included:
line utilisation;
station utilisation;
instantaneous utilisation.
Line utilisation is calculated through analysing the total number of entities seized by each
block section. This was employed to measure the movement of trains in one direction, along
each section, it was expected that the results would provide an indication as to which sections
could be better utilised.
Station utilisation was also calculated through analysing the total number of entities seized by
each station. It was expected that this would provide a suggestion as to which stations could
be better utilised. Instantaneous utilisation is calculated from taking the utilisation at each
instant in time and then calculating a time weighted average. It was anticipated that the
analysis of these data could contribute to a more efficient rate of utilisation.
4.2 Results
In this paper the current situation was analysed, the results obtained led to the generation of
two alternative scenarios.
Scenario 1 current scenario nine direct freight services were observed;
Scenario 2 twenty six direct freight services were observed;
In the next section the results from each of the scenarios are presented.
4.2.1 Scenario 1
In the following section we observe the results from the simulation models in Arena. In this
analysis the aim is to obtain the current level of utilisation along this rail route. For the
purposes of this exploration nine direct freight services were observed on the Mediterranean
Corridor. Typically the services exhibit characteristics of the following nature: an average line
speed of 75km/h, an average train length of 420m and an average number of wagons per train
of 18.
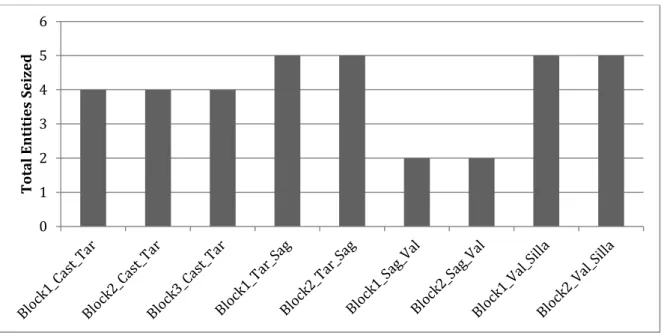
Figure 3 indicates line utilisation from Castellbisbal – Silla. Please note that the highest line
utilisation from Tarragona – Sagunto (5) and the lowest utilisation between Sagunto and
Valencia (2). This validates the timetable data which demonstrates a number of freight
services leave the line at Sagunto.
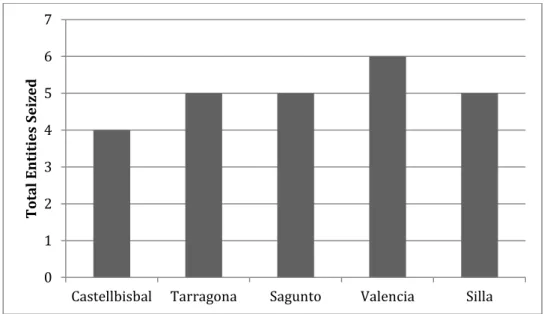
From Figure 4 station utilisation is observed. The graph indicates the highest station
utilisation at Valencia (6 trains) which confirms a number of freight services enter the line
here. The data for percentage utilisation from Castellbisbal – Silla which is shown in Figure 5
confirms that the highest utilisation rate is between Tarragona and Sagunto.
Figure 3 - Line utilisation Castellbisbal- Silla
0 1 2 3 4 5 6
To
ta
l
Ent
it
ies
S
Figure 4 - Station Utilisation Castellbisbal- Silla
Figure 5 - Percentage Utilisation Castellbisbal- Silla
The parameters in Table 2 indicate that this line is not heavily utilised by freight traffic as line
utilisation confirms a maximum utilisation of five trains. An average speed of 75 km/h
demonstrates that the condition of the infrastructure is reasonable as 75km/h is in concordance
with the average speed for freight routes in Central and Western Europe. Note that the
average train length of 420 m indicates that there is potential for average train length increase.
Further research may be of interest to clarify restrictions on train length imposed by
infrastructure along this route.
0 1 2 3 4 5 6 7
Castellbisbal Tarragona Sagunto Valencia Silla
To
ta
l
Ent
it
ies
S
eized
0 5 10 15 20 25 30
Per
cent
a
ge
Ut
il
isa
tio
Table 2 – Characteristics of Spanish Route: Mediterranean Corridor
Parameter Value
Average Speed 75km/h
Average Train Length 420m
Line Utilisation Maximum 5
Minimum 2
4.2.2 Scenario 2
The results from the current scenario indicated low levels of utilisation along the rail route. In
order to increase the level of utilisation and to obtain an optimum level, a number of
alternative scenarios have been generated.
In this scenario the number of services along the corridor was increased from 9 in total to 26
with the aim to find an optimum utilisation. The results from the model indicate bottlenecks
and queues with high waiting times of over two hours in the first block between Tarragona
and Sagunto. Queues were also observed between Castellbisbal and Tarragona although not
on the same scale as between Tarragona and Sagunto.
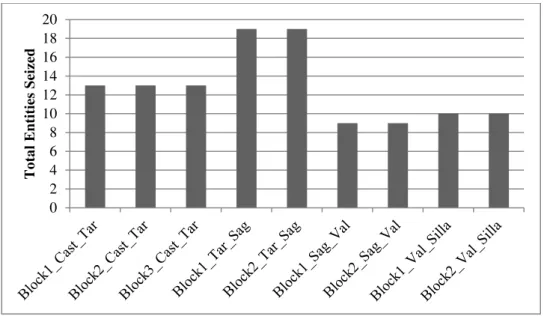
Figure 6 indicates the estimated line utilisation for the route when a total of 26 services have
been timetabled. Please note the highest line utilisation between Tarragona and Sagunto in
concordance with the bottleneck and queue.
Figure 7 illustrates waiting time in hours along the route. For Block 1 between Castellbisbal
and Tarragona the average waiting time is 0.0189 hours. The results indicate a minimum
waiting time of 0.0 and a maximum waiting time of 0.12 hours with a range of 0.12 hours. For
Block 1 between Tarragona and Sagunto the average waiting time is 2.25 hours, while the
minimum waiting time is 0.0 hours and the maximum waiting time is 5.14 hours. These data
indicate a range of 5.14 hours. The two bottleneck points are illustrated by the graph in
Figure 6 - Line Utilisation: Scenario 2
Figure 7 - Waiting Time in Hours: Scenario 2 0
2 4 6 8 10 12 14 16 18 20
T
o
ta
l En
tit
ies
Seized
0 0.5 1 1.5 2 2.5
Time
in
h
4.2.3 Scenario 3
As the results from Scenario 2 suggested that 26 services did not obtain the optimum
utilisation, the traffic rules were altered further to create scenario 3, wherein the number of
services were decreased from 26 to 16.
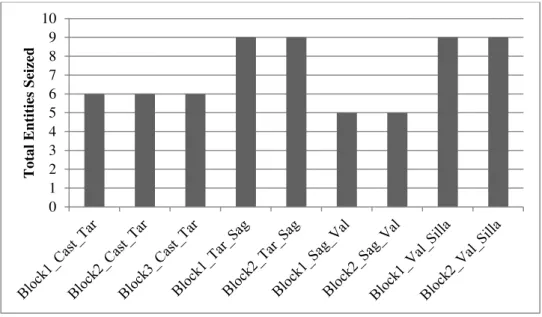
Figure 8 - Line Utilisation: Scenario 3
As demonstrated by Figure 8 the maximum line utilisation was 9 trains on sections between
both Tarragona and Sagunto and Valencia and Silla. Figure 9 shows that both sections with
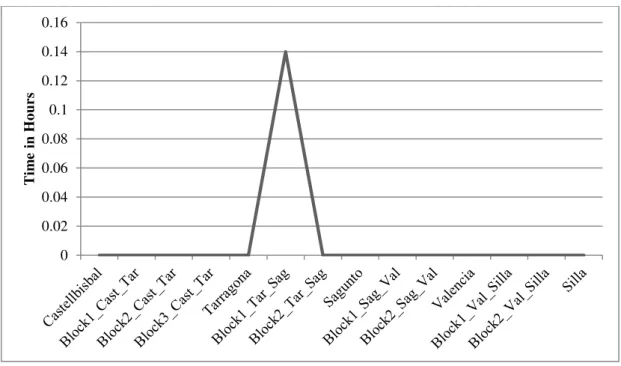
bottlenecks in scenario 2 have significantly reduced queues. Specifically, the average queuing
time between Tarragona and Sagunto is reduced from over two hours to eight minutes. The
minimum queuing time is 0.0 hours, while the maximum waiting time is 0.61 hours indicating
a range of 0.61 hours. Note the inclusion of a random factor means that it is unlikely that zero
will ever be reached.
As indicated previously the current maximum line utilisation of 5 trains is significantly lower
than expected, while the lowest line utilisation of 2 trains between Sagunto and Valencia is
also significantly low. The average speed for the route of 75km/h is reasonable, which implies
that average speed does not impact negatively on the rate of utilisation for the route. The
analysis of two additional scenarios, where the traffic rules were changed with the aim to
obtain an optimum level of utilisation has concluded that it is possible for sixteen freight
services to use the route leading to a 177% increase from the current situation. 0
1 2 3 4 5 6 7 8 9 10
T
o
ta
l En
tit
ies
Figure 9 - Waiting Time in Hours: Scenario 3
Conclusion
This paper has developed discrete event-based simulation models to study the utilisation level
along a rail freight route in Spain. Specifically, for the purposes of the study a number of
measures of performance were analysed in order to gauge the current level of utilisation.
These included: line utilisation, station utilisation and instantaneous utilisation.
The results for the current scenario suggest that the level of route utilisation along the corridor
is lower than anticipated for a European freight corridor, which is demonstrated through
significantly low line utilisation figures. The route indicated a reasonable average speed,
which suggested that speed does not impact negatively on the rate of utilisation. In the current
scenario the results demonstrated that capacity outweighs the demand, which indicates that
additional measures are needed to increase the utilisation along the route.
Two alternative scenarios have been developed the results from which concluded that it is
possible to significantly increase the line utilisation from the current scenario. Measures to
increase the utilisation of freight traffic along the Mediterranean corridor under study may
include: an increase in market share by Spanish rail freight through development into new
markets and the implementation of a new business model. 0
0.02 0.04 0.06 0.08 0.1 0.12 0.14 0.16
T
im
e
in H
o
Currently the main traffic on the Castellbisbal – Silla Corridor consists of cars and bulk
freight with some intermodal traffic as demand is significantly low, which suggests the
potential for market expansion. If improvements can be made to the route both locally and
including its integration with the European network then a significant increase in utilisation
may be expected from the current situation.
Future work might be two-fold namely: a science perspective and a business perspective.
Further research from a scientific perspective may include further calibration of the
simulation model through the analysis of the real operation and the inclusion of statistical
analysis in order to study the allocation of resources in further detail. Network externalities
including cost, noise and the sustainability of the system may also be considered to further
advance the models developed. Research to clarify restrictions on train length imposed by
infrastructure along this route may also be of interest.
Future work from a business perspective should explore possibilities to increase the utilisation
of the route. These may include strategies to increase rail freight demand and the addition of
innovative transhipment technologies which would aid the transfer of goods at factories and
ports from land to rail more efficiently leading to an increase in utilisation of the rail route.
References
Anand, N. and Anayi, M. (2010) Improving punctuality of train traffic on western main line of Swedish railway network: simulation approach. ASME Rail Transportation Division Fall Conference, Fort Worth.
Anthony, R. (1965) Planning and control systems: a framework for analysis. Boston: Harvard Graduate School of Business.
Assad, A. (1980) Models for rail transportation. Transportation Research Part A, vol. 14, n. 3, pp. 205-220.
Bontekoning, Y. (2006) Hub exchange operations in intermodal hub and spoke networks. Delft University Press.
Crainic, G. and Laporte, G. (1997) Planning models for freight transportation. European Journal of Operational Research, vol. 97, n. 3, pp. 409-438.
Dessouky, M. and Leachman, R. (1995) A simulation modelling methodology for analysing large complex rail networks. Simulation, vol. 65, n. 2, pp. 131-142.
European Commission (2010) Statistical pocketbook. Luxembourg: Publications Office of the European Union.
Fernandez, J., Joaquin, C. and Giesen, R. (2004) A strategic model of freight operations for rail transportation systems. Transportation Planning and Technology, vol. 27, n. 4, pp. 231-260.
Giannettoni, M. and Savio, S. (2004) Fleet management in railway freight transport: the EU project F-Man. International Conference on Design and Operation in Railway Engineering (COMPRAIL), Dresden.
Goossens, J., van Hoesel, S. and Kroon, L. (2006) On solving multi-type railway route planning problems. European Journal of Operational Research, vol. 168, n. 2, pp. 403-424.
Huisman, T., Boucherie, R. and van Dijik, N. (2002) A solvable queuing network model for railway networks and its validation and applications for the Netherlands. European Journal of Operational Research, vol. 142, n. 1 pp. 30-51.
Janic, M. (2008) An assessment of the performance of the European long intermodal freight trains (LIFTS). Transportation Research Part A, vol. 42, n. 10, pp. 1326-1339.
Karagyozov, K. (1983) Simulation model of a marshalling yard. Conference of an Applied Science, about Implementation of Electronic Computation Machines and Micro-processors in Railway Transport, Varna.
Karagyzov, K., Danchev, A. and Kupenov, D. (1990) Method and algorithm for determination of the assembling parameter and the railcar delay in rail yards (written in Bulgarian). Scientific- Technical Conference with International Particiaptiocn about New Technologies in Organisation of Transportation Process and Effective Use of Rolling Stock, Gorna Oriahovica.
Katchaunov, T., Karagyzov, K., Kupenov, D. and Razmov, T. (1998) Simulation and Modelling of Transport Processes (written in Bulgarian), (Simulations with GPSS) Higher School of Transport Todor Kableshkov Sofia, Bulgaria (written in Bulgarian).
Kavicka, A. and Klima, V. (2000) Simulation support for railway infrastructure design and planning processes. 7th International conference on Computers in Railways, Bologna.
Kavicka, A., Klima, V. and Adamko, N. (2006) Analysis and optimisation of railway nodes using simulation techniques. 10th International Conference on computer system design and operation in the Railway and other Transit systems, Prague.
Marinov, M. and Viegas, J. (2011) A mesoscopic simulation modelling methodology for analysing and evaluating freight train operations in a rail network. Simulation Modelling Practice and Theory, vol. 19, n. 1, pp. 516-539.
Marinov, M., Mortimer, P., Islam, D. and Zunder, T. (2010) A steady state analysis for yard performances. Journal of Transport Literature, vol. 5, n. 1, pp. 33-49.
Marinov, M. and Viegas, J. (2009) A simulation modelling methodology for evaluating flat shunted yard operations. Simulation Modelling Practice and Theory, vol. 17, n. 6, pp. 1106-1129.
Marinov, M. and Viegas, J. (2011) Analysis and evaluation of double-ended flat-shunted yard performance employing two yard crews. Journal of Transportation Engineering, vol. 137, n. 5, pp. 319-326.
Marinov, M. and Viegas, J. (2011) Tactical management of freight transportation services by rail: evaluation of yard performances. Transportation Planning and Technology, vol. 34, n. 4, pp. 363-387.
Nash, A. and Huerlimann, D. (2004), Railroad simulation using OpenTrack. 9th International conference on computer aided design, manufacture and operation in the railway and other advanced transit systems, Dresden.
Pachl, J. and White, T. (2004) Analytical capacity management with blocking times. TRB Annual Meeting, Washington.
Pachl, J. (2002) Railway operation and control. Mountlake Terrace: VTD Rail Publishing.
Petersen, E. (1977a) Railyard modelling: part I. Prediction of put-through time. Transportation Science, vol. 11, n. 1, pp. 37-49.
Petersen, E. (1977b) Railyard modelling: part II. The effect of yard facilities on congestion.
Transportation Science, vol. 11, n. 1, pp. 50-59.
Petersen, E. and Taylor, A. (1982) A structured model for rail route simulation and optimisation.
Transportation Science, vol. 16, n. 2, pp. 192-206.
Sinay, M. C. F., Ferreira Filho, A. S. and Oliveira, G. D. (2008) Railroad yard logistic to improve capacity. International Conference on Industrial Logistics, Tel Aviv.
Shughart, L., Ahuja, R., Kumar, A., Mehta, S., Dang, N. and Sahin, G. (2006) A comprehensive decision support system for hump yard management using simulation and optimisation.
Innovative Scheduling White Paper, University of Florida.
Tasev, Y. and Karagyzov, K. (1983) Manual for technology and projection of railway stations and junctions (written in Bulgarian). Sofia: VNVTU T Kableshkov.
Tobias, A., House, D. and Wade, R. (2010) Planning capacity improvements in the Chicago- Milwaukee-Madison rail corridor using the rail traffic controller rail operations simulation model. ASME Joint Rail Conference, vol. 2, pp. 297-305.