Key words: thermal comfort, airport service levels, natural and artificial air circulation, energy consumption.
Palavras-Chave: conforto térmico, nível de serviço em aeroportos, circulação de ar natural e artificial, consumo de energia.
Recommended Citation
Resumo
A fim de avaliarem-se as condições atuais de conforto térmico oferecido em três aeroportos de relevância no cenário econômico brasileiro, foram coletadas informações sobre temperatura e umidade relativa do ar, características climáticas regionais e tipologias construtivas dos termais de passageiros. A demanda por transporte aéreo no Brasil cresceu consideravelmente na última década, levando estes aeroportos aos limites de sua capacidade operacional. O desconforto térmico dos usuários destes terminais pode ser o gatilho para despertar sua percepção dos níveis de qualidade, especialmente em situações onde os componentes estão à cima de sua capacidade. Logo, para atingirem-se as situações de conforto térmico adequado neste novo cenário, uma carga maior de trabalho é exigida dos sistemas de ar condicionado, que eleva o consumo e os custos com energia elétrica. As medidas e informações coletadas forneceram subsídio para a construção de cartas psicrométricas, que mostram temperaturas abaixo dos padrões internacionais para o conforto térmico humano. Os resultados mostraram que os melhores níveis de conforto alcançados foram em locais com ventilação natural. Isto sugere a relevância em considerarem-se o uso de sistemas combinados de climatização do ar, para futuras expansões ou novas construções.
Ramis, J. E. and Santos, E. A. (2013) The impact of thermal comfort in the perceived level of service and energy costs of three Brazilian airports. Journal of Transport Literature, vol. 7, n. 2, pp. 192-206.
Jacqueline Elhage Ramis*, Emmanuel Antonio dos Santos
Abstract
To evaluate airports’ current thermal comfort temperature and humidity were registered in three main Brazilian international airports, other variables were local region climate characteristics and the constructive types of passenger terminal buildings. The Brazilian air transportation demand has considerably grown over the last decade, with some airports reaching their capacity. Thermal discomfort may be a key driver of passenger perceptions of airport service levels, specially under capacity overload situations. Therefore, to achieve airport thermal comfort within this new scenario, and with the imminent and future expansions of the airport system, certainly put extra work on the existing air conditioning systems, consequently increasing energy consumption and its associated costs. Collected temperature and humidity from each study case subsided the data for the psychrometric charts. The evidences showed temperatures below the international standards requirements for thermal comfort levels. These charts also indicated that adequate building types with natural air circulation, provides the best levels of thermal comfort. Results suggest the importance of considering the implementation of a combined system using artificial and natural air conditioning in the planning of future expansions.
* Email: [email protected].
Submitted 19 Jun 2012; received in revised form 15 Jul 2012; accepted 17 Jul 2012
The impact of thermal comfort in the perceived level of service
and energy costs of three Brazilian airports
[O impacto do conforto térmico no nível de serviço percebido e nos custos de energia de três aeroportos brasileiros]
Introduction
The thermal comfort conditions were evaluated in three major Brazilian airports, as they reached their capacities and air transportation still grows since the ticket prices are attractive. The energy consumption of an air-conditioning system inside the passenger terminal building can reach 20% of the total energy consumption in the airport site, influenced by the edification’s constructive characteristics and local climate.
By characterizing and analyzing temperatures and relative humidity conditions in specific areas of passenger terminal buildings, the impact of constructive parameters on the thermal comfort of these environments are to be exposed. The data collected provided information for a psychrometric chart, which shows the adequate indoor thermal condition in all three airports and in each season. Such conditions are examined at three international airports of Southeast Brazil: Guarulhos International Airport, Viracopos – Campinas International Airport and Confins – Belo Horizonte International Airport, which had a significant increase in their demand, over 20 % only in the year 2010.
In order to achieve thermal comfort international standards inside airports overcrowd
facilities, it is required more work from the air conditioning systems than initially estimated. Thus electric power consumption required to perform such work is greater than the design expectation (Kehuen, Ramsey and Threlkeld, 1998, and Jones, 2003), raising the energy consumption and its costs. It is noteworthy that the costs and work required to cool an internal environment are higher than the ones to heat it; the process of cooling an environment is four times more expensive than warming it (Jones, 2003). In a recent study, Meng et al (2009) revealed that the use of about 10% to 30% of natural ventilation for thermal environment inside the airport terminal building can reduce the energy consumption of the air conditioning system from 40% to 60% per year.
Foster and Partners), Zürich International Airport, among others, are examples of old and new constructions that make use of renewable resources to support traditional air-conditioning systems.
To offer adequate indoor conditions to its users and meet energy efficiency goals, mitigating measures have been applied in some Brazilian airports, either by replacing old equipment for more efficient ones that consume less energy, as well as amendments and expansions on the building’s original projects. Some constructive parameters and additional options to avoid unnecessary expenditures are applied in old and new airports terminal buildings, such as, the use of natural lighting through transparent materials that allow daylight entrance, adequate ventilation, the use of photovoltaic plates for electric power generation (Rüther and Braun, 2009), or simply, a systematic maintenance of operating air conditioning systems. Thus, achieving better thermal comfort for its occupants, and reallocating economic resources to critical sectors in need of short term investments.
The following section presents the methods used for measurements and records at each airport, subsidizing a first analysis. In Section 3 the functionality, refrigerating systems, and the characteristics of each case studied are addressed. The subsequent Section presents the
data collected and its outcome with the first results, generated throughout the characterization of the three airports, which grounded the final comments about the quality of thermal comfort generated in two distinct environments, one artificially air-conditioned and the other, designed
with guidelines to provide internal thermal comfort simply relying on its constructive parameters and local climate.
1. Thermal comfort in the Airport Passenger Terminal
sunlight, that the use of lamps during the day is minimized by means of naturally lightening the environment (Roméro, 2009).
Human thermal comfort conditions rely on the combination of factors such as temperature, air humidity, taking place activities, occupants’ garments and the building’s constructive characteristics (Kuehn, Ramsey and Trelkeld, 1998; Frota and Shiffer, 2009). A building thermal performance must meet its occupant’s needs, in order to determine thermal comfort conditions, the comprehension of passengers and staff’s comfort requirements inside the Airport Terminal Passenger (ATP) along the region climatic conditions are essential. To provide a fair condition so occupants may sense the adequate thermal comfort, temperature swings must be the least inside air conditioned environments (Frota and Schiffer, 2009). The humidity, i.e. in the mixing air-water vapor present in artificial air-conditioning processes is responsible for reducing or enhancing the heat sensation perceived by the human body.
The APT building is the first airport component that arouses its occupant’s perceptions of level of service, comfort, safety and efficiency, as well as the first and the last contact from a passenger with a city or a foreign country. As an intermediate element must lead the passengers from land side to the air side, and vice versa, and differently diverging the
impression given by the concept of a transitional component, it is a waiting place for a flight, or for someone arriving from a trip, as well as a workplace. From this point of view it is conceivable how occupants’ comfort is associated to the service quality offered inside the Airport.
2. Methodology
This section presents the airports’ areas where the thermal comfort was evaluated, the sort of measures registered, the equipment used for it, how and when they were made. And also, a brief explanation of how to get the correct information on a psychrometric chart, to provide human thermal comfort inside the chosen environment.
information about energy consumption, acclimatization systems implemented, and mitigating actions taken to decrease costs from energy consumption at the Airports.
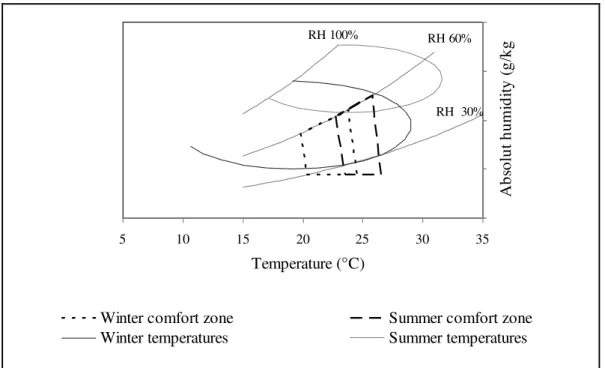
The tools used were a digital thermo-hygrometer for measurements of temperature and relative humidity (Cole Parmer cat. No.37950-10), a digital camera to capture constructive details, when authorized by the airport authorities and two tables for detailed information such as the occupancy capacity, constructive characteristics and materials. In addition to the measurements registered, its table presents the specific date, time, and the exact location of the registers in each component. The temperature and relative humidity from outside of the building were also registered to base the construction of a psychrometric chart, presented on Figure 1.
RH 60%
RH 30% RH 100%
5 10 15 20 25 30 35
Temperature (°C)
A
b
so
lu
t
h
u
m
id
it
y
(
g
/k
g
)
Winter comfort zone Summer comfort zone
Winter temperatures Summer temperatures
Figure 1 - Psychrometric chart for Viracopos International Airport1
The comfort zones on Figure 1 are the two square dashed areas where the temperatures should be so the human body does not feel any thermal discomfort. According to the American
Society of Heating, Refrigerating and Air Conditioning Engineers (ASHRAE) international standards, during the winter the temperatures should range from 20°C to 25°C, and during the summer, from 22°C to 26°C. For Campinas, the city where Viracopos is sited, on winter time most of the temperatures seem to be inside the thermal comfort zones, so no extra effort is
1
required from the air conditioning systems. But during summer, the current temperatures are most of the time out of the comfort zone.
One single day was used to register the temperature and humidity in each airport. One hour interval was expended in each component, along the morning, afternoon end early evening. First measurement were taken in the morning, from approximately 9:00AM to 11:00AM, the second one, in the afternoon from approximately 2:00PM to 4:00PM, and the third at the early evening, from 6:00PM to 8:00PM approximately.
Inside the facilities studied where its occupants are doing light activities; as seated, standing or walking around, it was expected to register temperatures according to the American Society of Heating, Refrigerating and Air Conditioning Engineers (ASHRAE) - Fundamentals (2009) comfort chart, where the temperature for human thermal comfort should be between
22oC and 26°C.
3. The case studies
The criteria used to select airports’ passenger terminals relied among its annual capacity, its importance in the national economic scenario, and their process of expansion to accommodate its passengers growing demand. Located in Southeast Brazil, region responsible for the largest
GDP percentages, IBGE 2011, the chosen objects are the International Airport of São Paulo – Guarulhos (GRU), the International Airport of Viracopos – Campinas (VCP), and the International Airport of Confins – Belo Horizonte (CNF).
Table 1- Airport data2
GRU VCP CNF
no of passenger terminals 2 1 1
present annual capacity* _ 6.8 M 10 M
passenger terminal area (m2) 180,000 34,600 60,000
passenger movement (2010) 27 M 5.5 M 8 M
no check – in counters 260 32 52
no of passenger peak hour 13,500 2,750 5,000
% increase PAX (2010/09) 24% 60% 29%
In all the three case studies of this research, the minimum area dimensions provide a fair comfort to its occupants. However as International Airports and the current growing demand, a level of service B would be more appropriate for its more generous dimensions. Such enhance could increase the passengers’ satisfaction with the quality of services offered in these Airports, influencing the perceived quality level of service. It is relevant to state the difference between the levels of service offered, which is estimated throughout the design process, and the perceived level of service which is more subjective. According to FAA – Federal Aviation Agency, and the Brazilian civil aviation agency, ANAC –Agência Nacional de Aviação Civil, to achieve a B level of service, these terminal areas and number of check – in positions, assuming a time of attendance of two minutes per passenger, must be improved to at least capacity levels shown in Table 2.
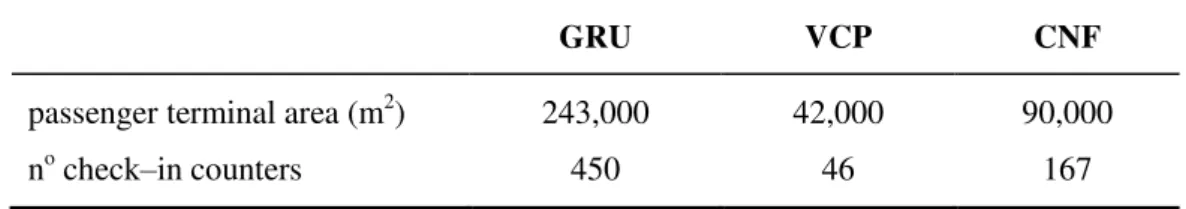
Table 2 - Expansions for Airports’ adequate level of service B3
2
Source: INFRAERO 3
Source: the authors, with own calculations.
GRU VCP CNF
passenger terminal area (m2) 243,000 42,000 90,000
As the constructions of these Airports age at least two decades, improvements at the APTs areas must be done, in order to provide an adequate B level of service. These buildings expansions are appropriate to offer its occupants a more comfortable place to stay, to work and to accommodate the increasing passenger demand.
These three edifications were built with reinforced concrete. In both GRU and VCP, the air circulation is made thought the air conditioning systems, which operates continuously. Particularly in Guarulhos, it works 24h a day, 365 days a year. At the two APTs mentioned in this paragraph, few skylights were designed, and constructive elements such as great openings or windows were not, thus natural air flows enter eventually when the entry and exit doors open. It is relevant to mention that the few skylights in GRU do not provide enough sun light, and there are not enough lamps and lights. Consequently it became a dark building, especially at the check-in concourse areas, the sitting lounges, and the arrival hall.
Viracopos skylight’s material was recently replaced by new ones, improving its lighting efficiency by providing an adequate amount of natural light inside the areas where placed.
In terms of natural ventilation and illumination, the check–in and lounge areas in Confins Airport are privileged, since there are no barriers for the natural flows of wind, such as wall
on the main facade. Though, lamps and lights are turned on even during the day, when not needed, tending to increase energy costs.
3.1 Data
The official visit to Confins - Tancredo Neves International Airport took place on May 30th 2011, Brazilian late fall, the average temperature registered inside the passenger terminal’s components were 3°C below the average temperature registered outside the airport that day; by the Brazilian Institute of Space Research, (INPE) – Instituto Nacional de Pesquisas Espaciais.
The temperatures along the day inside the facilities of Viracopos International Airport were higher than outside the building, where the relative air humidity was too low, reaching 19% at 9:00 AM, and the average temperature as around 15°C, on the last month of winter, and with considerably low for winter temperatures, around 18°C, in Viracopos’ city, Campinas. The peculiar weather might have influenced the results, so the psychrometric chart built for this airport did not correspond to an usual situation. This oddness can be better seen on Section 3.2., where all the charts are presented and can be compared.
As mentioned on Section 3 the air conditioning system at Guarulhos International Airport operates 24 hours a day, thus the temperature and humidity were intrinsically known. The measurements showed a 40% RH, but the temperatures were different than expected, oscillating between 19oC e 23oC, depending where and when they were measured;
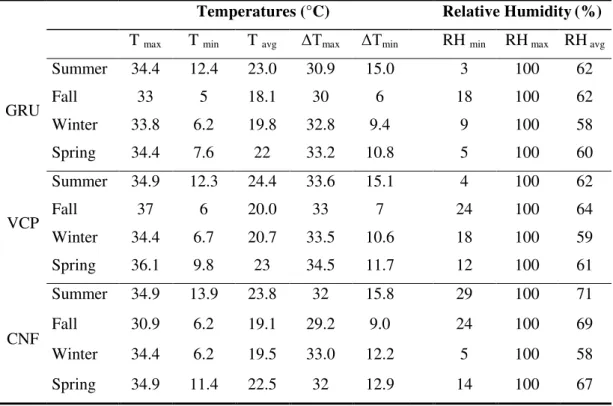
Table 3 - Five year compiled temperatures and humidity at the sites4
Temperatures (°C) Relative Humidity(%)
T max T min T avg ΔTmax ΔTmin RH min RH max RH avg
GRU
Summer 34.4 12.4 23.0 30.9 15.0 3 100 62
Fall 33 5 18.1 30 6 18 100 62
Winter 33.8 6.2 19.8 32.8 9.4 9 100 58
Spring 34.4 7.6 22 33.2 10.8 5 100 60
VCP
Summer 34.9 12.3 24.4 33.6 15.1 4 100 62
Fall 37 6 20.0 33 7 24 100 64
Winter 34.4 6.7 20.7 33.5 10.6 18 100 59
Spring 36.1 9.8 23 34.5 11.7 12 100 61
CNF
Summer 34.9 13.9 23.8 32 15.8 29 100 71
Fall 30.9 6.2 19.1 29.2 9.0 24 100 69
Winter 34.4 6.2 19.5 33.0 12.2 5 100 58
Spring 34.9 11.4 22.5 32 12.9 14 100 67
Airport sites five year temperatures allowed the design of three psychrometric charts that provide information about each comfort zones and registered temperatures, as presented on Figure 2. Figures 3, 4 and 5 present the official visits’ temperatures inside the APT.
3.2 Results
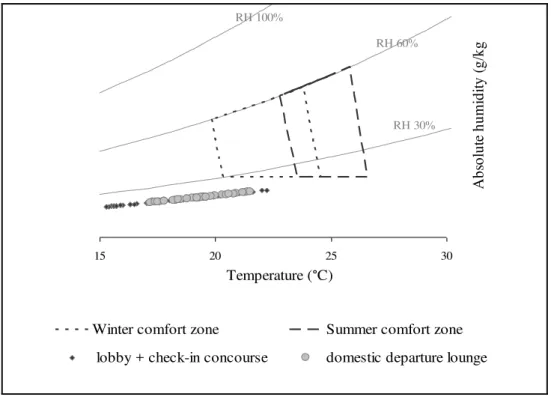
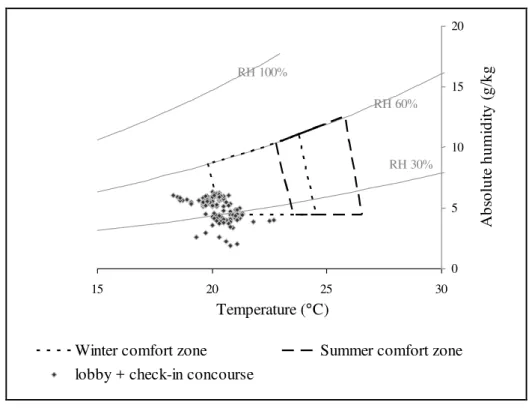
The majority of the registers sowed temperatures below the accepted for the winter thermal comfort, according to international standards. Registered temperatures and humidity throughout the day, presented a little difference even with distinct occupation levels, in the main lounges at the three Airports. Although, passengers’ movement on the visits dates was not great enough to result significant temperature swings inside the facilities. The psychrometric chart on Figure 2 present the absence of thermal comfort in the facilities at Viracopos because of the dry weather, that particular day. Figures 3 and 4 show a more realistic scenario which might represent the usual situation at Viracopos.
RH 100%
RH 60%
RH 30%
15 20 25 30
Temperature (°C)
A b so lu te h u m id it y ( g /k g )
Winter comfort zone Summer comfort zone
lobby + check-in concourse domestic departure lounge
Figure 2 - Registered temperatures on August 8, 2011 - VCP5
RH 100%
RH 60%
RH 30%
15 20 25 30 35
Temperature (°C)
A bs ol ut hum idi ty ( g/ kg) 0 5 10 15 20
winter comfort zone summer comfort zone
domestic departure lounge lobby+check-in concourse
Figure 3 - Registered temperatures on May 30, 2011 - CFN6
5
Source: the authors. 6
Confins and Guarulhos presented both some registers out of the Winter comfort zone, that can result in thermal discomfort when dwell time is greater than expected. Even though, the indoor thermal conditions can be considered adequate for the occupants.
RH 100%
RH 60%
RH 30%
15 20 25 30
Temperature (°C)
A
b
so
lu
te
h
u
m
id
it
y
(
g
/k
g
)
0 5 10 15 20
Winter comfort zone Summer comfort zone lobby + check-in concourse
Figure 4 - Registered temperatures on August 25, 2011 - GRU7
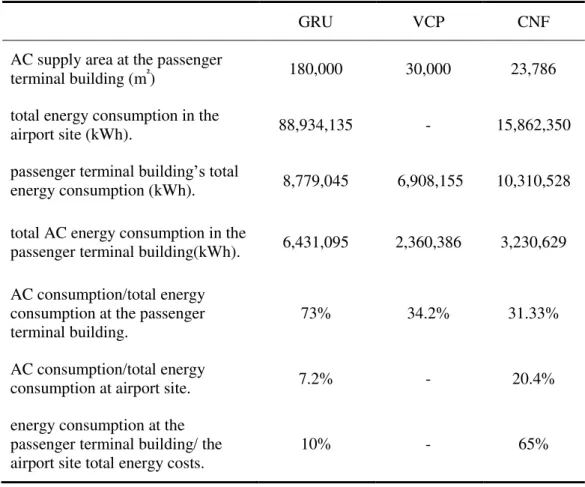
Table 4, presents on the last two lines, the Airports’ air conditioning systems efficiency. GRU, the busiest cargo, mail and passenger Airport in Brazil has the largest area supplied by the air conditioner (AC). As a barely sealed edification the AC expenses mean a great part of the total energy cost inside the building, but the ratio of the passenger terminal building over the total energy consumption in the site is the lowest when compared with CNF; VCP’s data of total energy consumption in the airport site were not available, for this reason the ratio of AC consumption /total site energy consumption were not made.
Even though GRU’s building dimensions are 7.5 times larger than CNF’s, and 6 times larger than VCP’s, the AC systems’ efficiency revealed that GRU’s has the most adequate cost benefit, when compared with the two other Airports.
Confins presented a high ratio of AC consumption over the total site consumption. The total energy consumption at the APT is 17% higher than in Guarulhos’. A motivating fact to mention is that, at CNF there are considerably more lights and lamps than in GRU, and it is a possible reason for its higher energy consumption.
Table 4 - Energy consumption at the studied Airports, 20108
GRU VCP CNF
AC supply area at the passenger
terminal building (m²) 180,000 30,000 23,786
total energy consumption in the
airport site (kWh). 88,934,135 - 15,862,350
passenger terminal building’s total
energy consumption (kWh). 8,779,045 6,908,155 10,310,528
total AC energy consumption in the
passenger terminal building(kWh). 6,431,095 2,360,386 3,230,629
AC consumption/total energy consumption at the passenger terminal building.
73% 34.2% 31.33%
AC consumption/total energy
consumption at airport site. 7.2% - 20.4%
energy consumption at the passenger terminal building/ the airport site total energy costs.
10% - 65%
Mitigating programs and procedures to rationalize energy consumption where adopted in all three Airports, but Confins’ APT electricity expenses still represent a substantial amount of the total energy costs at the Airport site. While at Guarulhos the expenses of energy consumption at the APT represents a small part of the total site’s energy costs.
8
Conclusion
The thermal comfort offered at GRU, VCP and CNF airports was evaluated, and the data analyzed, in these research, showed how constructive types and parameters impact comfort inside the Airports Passenger Terminal buildings. All the facilities with a 24h artificially air conditioned presented on the official visits days temperatures below the thermal comfort accepted levels. In a situation of long period exposure, as waiting for a delayed flight, will cause thermal discomfort to its occupants, and diminish their satisfaction toward the Airports quality level of service.
As in the single facility were used natural processes of air conditioning, the ticketing and check-in lobby at Confins International Airport, most part of the day, thermal comfort was adequate to its passengers and staff. It expresses the significance of the design and planning processes of a passenger terminal area. The correct sun orientation of the building and materials used can contribute to lower energy consumption and an acceptable comfort to its occupants.
A relevant factor to point out is the elevated energy consumption. Even with the mitigating
References
Alucci, M. P. (1993) Conforto térmico, conforto luminoso e conservação de energia elétrica – procedimentos para desenvolvimento e avaliação de projeto de edificações. Thesis (PhD), University of São Paulo, São Paulo.
Frota, A. B. (1989) Ventilação de edifícios industriais. Thesis (PhD), University of São Paulo, São Paulo.
Frota, A. B, and Schiffer, S. R. (2009) Manual do conforto térmico. São Paulo: Studio Nobel.
Hertz, J. B. (2003) Ecotécnicas em Arquitetura – Como projetar nos trópicos úmidos do Brasil. São Paulo: Pioneira Thomson Learning.
Kuehn, T. H., Ramsey, J. W. and Threlkeld, J. L. (1998) Thermal Environmental Engineering. 3rd edition. Upper Saddle River: Prentice-Hall Inc.
Jones, W. P. (2003) Air conditioning engineering. 5th edition, Butterworth-Heinmann: UK.
Meng, Q., Li, Q., Zhao, L., Chen, Z., Chen, Y. and Wang, S. (2009) A case study of thermal environment in airport terminal building under natural ventilation. Journal of Asian Architecture and Building Engineering, vol. 8, pp. 221-227.
Roméro, M. A. (2009) Construções industriais eficientes no uso da energia – uma visão sobre as possibilidades na construção e no retrofit. 6o Congresso Brasileiro sobre Eficiência Energética, São Paulo.