Key words: holidays, econometrics, airfares.
Palavras-Chave: feriados, econometria, tarifas aéreas.
Recommended Citation
Research Directory
Submitted 14 Jun 2012; received in revised form 21 Aug 2012; accepted 5 Sep 2012
Econometric analysis to estimate the impact
of holidays on airfares
[Análise econométrica para estimar o impacto dos feriados nas tarifas aéreas]
Instituto Tecnológico de Aeronáutica (ITA), Brazil
Helena Póvoa*, Alessandro V. M. Oliveira
Abstract
The number of air transportation passengers during the holidays in Brazil has grown notably since the late nineties. One of the reasons is greater competition in airfares made possible by economic liberalization. This paper presents an econometric model of airline pricing aiming at estimating the impacts of holiday periods on fares, with special emphasis on three-day holiday events. It makes use of a database with daily collected data from the internet between 2008 and 2010 for the major Brazilian city, São Paulo. The econometric panel data model employs a two-way error components “within” estimator, controlling for airline/airport-pair fixed effect along with quotation and departure months effects. The decomposition of time effects between quotation and departure month effects is the main methodological contribution of the paper. Results allow for a comparative analysis of the performance of São Paulo’s downtown and international airports - respectively, Congonhas (CGH), and Guarulhos (GRU) airports. As a result, the price of tickets bought 60 days in advance for flights with two stops leaving from the downtown airport fell by most.
Resumo
O número de passageiros de transporte aéreo durante feriados no Brasil cresceu notavelmente, sobretudo a partir dos anos noventa. Uma das razões é maior concorrência em preços, possibilitada pela liberalização econômica. Este trabalho apresenta um modelo econométrico de preços das companhias aéreas com o objetivo de estimar os impactos de períodos de feriados sobre os preços, com especial ênfase em eventos de feriados de três dias. O modelo utiliza um banco de dados com tarifas coletadas diariamente na Internet entre 2008 e 2010, para a maior cidade brasileira, São Paulo. O modelo econométrico de painel de dados emprega uma estrutura de erro componente de duas vias com um estimador “within”, com o controle de efeitos fixos de companhia aérea, par de cidades, dia e mês da cotação e da partida do voo. A decomposição dos efeitos de tempo entre os efeitos do mês de cotação e de partida é a principal contribuição metodológica do artigo. Os resultados permitem uma análise comparativa do desempenho dos aeroportos paulistanos - respectivamente, os aeroportos de Congonhas (CGH) e Guarulhos (GRU). Como resultado, foi inferido que o preço dos bilhetes comprados com 60 dias de antecedência para vôos com duas paradas que partem do aeroporto central foi o que apresentou maior queda.
Póvoa, H. and Oliveira, A. V. M. (2013) Econometric analysis to estimate the impact of holidays on airfares. Journal of Transport Literature, vol. 7, n. 2, pp. 284-296.
* Email: [email protected].
Introduction
Passenger volume in Brazilian airports during vacations or on business trips has been growing
significantly in recent years. GDP growth, increasing medium household income, the entrance
of new airline carriers, and more competition in prices for some companies are some of the
factors that have contributed to this growth.
This growth can be seen, mainly, at the two largest airports in the state of São Paulo,
Congonhas (IATA code: CGH) – which handles only domestic flights, but near the center of
the city of São Paulo, and Guarulhos (IATA code: GRU) – which handles both domestic and
international flights, 27 km from the center of São Paulo city.
During the holidays, in most airports, the volume of passengers is almost double that on
regular days, and some airlines, such as TAM (Brazil’s market leader) makes extra aircraft
available with more pilots and flight attendants to serve demand. In the larger airports
additional teams of attendants are available, as well as more staff in the stores, on check-in
counters and in ground services to support the passengers and luggage boarding and landing1.
In this context, the present paper aims to show the way airfares react in the holidays. Here we
present an econometric model of airline pricing aiming at estimating the impacts of holiday
periods on fares, with special emphasis on three-day holiday events.
In this context, the present paper aims to show an econometric model of airline pricing in
order to estimate the impacts of holiday periods on fares, with special emphasis on three-day
holiday events.
The study makes use of a database with daily collected fares from the internet between 2008
and 2010 for the major Brazilian city, São Paulo. The econometric panel data model employs
a two-way “within” estimator, controlling for the following fixed effects: airline/airport-pair,
quotation month and departure month. The decomposition of time effects between quotation
and departure month effects is the major contribution of the paper. The motivation for time
1
decomposition is related to the need of controlling for time-varying demand and supply
shocks at both the purchase and the departure date. Results allow for a comparative analysis
of the performance of São Paulo’s downtown and international airports - respectively, Congonhas (CGH), and Guarulhos (GRU) airports. As a result, the price of tickets bought 60
days in advance for flights with two stops leaving from the downtown airport fell by most.
The content of the paper will be presented as follows: Section 1 will survey the literature
available; Section 2, the database source; Section 3, the methodology, and Section 4 will
contain the econometric study. Finally, the analysis of the results and references will be
presented.
1. Empirical modeling of prices
In the literature on air transportation, there has been a considerable number of papers dealing
with price as the dependent variable within an econometric framework. We highlight the
classic work of Morrison and Whinston (1986), Borenstein (1989) and Evans and Kessides
(1993), and, more recently, Hofer, Dresner and Windle (2008). Morrison and Whinston
(1986) studied the impact of US deregulation, reaching the conclusion that liberalization
caused lower fares and better services for passengers. Borenstein (1989) concluded that even
an airline exercising market power and with a big market share in air traffic for a specific
route, did not create an “umbrella effect” that allowed other companies to increase their prices
by the same ratio. Hofer, Dresner and Windle (2008) concluded that low cost carriers do not
practice price premiums and their presence pushed the price premium for big companies
down.
Besides the aforementioned papers, there has been a prolific literature focused on Brazilian
airline pricing using econometric models. For example, Amorim (2007), Todesco et al (2008),
Salgado, Vassallo and Oliveira (2010), Paiva (2012) and Ueda (2012). Some papers make use
of a structural supply-demand approach combined with an econometric model, such as
Lovadine (2009) and Oliveira (2010). Most papers find that increased competition in the
1.1 Data
The database used in this study is formed by daily data on domestic airfares collected from a
major Brazilian consolidator website from May, 5, 2008 to April, 13, 2010. Initially, the
database contained more than 2 million observations. After the implementation of some
procedures of sample selection, the database dropped to 219,907 observations. The following
procedures of delimitation were used: 1. selection of the minimum fare of the same airline for
the same airport-pair and the same quotation and departure date; 2. data from international
flights were dropped; and, finally, 3. only São Paulo airports Congonhas (CGH) and
Guarulhos (GRU) were considered. CGH and GRU are, respectively, the downtown and
international airports of São Paulo, the most populated city in Brazil. GRU is a major gateway
airport of South America.
1.2 Methodology
The econometric model employs a two-way error components, “within” estimator. In
econometrics, and more specifically in panel data analysis, the term “within estimator” is
related to the “fixed effects estimator”, being used to refer to an estimator for the coefficients
in the regression model when unobserved heterogeneity across data units (“entities”) is
controlled for. The model assumes that this heterogeneity is constant over time and correlated
with independent variables. A two-way fixed effects model is represented by the following
regression equation:
it kit k it
it
it x x x
y
0
1 1
2 2 ...
(1)with
it t i
it
u
(2)Where, as with the typical multiple regression model, yit is the dependent variable of the i-th
entity at time t, x1it,x2it,...,xkit are explanatory variables,
0,
1,
2,...,
k, are unknownparameters and it is the error term. The special characteristic of the two-way fixed effects
disturbance term (uit): a time invariant but entity-specific term (
i), a time variant butindividual constant term (
t). We then have the unobserved heterogeneity across entitiesmodeled as i and that each time period is assumed to also have a specific effect on
y
it.In the present econometric framework here, I model the price quotation of a given airline i for
a given airport-pair k on a given quotation day q for a flight on a given departure day d as the
following dependent variable:
p
ikqd. I employ airline-airport-pair fixed effects and thereforecontrol for the heterogeneity in the i-k dimension. In order to control for time effects, I make
use of fixed effects of both the quotation day and the departure day. The decomposition of
time effects between quotation and departure month effects is the major contribution of the
paper. The motivation for time decomposition is related to the need of controlling for
time-varying demand and supply unobserved shocks at both the purchase and the departure date.
These unobserved shocks may be correlated with the regressors and therefore may cause
biased estimation of regression coefficients.
The empirical model has a set of explanatory variables. Below follow some of the variables
that were considered during the regressions.
adv days: is the difference between the ticket’s quotation/purchase day and the boarding day (source: );
nstop: a dummy variable of non-stop flight (source: regulator – Anac’s Hotran reports);
usd: the US dollar – Brazilian real exchange rate (USD/BRL) – a cost shifter, as aviation fuel is usually quoted in dollars (source: Ipeadata’s website);
fin crisis: the dummy variable that represents the world financial crisis, from October 2008;
azul: entrance of the Brazilian airline Azul to the market, in 2009 (source: regulator –
Anac’s Hotran reports);
conn pax: number of passengers in connection (source: Infraero);
nairlines a-pair: number of airlines by pair airport (source: regulator –Anac’s Hotran reports);
nairlines adj-pair: number of airlines by pair adjacent airport (source: regulator –
Anac’s Hotran reports);
nairlines airp-o: number of airlines by airport of origin (source: regulator – Anac’s Hotran reports).
Holiday-specific dummy variables were also employed:
9-jul: Revolution Day in São Paulo;
anivsp: Founding of São Paulo;
ano novo: New Year's Day;
aparecida: Patron Saint of Brazil;
chorpus: Corpus Christi;
consnegra: Black Awareness Day;
finados: All Souls' Day;
independ: Independence Day;
natal: Christmas Day;
pascoa: Easter Day;
tiradent: Tiradentes Memorial Day;
1.3 Econometric study
As a parameter in the main analyses, the following characteristics were considered: 3-day
holidays, non-stop flights, flights with one stop, and flights with two stops. Table 1 presents
the first estimation results, correlating the variables below and the variables cited in the
previous section:
Advance quotation/purchase on the eve of the holiday (hday qut eve);
Advance quotation/purchase in the holiday (hday quote n of days);
Advance quotation/purchase after the beginning of the holiday (hday qut post);
Ticket price for departure on the eve of the holiday (hday dept eve);
Ticket price for departure on the holiday (hday dept n of days);
Ticket price for departure after the beginning of the holiday (hday dept post).
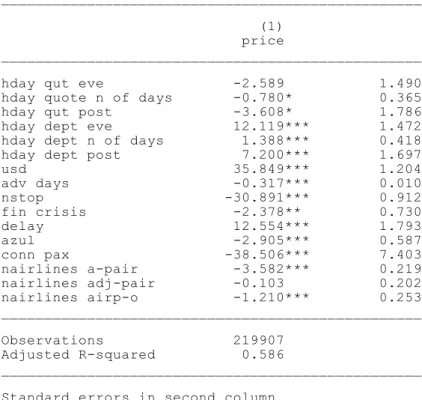
Table 1 – Base case regression results
_________________________________________________
(1) price _________________________________________________
hday qut eve -2.589 1.490 hday quote n of days -0.780* 0.365 hday qut post -3.608* 1.786 hday dept eve 12.119*** 1.472 hday dept n of days 1.388*** 0.418 hday dept post 7.200*** 1.697 usd 35.849*** 1.204 adv days -0.317*** 0.010 nstop -30.891*** 0.912 fin crisis -2.378** 0.730 delay 12.554*** 1.793 azul -2.905*** 0.587 conn pax -38.506*** 7.403 nairlines a-pair -3.582*** 0.219 nairlines adj-pair -0.103 0.202 nairlines airp-o -1.210*** 0.253 _________________________________________________
Observations 219907 Adjusted R-squared 0.586 _________________________________________________
According to Table 1, the airfares for departure on the eve of a holiday had the highest
percentage increase, of 12.1%, while the highest percentage reduction in price was for
quotation/purchase after the beginning of the holiday, of -3.6%.
Following the results obtained by the regression in Table 1, the pre-defined situations cited
previously were employed. They are (i) 3-day holidays, (ii) non-stop flights, (iii) flights with
one stop and (iv) flights with two stops.
To obtain the results in Table 2, three regressions were run separately. In the first, Guarulhos
and Congonhas airports were considered; in the second, only Guarulhos airport was
considered, and in the third, only Congonhas airport was considered. These regressions were
then put together to be analyzed, as shown in Table 2 (in this table only non-stop flights were
considered).
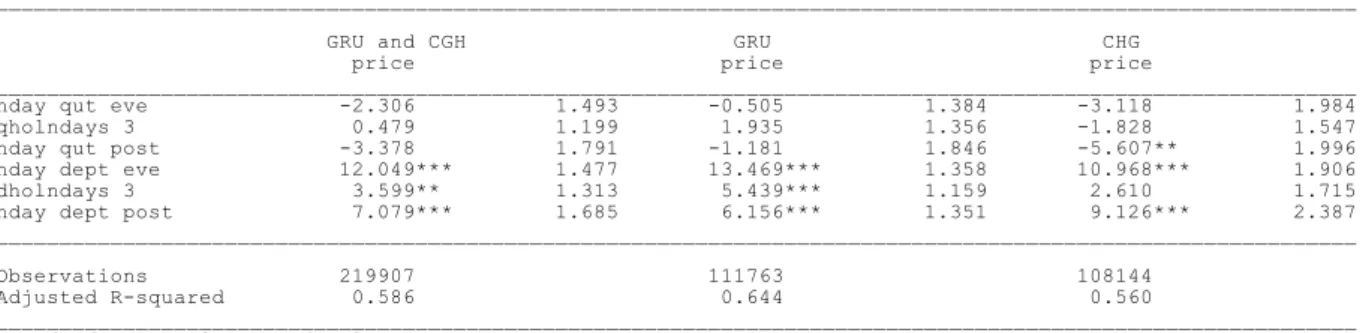
Table 2 – Non-stop flight regression results
___________________________________________________________________________________________________________
GRU and CGH GRU CHG price price price ___________________________________________________________________________________________________________ hday qut eve -2.306 1.493 -0.505 1.384 -3.118 1.984 qholndays 3 0.479 1.199 1.935 1.356 -1.828 1.547 hday qut post -3.378 1.791 -1.181 1.846 -5.607** 1.996 hday dept eve 12.049*** 1.477 13.469*** 1.358 10.968*** 1.906 dholndays 3 3.599** 1.313 5.439*** 1.159 2.610 1.715 hday dept post 7.079*** 1.685 6.156*** 1.351 9.126*** 2.387 ___________________________________________________________________________________________________________
Observations 219907 111763 108144 Adjusted R-squared 0.586 0.644 0.560 ___________________________________________________________________________________________________________ Standard errors in second column
* p<0.05, ** p<0.01, *** p<0.001
Table 2 highlights Congonhas airport, with a higher reduction in ticket prices for advance
quotation/purchase after the beginning of the holiday (hday qut post), of -5.6%, being more
attractive than in Guarulhos airport, which was -1.1%.
When both airports were analyzed together (column “GRU and CGH”), the highest
percentage reduction was maintained for quotation/purchase after the beginning of the
holiday, at -3.3%.
For departures on the eve of the holiday (hday dept eve), in the holiday (dholndays 3), and
after the beginning of the holiday (hday dept post), in both airports ticket prices were
significantly increased.
Table 3 – One-stop flight regression results
___________________________________________________________________________________________________________
GRU and CGH GRU CHG price price price ___________________________________________________________________________________________________________ hday qut eve -2.362 1.613 -0.487 1.433 -3.369 2.266 qholndays 3 0.438 1.188 1.885 1.361 -1.667 1.580 hday qut post -3.195 1.991 -1.113 1.942 -5.479* 2.300 hday dept eve 12.054*** 1.474 13.512*** 1.364 11.076*** 1.921 dholndays 3 3.795** 1.323 5.627*** 1.169 2.833 1.733 hday dept post 7.073*** 1.696 6.160*** 1.361 9.060*** 2.408 ___________________________________________________________________________________________________________
Observations 219907 111763 108144 Adjusted R-squared 0.573 0.638 0.549 ___________________________________________________________________________________________________________ Standard errors in second column
* p<0.05, ** p<0.01, *** p<0.001
In Table 3, again, Congonhas airport was highlighted, with the highest reduction in ticket
prices for advance quotation/purchase after the beginning of the holiday (hday qut post).
When Guarulhos and Congonhas were analyzed together, the percentage reduction for
advance quotation/purchase after the beginning of the holiday remained higher.
For departures on the eve of the holiday (hday dept eve), on the day of the holiday (dholndays
3) and after the beginning of the holiday (hday dept post), in both airports the ticket prices
kept growing, varying from 3.8% to 12.0%.
In Table 4 only flights with two stops were considered.
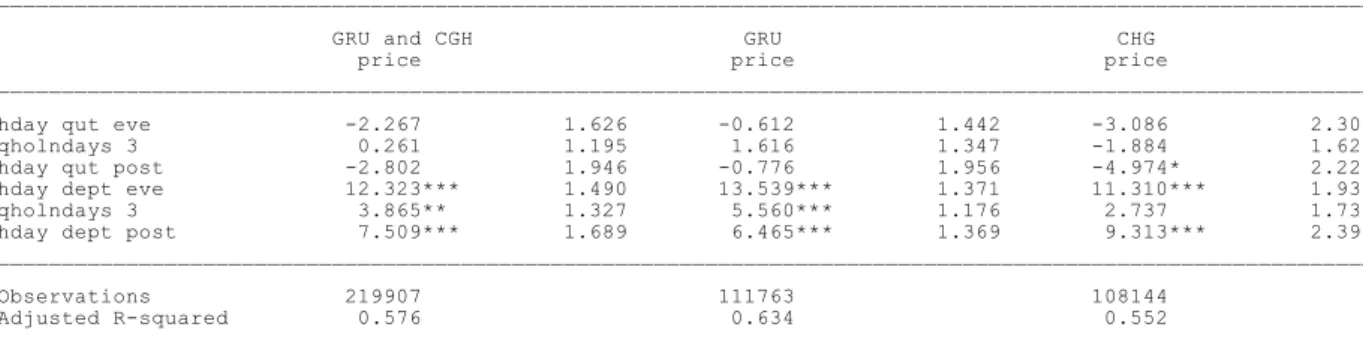
Table 4 – Two-stop flight regression results
___________________________________________________________________________________________________________
GRU and CGH GRU CHG price price price ___________________________________________________________________________________________________________
hday qut eve -2.267 1.626 -0.612 1.442 -3.086 2.306 qholndays 3 0.261 1.195 1.616 1.347 -1.884 1.622 hday qut post -2.802 1.946 -0.776 1.956 -4.974* 2.222 hday dept eve 12.323*** 1.490 13.539*** 1.371 11.310*** 1.935 qholndays 3 3.865** 1.327 5.560*** 1.176 2.737 1.732 hday dept post 7.509*** 1.689 6.465*** 1.369 9.313*** 2.395 ___________________________________________________________________________________________________________
Observations 219907 111763 108144 Adjusted R-squared 0.576 0.634 0.552 ___________________________________________________________________________________________________________ Standard errors in second column
* p<0.05, ** p<0.01, *** p<0.001
Table 4 did not show any relevant variations, in line with the results in Tables 2 and 3,
Congonhas airport kept providing the highest reductions, in percentages, for the price of
tickets compared with Guarulhos airport.
In the advance quotation/purchase on the eve of the holiday (hday qut eve), flights with one
stop offered the best percentage reduction. Otherwise, the best option for quotation/purchase
When Guarulhos and Congonhas airports were analyzed together, the highest percentage
reduction in ticket prices was for advance quotation/purchase after the beginning of the
holiday and for non-stop flights.
In the next regressions almost all the Brazilian holidays were included. The parameter was for
quotation/purchase varying from 3 (three) to 60 (sixty) days in advance to the holiday. As a
point of comparison, the baseline was for quotation/purchase 1 (one) day in advance.
The impacts on ticket prices can be observed by holiday (Carnival was not considered, as it is
the longest holiday in Brazil, at 5 days). In Table 5 the results for non-stop flights can be seen.
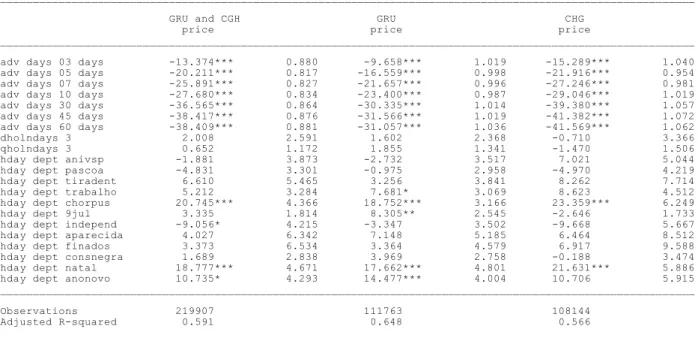
Table 5 - Non-stop flight regression results
___________________________________________________________________________________________________________
GRU and CGH GRU CHG price price price ___________________________________________________________________________________________________________
adv days 03 days -13.374*** 0.880 -9.658*** 1.019 -15.289*** 1.040 adv days 05 days -20.211*** 0.817 -16.559*** 0.998 -21.916*** 0.954 adv days 07 days -25.891*** 0.827 -21.657*** 0.996 -27.246*** 0.981 adv days 10 days -27.680*** 0.834 -23.400*** 0.987 -29.046*** 1.019 adv days 30 days -36.565*** 0.864 -30.335*** 1.014 -39.380*** 1.057 adv days 45 days -38.417*** 0.876 -31.566*** 1.019 -41.382*** 1.072 adv days 60 days -38.409*** 0.881 -31.057*** 1.036 -41.569*** 1.062 dholndays 3 2.008 2.591 1.602 2.368 -0.710 3.366 qholndays 3 0.652 1.172 1.855 1.341 -1.470 1.506 hday dept anivsp -1.881 3.873 -2.732 3.517 7.021 5.044 hday dept pascoa -4.831 3.301 -0.975 2.958 -4.970 4.219 hday dept tiradent 6.610 5.465 3.256 3.841 8.262 7.714 hday dept trabalho 5.212 3.284 7.681* 3.069 8.623 4.512 hday dept chorpus 20.745*** 4.366 18.752*** 3.166 23.359*** 6.249 hday dept 9jul 3.335 1.814 8.305** 2.545 -2.646 1.733 hday dept independ -9.056* 4.215 -3.347 3.502 -9.668 5.667 hday dept aparecida 4.027 6.342 7.148 5.185 6.464 8.512 hday dept finados 3.373 6.534 3.364 4.579 6.917 9.588 hday dept consnegra 1.689 2.838 3.969 2.758 -0.188 3.474 hday dept natal 18.777*** 4.671 17.662*** 4.801 21.631*** 5.886 hday dept anonovo 10.735* 4.293 14.477*** 4.004 10.706 5.915 ___________________________________________________________________________________________________________
Observations 219907 111763 108144 Adjusted R-squared 0.591 0.648 0.566 ___________________________________________________________________________________________________________ Standard errors in second column
* p<0.05, ** p<0.01, *** p<0.001
Table 5 presents, in its first column, values found for the analysis of GRU and CGH, together.
For quotation/purchase 3 (three) to 60 (sixty) days in advance of the holiday, the results were
quite significant for the analysis of p-value, showing that the highest reduction in percentage
terms for the ticket price was obtained for purchases 45 days in advance of the departure date,
Corpus Christi and the Christmas holidays saw an increase in ticket price due the high
demand for traveling at this time. Brazil’s Independence Holiday (on Sept. 7th
) saw a lower
but important reduction (in percentage terms) in the ticket price, probably due to the fact that
it is the first holiday after the winter vacation in Brazil (in July).
The following table considered only flights with one stop.
Table 6 – One-stop flight regression results
___________________________________________________________________________________________________________
GRU and CGH GRU CHG price price price ___________________________________________________________________________________________________________
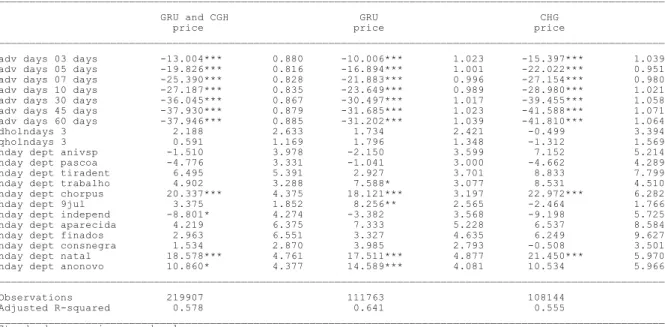
adv days 03 days -13.004*** 0.880 -10.006*** 1.023 -15.397*** 1.039 adv days 05 days -19.826*** 0.816 -16.894*** 1.001 -22.022*** 0.951 adv days 07 days -25.390*** 0.828 -21.883*** 0.996 -27.154*** 0.980 adv days 10 days -27.187*** 0.835 -23.649*** 0.989 -28.980*** 1.021 adv days 30 days -36.045*** 0.867 -30.497*** 1.017 -39.455*** 1.058 adv days 45 days -37.930*** 0.879 -31.685*** 1.023 -41.588*** 1.071 adv days 60 days -37.946*** 0.885 -31.202*** 1.039 -41.810*** 1.064 dholndays 3 2.188 2.633 1.734 2.421 -0.499 3.394 qholndays 3 0.591 1.169 1.796 1.348 -1.312 1.569 hday dept anivsp -1.510 3.978 -2.150 3.599 7.152 5.214 hday dept pascoa -4.776 3.331 -1.041 3.000 -4.662 4.289 hday dept tiradent 6.495 5.391 2.927 3.701 8.833 7.799 hday dept trabalho 4.902 3.288 7.588* 3.077 8.531 4.510 hday dept chorpus 20.337*** 4.375 18.121*** 3.197 22.972*** 6.282 hday dept 9jul 3.375 1.852 8.256** 2.565 -2.464 1.766 hday dept independ -8.801* 4.274 -3.382 3.568 -9.198 5.725 hday dept aparecida 4.219 6.375 7.333 5.228 6.537 8.584 hday dept finados 2.963 6.551 3.327 4.635 6.249 9.627 hday dept consnegra 1.534 2.870 3.985 2.793 -0.508 3.501 hday dept natal 18.578*** 4.761 17.511*** 4.877 21.450*** 5.970 hday dept anonovo 10.860* 4.377 14.589*** 4.081 10.534 5.966 ___________________________________________________________________________________________________________
Observations 219907 111763 108144 Adjusted R-squared 0.578 0.641 0.555 ___________________________________________________________________________________________________________ Standard errors in second column
* p<0.05, ** p<0.01, *** p<0.001
Table 6 shows results closer to those in Table 5. Nevertheless, when GRU and CGH are taken
together they present the highest reduction in the ticket price for quotation/purchase 60 (sixty)
days in advance of the holiday. In the Corpus Christi, Christmas, and Brazil’s Independence
Day holidays, the behavior was similar to that found in Table 5.
Table 7 – Two-stop flight regression results
___________________________________________________________________________________________________________
GRU and CGH GRU CHG price price price ___________________________________________________________________________________________________________
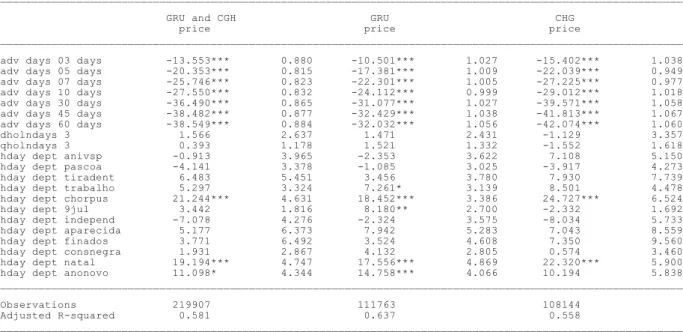
adv days 03 days -13.553*** 0.880 -10.501*** 1.027 -15.402*** 1.038 adv days 05 days -20.353*** 0.815 -17.381*** 1.009 -22.039*** 0.949 adv days 07 days -25.746*** 0.823 -22.301*** 1.005 -27.225*** 0.977 adv days 10 days -27.550*** 0.832 -24.112*** 0.999 -29.012*** 1.018 adv days 30 days -36.490*** 0.865 -31.077*** 1.027 -39.571*** 1.058 adv days 45 days -38.482*** 0.877 -32.429*** 1.038 -41.813*** 1.067 adv days 60 days -38.549*** 0.884 -32.032*** 1.056 -42.074*** 1.060 dholndays 3 1.566 2.637 1.471 2.431 -1.129 3.357 qholndays 3 0.393 1.178 1.521 1.332 -1.552 1.618 hday dept anivsp -0.913 3.965 -2.353 3.622 7.108 5.150 hday dept pascoa -4.141 3.378 -1.085 3.025 -3.917 4.273 hday dept tiradent 6.483 5.451 3.456 3.780 7.930 7.739 hday dept trabalho 5.297 3.324 7.261* 3.139 8.501 4.478 hday dept chorpus 21.244*** 4.631 18.452*** 3.386 24.727*** 6.524 hday dept 9jul 3.442 1.816 8.180** 2.700 -2.332 1.692 hday dept independ -7.078 4.276 -2.324 3.575 -8.034 5.733 hday dept aparecida 5.177 6.373 7.942 5.283 7.043 8.559 hday dept finados 3.771 6.492 3.524 4.608 7.350 9.560 hday dept consnegra 1.931 2.867 4.132 2.805 0.574 3.460 hday dept natal 19.194*** 4.747 17.556*** 4.869 22.320*** 5.900 hday dept anonovo 11.098* 4.344 14.758*** 4.066 10.194 5.838 ___________________________________________________________________________________________________________
Observations 219907 111763 108144 Adjusted R-squared 0.581 0.637 0.558 ___________________________________________________________________________________________________________ Standard errors in second column
* p<0.05, ** p<0.01, *** p<0.001
Table 7 did not present any relevant variations in the results and the analysis was the same
cited for Table 6.
Conclusion
Brazilians are concerned about finding the best price for their air tickets, mainly for the
holidays, but it takes time to visit websites, looking for the best day and time to fly. This
study proposes an approach to the problem using regressions. The results will help end-users
get better knowledge of ticket prices.
During this study, the methodology indicated that for quotation/purchase on the eve of a
holiday, in the holiday, and after the beginning of the holiday, Congonhas airport presented a
higher reduction in the ticket prices than Guarulhos airport.
When Guarulhos and Congonhas airports were analyzed together, the highest percentage
reduction in ticket prices was for advance quotation/purchase after the beginning of the
holiday and for non-stop flights.
The tickets purchased sixty days in advance to the holiday for flights with two stops, when the
References
Amorim, H. C. (2007) A Gol ainda é uma Empresa Low-Fare? Journal of Transport Literature, vol. 1, n. 1, pp. 23-45.
Bilotkach, V. (2005) Understanding Price Dispersion in the Airline Industry: Capacity Constraints and Consumer Heterogeneity. Advances in Airline Economics, Vol. 1.
Borenstein, S. (1989) Hubs and high fares: dominance and market power in the U.S. airline industry.
RAND Journal of Economics, vol. 20, pp. 344-365.
Evans, W. and Kessides, I. (1993) Localized market power in the U.S. airline industry. Review of Economics and Statistics, vol. 75, pp. 66-75.
Ferreira, N. S. (2011) Estudo empírico de práticas predatórias de companhias aéreas. Journal of Transport Literature, vol. 5, n. 3, pp. 89-122.
Fraga, R. e Oliveira, A. V. M. (2009) Distribuição de Slots em Aeroportos: A Experiência Internacional e a Concentração de Frequências de Vôo no Brasil. Journal of Transport Literature, vol. 3, n. 2, pp. 25-46.
Hofer, C., Dresner, M. E., and Windle, R. J. (2008) Price premiums and low cost carrier competition. Transportation Research Part E: Logistics and Transportation Review, vol. 44, n. 5, pp. 864-882.
Lovadine, D. (2009) Análise Econométrica Estrutural da Conduta Competitiva: Estudo de Caso do Transporte Aéreo Pós-Liberalização. Journal of Transport Literature, vol. 3, n. 1, pp. 7-39.
Morrison, S. A. and Whinston, C. (1986) The Economic Effects of Airline Deregulation. Brookings,
Washington, D.C.
Oliveira, A. V. M. (2010) A Alocação de Slots em Aeroportos Congestionados e suas Consequências no Poder de Mercado das Companhias Aéreas. Journal of Transport Literature, vol. 4, n. 2, pp. 5-49.
Paiva, I. (2012) Como as conexões de passageiros nos aeroportos de São Paulo afetam as tarifas oferecidas ao paulistano. Journal of Transport Literature, vol. 6, n. 1.
Salgado, L. H., Vassallo, M. D. e Oliveira, A. V. M. (2010) Regulação, Políticas Setoriais, Competitividade e Formação de Preços: Considerações sobre o Transporte Aéreo no Brasil. Journal of Transport Literature, vol. 4, n. 1, pp. 7-48.
Todesco, F., Lovadine, D., Bettini, H. F. e Vassallo, M. D. (2008) Web Pricing de Companhias Aéreas Durante uma Guerra de Preços: Onde estão os Descontos? Journal of Transport Literature, vol. 2, n. 1, pp. 21-38.
Ueda, T. V. A. (2012c) Partir do aeroporto de Congonhas é mais caro que partir de Guarulhos? Um estudo econométrico dos preços das passagens aéreas. Journal of Transport Literature, vol. 6, n. 3.