This is an Open Access article distributed under the terms of the Creative Commons Attribution Non-Commercial License which permits unrestricted non-commercial use, distribution, and reproduction in any medium provided the original work Received: 01 June, 2017
Accepted: 12 Sep., 2017
E-mails: [email protected] (GTM), [email protected] (SICC), [email protected] (JCV), [email protected] (DAH), [email protected] (ETS), [email protected] (AQB)
Abstract: This study presents KIC data obtained from KIC-CVN correlations from Charpy CVN values. For this study, T-welded connections were manufactured from ASTM A36 and E6013 electrodes in dry conditions. Then, a rectangular grinding at the weld toe was carried out and filled with wet welding. Charpy specimens were extracted to obtain CVN values. An exhaustive search through the literature of several authors was performed to collect experimental CVN data about wet welding being applied to A36 steel for comparison with CVN data obtained in this study. By using Charpy impact energy (CVN), KIC values could be predicted by KIC-CVN correlations. In addition, correlations were presented to obtain KIC values in the lower shelf, transition temperature zones and different zones for the energy-temperature curve of A36 steel. Of these correlations, Barsom’s equation was adopted, because he applied the
stress yield (σYS) of the material and it can be applied in all zones for the energy-temperature
curve. The results revealed that CVN values are proportionate to KIC, this data decreases as water depth increases. This took place because several discontinuities, such as, porosity, slag inclusion, non-metallic inclusion, cracking and microstructures are present in the wet welding.
Keywords: Fracture Toughness (KIC); Charpy impact energy (CVN); Wet welding; A36 Steel; Porosity.
1. Introduction
It´s widely recognized that Charpy CVN impact energy values can be converted to KIC using KIC-CVN correlations [1-7]. In this context, plane-strain fracture toughness (KIC) is an important material property in the prediction and prevention of fracture, and for damage tolerance assessment of brittle materials [8]. The K
IC in the linear elastic fracture
mechanics (LEFM) is the size of the stress intensity factor at the tip of the crack if the strain in the body is elastic. The ASTM E-399 standard [9] is used to obtain K
IC values
in plane-strain for the displacement mode of the opening cracking. However, it is not always possible to prepare such specimens when the analyzed material does not have the proper dimensions [10], even at room temperature, standard tests for K
IC are difficult,
time-consuming and costly [8].
Charpy impact energy CVN is utilized to indirectly estimate CVN data for K
IC values.
Then, to obtain the K
IC values from the CVN data, it is necessary to select the behavior from
CVN impact results, according to the interest zone, σYS of the material and the CVN energy
values. Although this CVN impact test data does not represent the real fracture toughness data, this data can be used as a series of points to estimate toughness in an evaluation of fracture mechanics. Nevertheless, there are studies in the literature about estimating KIC values from correlations of CVN impact data [11-17]. K
IC-CVN correlations available in
published literature are applied to lower-shelf, transition zone and upper-shelf temperatures and are not applicable to wet welding. However, many of these correlations are based on the yield stress (σYS) of the material, Young´s Module (E), and correlations applied to different zones in a Charpy transition temperature curve. Thus, these correlations could be applied to different metals and wet welding.
The purpose of this study was to estimate the fracture toughness (K
IC) of CVN data
from different authors who employed wet welding in A36 steel and compared with CVN values obtained in this study. A36 steel and E6013 electrodes were utilized to construct
Fracture Toughness and Charpy CVN Data for A36 Steel with Wet Welding
Gerardo Terán Méndez1, Selene I. Capula Colindres1, Julio Cesar Velázquez1, Daniel Angeles Herrera2,
Esther Torres Sanillán1, Alexandre Queiros Bracarense3
1 Insituto Politécnico Nacional – IPN, Escuela Superior de Ingeniería Química e Industrias Extracivas – ESIQIE,
Departamento de Ingeniería Química Industrial, Ciudad de México, México.
2 Insituto Mexicano del Petróleo, Ciudad de México, México.
with two depths, 6 mm and 10 mm. The rectangular grinding was filled with wet welding simulating seawater at depths of 50, 70 and 100 m. Standard Charpy specimens were extracted to obtain energy values. In addition, a search of Charpy CVN values using A36 steel and E6013 electrodes was performed with wet welding. Finally, KIC -CVN correlations were presented to measure the fracture toughness.
2. Experimental Procedure 2.1. Wet welding
T-welded connections of A36 steel were manufactured in dry conditions. The T-welded connections were welded employing E6013 electrodes following the procedure detailed by Terán et al. [17,18] and conforming to the
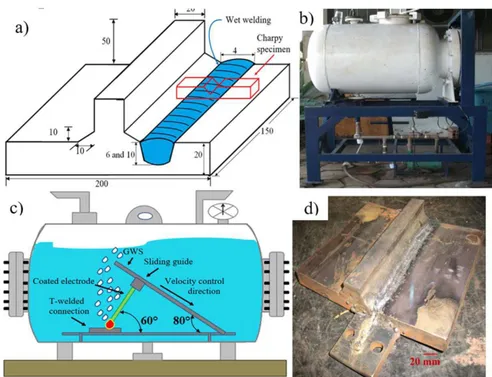
welding procedure specification (WPS) AWS D.1.1/D1.1M code [19]. In Figure 1a, T-welded connections and Charpy specimens are graphically presented. The rectangular grinding was carried out with a manual grinder machine employing 4 mm of width. Two different grinding depths of 6 mm and 10 mm, corresponding to 30% and 50% of the plate thickness, respectively, were carried out at the weld toe of the T-welded connections. Then, underwater wet welding was employed with three different water depths of 50 m, 70 m and 100 m. The wet welding method was done according to [18,20]. A hyperbaric chamber was employed to simulate the water depths, see Figure 1b. Inside of the chamber, a gravity welding system (GWS) was used to fill the rectangular grinding with wet welding, as illustrated in Figure 1c. The E6013 electrodes were used with diameters of 2.4 mm and 3.2 mm and the length of each electrode was 350 mm. The electrodes were coated with vinylic varnish. Variables used in wet welding are presented in Table 1. The polarity was from a direct current. A T-welded connection, after applying wet welding, is presented in Figure 1d.
Figure 1. a) Charpy specimen extraction in T-welded connection, units in mm; b) Hyperbaric chamber; c) Gravity welding system (GWS) inside the chamber; and d) grinding filled with wet welding in T-welded connections.
Table 1. Variables used for testing the wet welding process [18]. Applied current
(Ampers)
Electrode studying angle (Degree)
Electrode diameter (mm)
Water depth (m)
160 60 2.4 and 3.2 50 and 70
To obtain CVN values, standard specimens for Charpy V-noth (CVN) were extracted at the weld toe. Charpy tests were performed at a test temperature of 20 °C. A Charpy model 74 machine with a capacity of 0.0-274 ft-lb conforming to the recommendation of ASTM E23 [21] was employed. Charpy specimen’s dimensions were
10 mm × 10 mm × 55 mm. For each grinding and water depth, three Charpy test were conducted.
2.2. KIC-CVN correlations
A review has been conducted to obtain K
IC-CVN correlations. These were taken into the studying zone in the
energy-temperature curve. Lower shelf and transition zones were considered because different authors conducted their impact test from -1 °C to 0 °C [22-29]. Also, there are studies for temperatures in the transition zone and upper zone [30]. In this study, Charpy values were conducted at room temperature, 20 °C. The equations from a literature review where the lower shelf region and transition temperature region were considered can be seen in Table 2. Then, K
IC-CVN correlations must be considered in the lower shelf, since different authors tested their Charpy tests at
0 °C. Robert-Newton [31], and INSTA [32] applied their correlations to the lower shelf region. While in the transition zone, the equations from Barsom-Rolfe [33], Marandet-Sanz [34], and Sailor-Corten [7] can be used. In the search of CVN by different authors, it has been necessary to employ the stress yield (σYS) of the material. Then, in order to make a Charpy energy values comparison and to obtain K
IC values, the Barsom-Rolfe´s equation [31] was used.
It is because it can be applied to all areas of the energy-temperature curve, lower shelf, transition temperature region and upper shelf for several steels. Another important consideration is that this equation considers the σYS of the material to convert K
IC-CVN values. Although those KIC-CVN correlations are for base materials, they can be
used in wet welding, since it is considered the brittle-ductile transition zone for steels.
Table 2. K
IC-CVN correlations for lower shelf regions and different zones found in published literature.
Transition temperature region
Barsom and Rolfe [33]
(
)
2 3/ 2 2 IC K CVNE = ksi in, ksi, ft-lb 40-250 ksi, 4-82 J
Marandet and Sanz [34]
(
)
1/ 219
IC
K = CVN MPa m, MPa, J 303-820MPa
43-118ksi Sailor and Corten [7]
(
)
2 8 IC K CVNE = psi in, CVN=ft-lbf E= psi
268-923MPa 39-134 ksi
Lower shelf region
Robert and Newton [31]
(
)
0.63 8.47IC
K = CVN MPa m, J
INSTA [32]
12
IC
K = CVN MPa m, J
Different zones
Barsom and Rolfe [33]
0,2 0,2 0,2 5 20 p IC p p R
K R CVN
R
= −
ksi in, ksi, ft-lb
3. Results and Discussion 3.1. CVN data
Table 3 presents the Charpy CVN values and σYS of the material gathered by different authors who employed wet welding in ASTM A36 steel. It can be observed that Di Lorenzo [30] did not report the σ
YS values of the material.
Table 3. Absorbed Charpy energy and yield stress (σYS) values by different authors, (units in Joules and MPa) who employed wet welding on ASTM A36 steel.
Depth [m] J [Joules] σYS [MPa]
West et al. [22] 2 41.5 539.5
10 40.5 531
Szelagoswki et al. [23] 55 31 444
61 17 415
Szelagoswki [24] 6 33 572
55 22 524
101 14 448
Grubbs and Reynolds [25] 6 46 531
10 37 510
50 42 434
99 39 407
Rowe et al. [26] 21 21 489
43 18 448
61 16 407
91 13 406
Perez-Guerrero et al. [27] 50 20 483
Di Lorenzo et al. [30] 19 39
--38 33
--58 25
--Pessoa [28] 50 13 450
100 12 425
Santo [29] 0.5 45.6 511
Teran et al. [17,18] 50* 19.0 430
50* 19.7 372
50* 25.1 409
70* 19.0 363
70* 19.7 365
70* 15.6 318
100* 10.0 301
100* 12.5 323
100* 10.0 285
50+ 16.0 410
50+ 18.0 392
50+ 18.5 382
70+ 16.0 376
70+ 12.5 327
70+ 9.0 364
100+ 19.0 347
100+ 16.0 316
100+ 14.0 357
*for 10 mm grinding depth. +for 6 mm grinding depth, & for Di Lorenzo, a temperature of 50 °C was chosen.
energy and temperature data is to know the ductile-brittle behavior from the Charpy transition temperature curve of the wet welding.
assessed at 20 °C, with the CVN data of other authors and Lorenzo’s values, it is reasonable to predict the Charpy transition temperature curves for underwater wet welding at several depths.
It is well-recognized that energy absorption decreases as the water depth increases. During the wet welding process, different discontinuities can be present, such as, porosity, slag inclusion, non-metallic inclusion, or cracking. An image of a fracture surface for a Charpy specimen, as shown in Figure 4a, exhibits pores at the notch. This fracture surface was photographed after wet welding was employed. A great number of pores was observed in the weld beads (WB) on the fracture surfaces of the Charpy specimens. Figure 4b presents pores at the WB. This is due to the fast cooling of the weld, and it is difficult to eliminate these discontinuities [30]. The discontinuities reduce the
energy absorbed, and, consequently, low CVN values can be anticipated as the water depth increases. Welding discontinuities, such as slag inclusions, lack of penetration, lack of fusion, cracking, undercutting and porosity, can be enlarged with the increase of depth of welding [35].
Figure 2. Comparison of CVN versus water depth for several authors.
3.2. KIC data of KIC-CVN correlations
KIC values estimated for this study are listed in Table 4 and Figure 5. In this table, KIC values are not reported by Di Lorenzo [30] because he did not report stress yield data and the Barsom-Rolfe equation [33] could not be used. This table proves that KIC values decreased as the depth increased. As presented above, this trend is because CVN values are proportionate to the KIC values and CVN decreases due to the porosity percentage, microstructure and slag produced in the wet weld beads. It is well-known that porosity is caused by gases (H2, CO and CO2) trapped during weld melting. In these gases, the pores contain 96% of H2 in volume, 0.4% of CO and 0.06% of CO2[36]. For example, Pessoa et al. [37] found porosity values of 1% and 8% for 50 and 100 m water depths because the slag reaches the top of the weld seams by itself, due to its low density. However, due to the hydrostatic pressure, it could not reach the top of the weld seam and was retained to develop porosity. Another explanation is that, when cracking is in the welding, these cracks connect the pores in the fracture planes, resulting in low K
IC values [38,39].
The toughness and ductility are more affected than yield and strength limits [40]. The following microstructure phases were identified [17,18]: ferrite with aligned second phase (FSA), sideplate ferrite (FS) and grain-boundary ferrite (GBF). These microstructures are typical of low mechanical properties according to Charpy impact test values. Therefore, in order to have high Charpy impact data and K
IC values, acicular ferrite in wet weld beads must
be obtained. This can be achieved if specific elements are added to the electrodes, such as titanium and boron together with an adequate concentration of oxygen and manganese [36].
Figure 4. a) Charpy specimen tested with 10 mm of grinding depth and 50 m of water depth, and b) pores in the welding bead (WB).
Table 4. Mechanical properties of KIC results, units in MPa m.
Depth, [m]
Barsom-Rolfe´s equation, [33]
KICMPa m
West et al. [22] 2 112
10 110
Szelagoswki et al. [23] 55 87
61 59
Szelagoswki [24] 6 100
55 75
101 53
Grubbs and Reynolds [25] 6 118
10 102
50 103
99 96
Rowe et al. [26] 21 71
43 63
61 56
91 49
Perez-Guerrero et al. [27] 50 69
Pessoa [28] 50 50
100 46
Santos [29] 0.5 116
Teran et al. [17,18] 50* 64.0
50* 62.0
50* 74.5
70* 60.1
70* 61.5
70* 50.5
100* 36.9
100* 44.0
100* 36.3
50+ 39.7
50+ 59.7
50+ 60.4
70+ 54.6
70+ 44.2
70+ 35.6
100+ 59.0
100+ 51.2
100+ 49.1
*for 10 mm grinding depth. +for 6 mm grinding depth.
It can be seen, as expected, that K
IC values reported by Barsom [13] are close to the real KIC measured
values. It is necessary, however, to compare this data testing with the ASTM E399 [9]. Barsom uses the σ
YS of the
material to estimate KIC values. Using the yield stress of the material and Charpy values, it is possible to achieve more reliable results which are close to the ASTM E399 standard. In this sense, to estimate K
IC-CVN values, more
could be obtained. Qamar [8] developed models for K
IC data based on hardness (HRC) and impact energy (CVN)
data. Dexter [42] measured the J value for underwater wet welds for several types of steels, electrodes and water
depths using JIC compact tension specimens. In these conditions, A36 steel, E6013 electrodes and water depths of 10, 35 and 60 m are chosen. Using the conversion of J values to KIC results for water depths of 10 m, 35 m and 60 m, K
IC values are 7.2 MPa m, 39.12 MPa m, and 44.50 MPa m, respectively. KIC data decreases as water
depths increase, which agrees with the values presented above. On the other hand, it can be seen that there is no single fracture toughness value for steel even at a fixed temperature and loading rate as pointed out by several authors [43-45]. Thus, at room temperature, the fracture toughness values measured at high loading rates are lower than those measured at lower loading rates. Therefore, KIC can vary for the same material tested under similar laboratory conditions. As expected, the K
IC values obtained in the present study can be considered effective and
used in research to estimate the real fracture toughness. Therefore, this data can be taken as a starting point to estimate KIC values.
Hence, with traditional equations of K
IC, it was possible to estimate KIC values and to assess traditional
components. The treatment of fracture toughness data is used in the analysis of fracture mechanics and depends on the available data. This dependence makes the structural integrity evaluation difficult when only applying a simplified procedure. Data of fracture toughness cannot be available in all situations or cannot be obtained due to the lack of material or the impossibility of removing material from an actual structure. CVN testing is less demanding than K
IC testing in terms of experimental complexity, speed, and cost [8]. We know that the correlation
equations are based on base materials without welding. However, there are no other equations proposed to obtain KIC data, thus, these equations will serve to estimate KIC data and could be applied for several metals and wet welding. In these circumstances, the Charpy impact data can be all the available and reliable correlation between the Charpy impact energy and the fracture toughness that should be found [30].
The Charpy impact test will be used to indirectly estimate the fracture toughness of metals. It is necessary to make a KIC direct measurement and compare the KIC correlations values with standard specimens. However, because of the relative difficulty and expense of these tests, the Charpy test will probably continue to be used. The correlation between the Charpy CVN and K
IC fracture toughness will be topics for future study due to the
importance of KIC in the LEFM. In addition, this standard characterizes the critical value of the crack driving force at the initiation of crack extension, and this allegedly represents a material property that is transferable from a test specimen to a structure [45].
For the sake of illustration, Figure 6 shows normalized boxplot graphs of the distribution of the variables involved in the experiment of this study. In the Equation 1 [46], it was used to normalize the variables [46]:
* min
max min
X X
X
X X
− =
− (1)
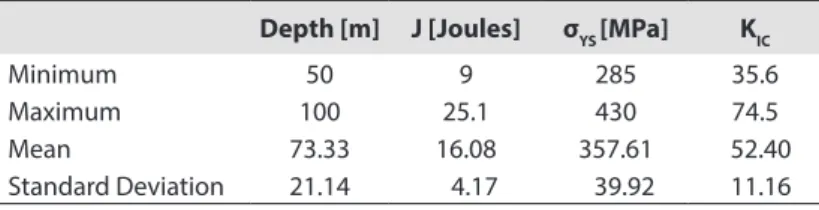
In the equation above, X* is the normalized value of the variable, X is the actual value, Xmin is the minimum value and Xmax is the maximum value. The boxplot graph is divided by minimum value, first quartile, median, third quartile and maximum. The central rectangle extends from the first to second quartile, representing the interquartile range (IQR). The rectangle and horizontal line inside the IQR display the mean and the median respectively. The summary of the experimental results is shown in Table 5 for each studied variable; this summary is useful for plotting Figure 6.
Table 5. Summary of the variables obtained in the experiment.
Depth [m] J [Joules] σYS [MPa] KIC
Minimum 50 9 285 35.6
Maximum 100 25.1 430 74.5 Mean 73.33 16.08 357.61 52.40 Standard Deviation 21.14 4.17 39.92 11.16
4. Conclusions
KIC values were estimated from KIC-CVN correlations from CVN impact data by authors who employed A36 steel, wet welding and E6013 electrodes. CVN impact energy and KIC values decrease as the sea depth increases. It is attributed to various discontinuities in wet welding, such as porosity, slag-inclusion, non-metallic inclusion and cracking. Although the equations of KIC-CVN correlations did not specify that they can apply to wet welding, the KIC values obtained by Barsom could be considered the closest values in order to compare them with the ASTM E369 standard specimens. This is because they use values from Charpy (CVN) in all zones of the absorbed energy curve, and the yield stress of the material. It is necessary to conduct or develop further correlation equations to introduce different mechanical properties, such as, σYS, σUTS, hardness (HRC) and define microstructure. It is noted that there is no singles fracture toughness value for steels, nor a fixed temperature, Charpy CVN data and water depths. A relatively accurate KIC -CVN correlation can be a useful tool in the MFLE. CVN testing is less demanding than K
IC testing in terms of experimental complexity, speed, and cost. Then, traditional equations to estimate KIC
data will be used. It is due to KIC representing a mechanical material property that it could be transferable from a test specimen to a structure.
Acknowledgements
The authors would thank to the ESIQIE-IPN, CONACYT-México and IMP for financial and material support.
References
[1] McNicol, R.C. Correlations of charpy test results for standard and nonstandard size specimens. Shaker Heights: Welding Research Council 385; 1965.
[2] Phaal R, Macdonald KA, Brown PA. Correlations between
fracture and charpy impact energy. Cambridge: Cooperative
Research Programmed for Industrial Members Only; 1994. TWI
Report 504. The Welding Institute.
[3] Barsom JM, Rolfe ST. Fracture and fatigue control in structures.
3rd ed. New Jersey: Prentice Hall Englewood Cliffs; 1999.
[4] Rolfe ST, Novak SR. Slow-bend K
IC testing of medium
high-toughness steel. Review of development in plane strain
fracture toughness testing. ASTM Special Technical Publication.
1970;463:124-159.
[5] Barsom JM, Rolfe ST. Correlations between KIC and Charpy V-notch test results in the transition-temperature range.
Impact Testing of Metals. ASTM Special Technical Publication.
1970;466:281-302.
[6] Roberts, R., Newton, C. Interpretive report on small scale test correlations with KIC data. New York: Welding Research Council; 1981. (WRC Bulletin; 265).
[7] Sailors SH, Corten HT. Relations between material fracture toughness using fractures mechanics and transition temperature
test. Fracture toughness. Proceeding of the 1971, National Symposium on Fracture Mechanics – Part II, STP 514, ASTM;
[8] Qamar SZ, Sheikh AK, Arif AFM, Pervez T. Regression-Based
CVN-K
IC models for hot study tool steels. Materials Science
and Engineering A. 2006;430(1-2):208-215. http://dx.doi.
org/10.1016/j.msea.2006.05.103.
[9] American Society for Testing and Materials. ASTM E-399: standard test method for linear-elastic plane-strain fracture toughness KIC of metallic materials. West Conshohocken: ASTM; 2009.
[10] Matusevich AE, Mancini RA, Giudici AJ. Determinación de la
tenacidad a la fractura del material de un gasoducto. Revista Lantinoamericana de Metalurgia y Materiales. 2010;32(2):253-260.
[11] Wullaert RA. Fracture toughness predictions from Charpy V-notch
data: what does the Charpy test really tell us? Proceedings of the American Institute of Mining, Metallurgical and Petroleum
Engineers; 1978 February 27-28; Denver, Colorado, USA. Cleveland: American Society for Metals; 1978.
[12] Roberts R, Newton C. Report on small-scale test correlations with K
IC data. Welding Research Council Bulletin.
1981;2(265):1-18.
[13] Barsom JM. The development of AASHTO fracture toughness for bridge steel. Engineering Fracture Mechanics. 1975;7(3):605-618. http://dx.doi.org/10.1016/0013-7944(75)90060-0.
[14] Marandet B, Sanz G. STP 631: evaluation of the toughness of
the medium-strength by using elastic fracture mechanics and correlations between KIC and Charpy V-notch, Flaw Growth and Fracture. West Conshohocken: ASTM; 1977. p. 72-95.
[15] Norris DM, Reaugh JE, Server WL. A fracture-toughness
correlations based on Charpy initiation energy. Proceedings of the 13th Conference Fracture Mechanics STP 473; 1980; Philadelphia, USA. Philadelphia: ASTM; 1981. p. 207-217.
[16] Walling, K. New report methodology for selecting Charpy toughness criteria for thin high strength steels. Report Represented to Commission X, IIW 1994, Annual Assembly. Beijing: IIW; 1994. DOC. NO. X.1290.
[17] Teran G, Capula-Colindres S, Angeles-Herrea A, Velazquez JC, Fernandez-Cueto MJ. Estimation of fracture toughness KIC from Charpy impact test data in T-welded connections repaired by grinding and wet welding. Engineering Fracture Mechanics. 2016;153:351-359. http://dx.doi.org/10.1016/j. engfracmech.2015.12.010.
[18] Teran G, Cuamatzi-Melendez R, Albiter A, Maldonado C, Bracarense AQ. Characterization of the mechanical properties and structural integrity of T-welded connections repaired by grinding and wet welding. Materials Science and Engineering A. 2014;599:105-115. http://dx.doi.org/10.1016/j.msea.2014.01.078.
[19] American Welding Society. AWS D1.1/D1.1M: structural welding
code-steel. Miami: AWS; 2006.
[20] Méndez GT, Cuamatzi-Meléndez R, Hernández AA. Combination of grinding and wet welding to repair localized cracking in t-welded connections. Materials Science Forum. 2014;793:51-58. http://dx.doi.org/10.4028/www.scientific.net/MSF.793.51.
[21] American Society for Testing and Materials. ASTM E23-12: standard test methods for notched bar impact testing of metallic materials. West Conshohocken: ASTM; 2012.
[22] West C, Mitchell G, Linberg E. Wet welding electrode evaluation for ship repair. Welding Journal. 1990;69(8):46-56.
[23] Szelagowsky P, Pachniuk I, Stuhff H. Wet welding for platform repair. Proceeding Second International Offshore and Polar
Engineering Conference; 1992 June 14-19; San Francisco, California, USA. San Francisco; 1992. p. 208-215.
[24] Szelagowsky P. Wet welding as a serious repair procedure? Journal
of Offshore Mechanics and Arctic Engineering. 1998;120(3):191-196. http://dx.doi.org/10.1115/1.2829540.
[25] Grubbs CE, Reynolds TJ. State of the art underwater wet welding. Houston: World Oil Magazine; 1998. p. 79-83.
[26] Rowe MD, Liu S, Reynolds TJ. The effect of ferro-alloy additions and depth on the quality of underwater wet welds. Welding Journal. 2001;81(8):156S-166S.
[27] Perez-Guerrero F, Liu S. Smith, C., Rodriguez-Sanchez, E. Effect
of nickel on toughness of underwater wet welds. OMAE. 2003;37261:1-6.
[28] Pessoa ECP. Estudo da variação da porosidade ao longo do cordão em soldas subaquática molhadas [doctor thesis]. Belo
Horizonte: Federal University of Minas Gerais; 2007.
[29] Santos VR, Bracarense AQ, Pessoa ECP. Underwater welding
consumables development. International studieshop on the state of the art science and reliability of underwater and inspection technology. In: International workshop on the state of the artc science and reliability of Underwater welding and inspection technology. 2010 November 17-19; Houston, Texas, USA. Houston; 2010, p. 172-197.
[30] Di Lorenzo RF, Soares WA, Bracarense AQ. Fracture toughness
of ferritic steel underwater wet welding. Proceedings of the
18th International Conference on Structure Mechanics in Reactor Technology (SMiRT 18); 2005 August 7-12; Beijing, China. Beijing: SMiRT 18; 2005. p. 1882-1895.
[31] Roberts R, Newton CC. Report on small-scale test correlations with K
IC data. New York: Welding Research Council; 1984. (WRC
Bulletin; 299)
[32] INSTA. Technical report: assessment of structures containing discontinuities. Stockholm: Materials Standards Institution; 1991.
[33] Barsom JM, Rolfe ST. ASTM STP 466 - impact testing of metals:
correlations between KIC and Charpy V-notch test results in the transition-temperature range. West Conshohocken: ASTM; 1970. p. 281-302.
[34] Marandet B, Sanz G. STP 631: evaluation of the toughness of
the medium-strength by using elastic fracture mechanics and correlations between KIC and Charpy V-notch, Flaw Growth and Fracture. West Conshohocken: ASTM; 1977. p. 72-95.
[35] Watson PD, Tsai CL, Wood B. Fitness of service design application for underwater wet welds. Proceedings of the International
studieshop on underwater welding of marine structures; 1994 December 7-9; New Orleans, Louisiana, USA. Houston: American Bureau of Shipping, p. 201-236; 1994.
[36] ASM Handbook®. Welding, Brazing and Soldering. 7th ed. Vol. 6. ASM International; 2005.
[37] Pessoa ECP, Bracarense AQ, Zica EM, Liu S, Perez-Guerrero F. Porosity variation along multipass underwater wet welds and
its influence on mechanical properties. Journal of Materials
Processing Technology. 2006;179(1-3):239-243. http://dx.doi. org/10.1016/j.jmatprotec.2006.03.071.
[38] Angeles-Herrera D, Albiter-Hernandez A, Cuamatzi-Melendez R, Gonzalez-Velazquez JL. Fracture toughness in the circumferential-longitudinal and circumferential-radial directions of circumferential-longitudinal
Weld API 5L X52 pipeline using standard C(T) and nonstandard
curved SE(B) specimens. International Journal of Fracture. 2014;188(2):251-256. http://dx.doi.org/10.1007/s10704-014-9949-1.
[39] Angeles-Herrera D, Gonzalez-Velazquez J, Morales-Ramírez AJ.
direction of API 5L Steel pipe. Journal of Testing and Evaluation.
2012;40(6):1-4. http://dx.doi.org/10.1520/JTE103903.
[40] Danninger H, Jangg G, Weiss B, Stickler R. Microstructure and
mechanical properties of sintered iron. Part II: experimental study. International Journal of Powder Metallurgy.
1993;25(4):170-173.
[41] Salemi A. The effect of microstructure on estimation of the fracture toughness (KIC) rotor steel using Charpy absorbed
energy (CVN). Journal of Advanced Materials and Processing.
2013;1(3):11-17.
[42] Dexter RJ. ASTM STP 1058: fracture toughness of underwater
wet welds. Fatigue and fracture testing of weldments. In:
McHenry HI, Potter JM, editors. American Society for Testing and Materials. Philadelphia: ASTM; 1990. p. 256-271.
[43] Ripling EJ, Crosley PB. Crack arrest fracture toughness of a
structural steel A36. Welding Research. 1982;(Suppl):65s-74s.
[44] Sovak, J.F. The fracture resistance of 4-in thin A36 and A588 grade A electroslag weldments. Welding Research. 1981;(Suppl):269s-272s.
[45] Federal Emergency Management Agency. State of the art report on base metals and fracture. Washington: FEMA; 2000. FEMA-355A.


![Table 4. Mechanical properties of K IC results, units in MPa m . Depth, [m] Barsom-Rolfe´s equation, [33] K IC MPa m West et al](https://thumb-eu.123doks.com/thumbv2/123dok_br/18859112.417594/7.892.227.671.132.875/table-mechanical-properties-results-depth-barsom-rolfe-equation.webp)