Article
Printed in Brazil - ©2016 Sociedade Brasileira de Química 0103 - 5053 $6.00+0.00
*e-mail: [email protected]
Functionalized Multi Walled Carbon Nanotubes as a Carrier for Doxorubicin: Drug
Adsorption Study and Statistical Optimization of Drug Loading by Factorial Design
Methodology
Bahman Vasheghani Farahani,* Gholamreza Rezaei Behbahani and Nasrin Javadi
Department of Chemistry, Faculty of Science, Imam Khomeini International University, 288, Qazvin, Iran
Multi walled carbon nanotubes (MWNTs) have been identified as an efficient drug carrier. Here a controlled drug delivery system based on modified MWNTs with polyethylene glycol (PEG) was developed (MWNTs-PEG). Then doxorubicin (DOX) as an anticancer drug loaded to nanocarrier. All the parameters affecting the DOX adsorption such as: dose of adsorbent, pH, initial DOX concentration and contact time were studied for the first time by factorial design methodology to evaluate and optimize the adsorption conditions. The adsorption isotherm and other properties including kinetics and thermodynamics were studied. The adsorption isotherm was well described by the Freundlich model and adsorption kinetics followed a pseudo-second order model. The thermodynamic studies showed that the adsorption of DOX on nanocarrier is spontaneous and exothermic in nature. The cumulative release of DOX from MWNTs-PEG was pH dependent and the release rate was much higher at pH 5.5 than that at pH 7.4.
Keywords: functionalized multi wall carbon nanotube, doxorubicin, adsorption isotherm, kinetic models
Introduction
Since carbon nanotubes (CNTs) discovery in the early 1990s,1,2 they have become an area of a wide ranging
research activity due to their exceptional chemical and physical properties.3-12 The development of new and
efficient drug delivery system has fundamental importance to improve the pharmacological profiles of many classes of therapeutic molecules. Many different types of drug delivery systems are currently available. Within the family of nanomaterials, CNTs have emerged as a new alternative and efficient tool for transporting and translocating therapeutic molecules. CNTs possess many intriguing features that make them attractive drug delivery carriers. Firstly, nanocarriers, including nanoparticles (NP), liposomes and CNTs, experience the enhanced permeability and retention (EPR) effect, i.e., they exhibit higher accumulation in tumor tissues as compared to normal tissues due to poorly formed blood and lymphatic vessels that supply rapidly proliferating tumors.13 The EPR effect enables CNTs
to transport chemotherapeutic agents preferentially to tumor sites.14 Secondly, the needle-like shape of CNTs
facilitates trans membrane penetration and intracellular accumulation of drugs via the “nanoneedle” mechanism that is independent of additional CNT functionalization and cell types.6 Aside from direct translocation through
cellular membranes, CNTs have also been shown to enter cells via energy-dependent endocytic path ways.15 Thirdly,
as a platform for drug attachment, CNTs, owing to their high aspect ratios and surface areas, display extraordinary ability for drug loading onto the surface or within the interior core of CNTs via both covalent and non-covalent interactions.16 In fact, these innovative carriers exhibit
little cytotoxicity, capable of immobilizing therapeutic agents (e.g., drugs, proteins, DNA, antibodies) on the outer wall,17,18 or by encapsulation inside the nanotubes.19 Due
to their nanoneedle-like structure, they were found to be taken up efficiently by cells and to translocate directly into the cytoplasm of target cells without causing cell death.6,20
Hydrophilic biocompatible polymers with neutral charge like polyethylene glycol (PEG) or polyethylene oxide (PEO) have been extensively used for surface modification to increase the systemic retention and circulation time of nanovectors.22 PEG can be grafted to
enhance the solubility of the nanotubes and has recently been shown to overcome the problem of multidrug resistance.23,24 The grafting of a biocompatible polymer
can be achieved via an acyl chloride intermediate, which reacts with the hydrophilic polymer PEG to form CNT-PEG graft copolymers. The ability of functionalized MWNTs to penetrate into the cells offers their potential as vehicles for the delivery of small drug molecules.25
The efficiency and target effect of PEGylated multi wall CNTs (MWNTs-PEG) for anticancer agent delivery have been investigated by different scientist.26-30 Doxorubicin
hydrochloride (DOX), an anthracycline ring antibiotic, is a highly effective anti-neoplastic agent used in leukemia chemotherapy. However, the severe toxic side effects such as cardiotoxicity, alopecia, vomiting, leucopenia and stomatitis have hampered the successful use of DOX. To reduce the undesired effects without reducing drug potency, DOX is usually encapsulated into drug delivery vehicles that have the ability to protect the molecule of interest and selectively target specific compartments without adversely affecting the surrounding tissues.31
Although several studies have been reported on the effects of in vivo or in vitro antitumor activity and tumor targeting of drug-CNTs complex based on the adsorption, but very little is known about the adsorption behavior of anticancer drug on CNTs. To facilitate the development of the CNT-based drug delivery systems, thorough studies of the adsorption and desorption of drugs on CNTs are absolutely necessary. In this paper, we prepared MWNTs-PEG and evaluated its ability for loading of the anticancer drug Doxorubicin. To optimize the adsorption of DOX on MWNTs-PEG, the effect of independent variables, (i.e., pH, contact time, adsorbent dose and initial concentration) on dependent variables, (i.e., entrapment efficiency, %), were investigated by a two-level, four factor, full factorial experimental design with minitab16 software. Experimental design method was used to reduce the number of experiments, time, overall process cost and screened simultaneously a large number of factors to obtain better response. Analysis of the adsorption of DOX onto MWNTs will benefit from understanding the interaction mechanism between the adsorbate and the adsorbent and serves as the basis for the establishment of nanoscale drug delivery systems.
Experimental
Materials
Multi walled carbon nanotubes (outer diameter 5-15 nm, length about 30 µm) were purchased from US Research Nanomaterials, Co., Ltd. Polyethylene glycol (Mw = 4000 g mol−1) and Doxorubicin hydrochloride
were obtained from sigma Aldrich Co., Ltd. Acid nitric
(HNO3), tetrahydrofuran (THF), dimethylformamide
(DMF), triethylamine (TEA), sodium hydroxide (NaOH), hydrochloric acid (HCl), disodium phosphate, monosodium phosphate dehydrate and potassium hydrogen phthalate were purchased from Merck Co., Ltd. Thionyl chloride (SOCl2) was received from Acros Organics Co., Ltd.
Methanol from Merck Co., Ltd. The other reagents used were of analytical grade and all chemicals used as received without further purification.
General characterization methods
The characterization of nanocarrier is investigated by various techniques. The Fourier transform infrared (FTIR) spectra of the samples recorded with Bruker Tensor 27 FTIR spectrophotometer. Scanning electron microscope (SEM) model AIS 2100 from Soren technology is used to obtain morphological information of the surface. Thermogravimetric analysis (TGA) is performed under nitrogen atmosphere at a heating rate of 10 °C min−1 with the
help of the PERKIN-ELMER Series 7. UV-Vis spectroscopy measurements carried out by UV-Vis spectrophotometer (Camspec M350) at 483 nm. Raman scattering spectra of the MWNTs and MWNTs-PEG were obtained at room temperature using a FIRSTGUARD high-resolution Lab Ram Raman microscope system equipped with a charge-coupled detector, confocal microscopy and a CCD detector.
Method
Oxidation of MWNTs
First, 1 g of as-received MWNTs were purified by refluxing at 80 °C in concentrated HCl for 12 h, followed by filtration with a Millipore membrane (pore size 0.22 µm) and a careful rinse with ultrapure water till the filtrate was neutral. Then, 1 g of purified MWNTs was refluxed in a mixed acid (concentrated H2SO4 + HNO3, 75:25 vol%) at
80 °C for 24 h.32 The suspension was cooled and diluted with
75 °C for 24 h. After refluxing under nitrogen atmosphere for 48 h, the product is washed with THF and dried at 60 °C under vacuum overnight to get MWNTs-COCl.
Preparation of hybrid MWNTs-PEG
PEGylation of carboxylic acid groups on the oxidized MWNTs was done by refluxing 15 g of PEG in the presence of 2 mL of TEA under nitrogen gas at 50 °C for 24 h. Then 1.0 g of the MWNTs-COCl solution was added to above mixture at 60 °C for 72 h (Figure 1). Finally, methanol was used to remove unreacted reagents. The final product dried at 65-70 °C for 24 h.
Adsorption of drug on functionalized MWNTs
In a typical experiment, a desired amount of MWNTs-PEG nanocarrier was added to 50 mL of DOX solution (10 ppm). Then it was placed to the thermostat shaker at 100 rpm, 25 °C for different time interval. The initial pH of the DOX solutions was adjusted by adding
0.01 mol L−1 HCl or NaOH. MWNTs/PEG/DOX was
separated by a centrifuging for 5 min with 3000 rpm. Residual DOX concentration in supernatant was obtained using a UV-Vis spectrophotometer at λmax = 483 nm.
For investigation of the adsorption isotherms, the experiments were carried out by varying the solution temperature and initial DOX concentration. The adsorption percentage (η) and adsorption capacity values at equilibrium and time t (qe and qt, mg g−1) were calculated according to
equations 1, 2 and 3, respectively:
0 e
0
C – C
η = × 100%
C (1)
0 e e
C – C
q = V
m (2)
0 t t
C – C
q = V
m (3)
where C0, Ce and Ct (mg L−1) are the DOX concentrations
at initial, equilibrium and time t, respectively, V (L) is the solution volume and m (g) is the mass of used nanocarrier.
Modeling by full factorial design
Based on preliminary study of the effect of parameters
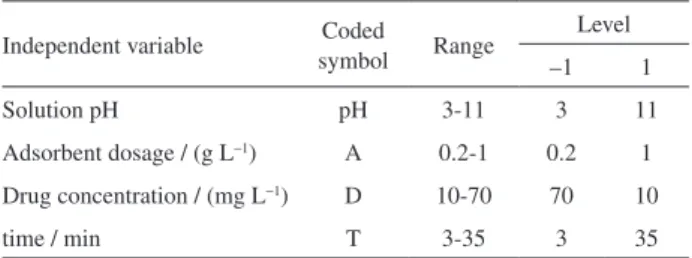
on the drug loading, Minitab16 software was applied for designing the experiment. Four variables at two levels: low and high were taken, which were represented by transform values of −1 and +1, respectively. Values of these selected variables are shown in Table 1. The analysis focused on how the drug adsorption efficiency is influenced by independent variables, i.e., pH (X1), adsorbent dosage
(X2), drug concentration (X3) and time (X4). The main
effects (X1, X2, X3 and X4) represent the average result of
changing factors from low to high values. The dependent output variable is maximum drug entrapment. If there are k factors each at two levels, a full factorial design has 2k
runs therefore sixteen experiments were employed in this study. The behavior of the system was explained by the following quadratic equation 4:
n n n
predicted 0 i i ij i j i=1 i=1 j=1
Y = b +
∑
b x +∑∑
b x x (4)where Ypredicted represents the drug adsorption yield, b0 is the
value of fitted response at the center point of design, bi and
bij are the linear interaction and quadratic terms, respectively.
Drug release study
To study the drug release after optimizing the factors affecting the drug loading as explained above, 0.04 g of MWNTs-PEG under ultrasonic condition for 3 min was added to 50 mL of phosphate buffer (pH 7) containing 10 mg L−1 DOX. Then the mixture was kept for 35 min
under stirring at 25 °C and then the solid sample was removed by centrifuging it for 5 min with 3000 rpm. Sample was dried in an oven at 70 °C under vacuum condition. For in vitro drug release study, 10 mg of sample (CNTs/PEG/drug) was put in a 100 mL beaker containing
Figure 1. Synthesis of MWNTs-PEG.
Table 1. Experimental ranges and levels of the factors used in the factorial design
Independent variable Coded
symbol Range
Level
–1 1
Solution pH pH 3-11 3 11
Adsorbent dosage / (g L−1) A 0.2-1 0.2 1
Drug concentration / (mg L−1) D 10-70 70 10
50 mL of buffer solution of pH (5.5 and 7.4) at 25 °C using dialysis bag. Samples were periodically withdrawn from the beaker using 1 mL pipette and the volume of the withdrawn samples was replaced with fresh buffer solution. The release amount of DOX was detected at 483 nm by UV-Vis spectrophotometry.
Results and Discussion
Characterization of MWNTs/PEG
SEM analysis
SEM images for MWNTs-COOH and MWNTs-PEG are given in Figures 2a and 2b, respectively. The images show a clear morphology of these compounds. Image of MWNTs-COOH reveal a smooth surface with curled and entangled tubes (Figure 2a). Whereas the surfaces of carbon nanotubes in MWNTs-PEG were rough and exist some clusters attached to them (Figure 2b). The phenomenon indicates that PEG macromolecular has been grafted on the surface of MWNTs by the formation of ester linkages between the reactive hydroxyl groups of PEG and the acyl groups of MWNTs.
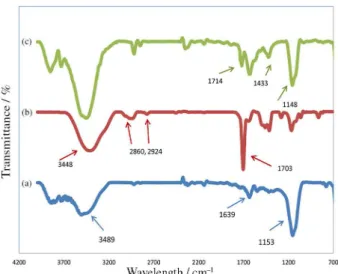
FTIR analysis
FTIR analysis of MWNTs and MWNTs-COOH
The peaks are observed in MWNTs spectra at 1153, 1639 and 3489 cm−1 wavelength are related to C−O, C=C
and O−H bonds, respectively (Figure 3a). It should be mentioned that the peaks observed for C−O and O−H bonds are related to low percent of hydroxyl group on nanotubes surface. The peaks observed in functionalized MWNTs-COOH spectra at 1166, 1703 cm−1 are related to
C−O and C=O, respectively (Figure 3b). The wide peak, which is appeared in the region of 3448.56 cm−1 assigned
to O−H (carboxylic acid) group. Observed peaks at 2860.26 and 2924.39 cm−1 are due to C−H stretching bonds. In
fact, increasing intensity and width of O−H peaks are due to functionalizing of nanotubes by HNO3. On comparing
Figures 3a and 3b, it can be said that MWNTs were successfully oxidized by HNO3.
FTIR analysis of MWNTs-PEG
The change in intensity of C−O (1148 cm−1) and C−H
(1433 cm−1) peaks in MWNTs-PEG spectra (Figure 3c)
as compared to MWNTs-COOH spectra is due to C−O−C stretch vibration and C−H bending vibration of the alkyl chain of PEG. The shift in carbonyl peak (1703 to 1714 cm−1) is because of ester linkage between
MWNTs-COOH and PEG.
Thermal analysis
Due to the high thermal stability of MWNTs, TGA has been widely used to quantify the MWNTs’ degree of functionalization.33 Therefore this technique has been used
for quantitative analysis of polymers linked to nanotubes. As can be seen from Figure 4, two weight losses are shown in MWNTs-PEG. First step is due to PEG degradation and second step is related to MWNTs decomposition. The complete degradation of PEG in MWNTs-PEG occurs
Figure 2. SEM images of (a) MWNTs-COOH; (b) MWNTs-PEG.
Figure 3. FTIR spectra of (a) MWNTs; (b) MWNTs-COOH;
(c) MWNTs-PEG.
Figure 4. TGA of (a) MWNTs; (b) MWNTs-COOH; (c) MWNTs-PEG;
at 350 °C. The loss of weight at 230-350 °C in Figure 4c shows that 17.5% of polymeric chains are linked to the surface of MWNTs.
Raman analysis
Raman scattering analysis is usually used to characterize carbon nanotubes, since it provides extremely important information about the structure and purity of such graphitic nanomaterials.34 Figure 5 shows the Raman
spectra of pristine MWCNTs, MWNTs-PEG and MWNTs-PEG-DOX. The Raman spectra of pristine MWCNTs show two characteristic peaks (D and G bands). One at the Raman shift of 1309 cm−1, named D-band,
which is associated with the defects present in the graphitic structure to the disordered graphitic structure of MWCNTs. The other peak at the Raman shift of 1578 cm−1, named
G-band, which is assigned to the C=C bond in the graphitic plane. When the MWNTs surfaces are functionalized by PEG groups, it was found that the Raman D-band intensity increased. Thus, the intensity ratio of D-band to G-band (ID/IG) can be used for evaluation of graphitic structure of
CNTs.
In this case, the relative intensity value of ID/IG of pristine
MWCNTs, MWNTs-PEG and MWNTs-PEG-DOX is 1.68, 1.78 and 1.84, respectively. As can be seen, the intensity of ID/IG increases by the attachment of
PEG and DOX groups onto the surface of MWNTs. The graphitic structure of MWNTs destroyed and an increase in the number of CNT defects observed. The increase in the D-band is an indication of covalent side-wall functionalization, reflecting the conversion of the hybridization of some carbon atoms on the nanotube wall from sp2 to sp3.
Experimental design
Experimental results obtained in the adsorption runs are presented in Table 2. The effect of factors is defined as the change in response produced by a change in the level of the factors. Equation 5 demonstrates the relationship between the variables as follow:
R% = 44.2 + 40.02pH + 2.12A + 2.07D + 2.22T – 0.16pHA + 1.81pHD – 0.11pHT – 0.99AD + 0.072AT – 0.17DT – 0.23pHAD – 0.52pHAT – 0.33pHDT –
0.21ADT – 0.42pHADT (5)
where A, D and T parameters are adsorbent dosage, drug concentration and time, respectively.
Adsorption properties of MWNTs-PEG
The main effects of each parameter on DOX adsorption are given in Figure 6. The pH of aqueous solution is one of the most important factors because of its effect on the active sites of nano adsorbents and the degree of ionization and speciation of the adsorbate. From the figure, it was observed that the maximum adsorption was found to occur at pH 7, this may be because, at low pH, the increased in protonation of −NH2 groups on DOX caused an increase
in hydrophobicity and higher solubility of DOX, thus leading to the release of more DOX from nanocarrier into aqueous solution. Also electrostatic interaction between 900 1000 1100 1200 1300 1400 1500 1600 1700 1800
Intensity / %
Raman shift / cm-1
(a) (c)
(b)
Figure 5. Raman spectra of (a) MWNTs; (b) MWNTs-PEG;
(c) MWNTs-PEG-DOX.
Table 2. Experimental design and percentage of drug loading
Run pH A D T Entrapment / %
1 −1 −1 −1 −1 1.21
2 1 −1 −1 −1 81.2
3 −1 1 −1 −1 2.89
4 1 1 −1 −1 88.9
5 −1 −1 1 −1 1.49
6 1 −1 1 −1 83.7
7 −1 1 1 −1 4.93
8 1 1 1 −1 92.3
9 −1 −1 −1 1 4.41
10 1 −1 −1 1 84.7
11 −1 1 −1 1 11.9
12 1 1 −1 1 88.9
13 −1 −1 1 1 3.92
14 1 −1 1 1 80.6
15 1 1 1 1 81.7
16 −1 1 1 1 8.21
A: Adsorbent dosage; D: drug concentration; T: time.
900 1000 1100 1200 1300 1400 1500 1600 1700 1800
Intensity / %
Raman shift / cm-1
(a) (c)
protonated DOX and positively charged MWNTs-PEG active sites cause to decrease of DOX adsorption percentage at low pH. The increasing adsorption efficiency with pH suggested that the surface of functionalized MWNTs has a more negative charge. It was observed that the DOX adsorption increases as the adsorbent dosage increases (Figure 6b). Enhancement of entrapment efficiency with an increase in adsorbent dosage is due to the availability of larger surface area and greater number of free adsorption sites. With further increase in the adsorbent dosage concentration, the percentage adsorption was not increased significantly. The phenomenon could be explained as both the surface of adsorbent and solution concentration of the DOX settle to equilibrium with each other. As can be seen from Figure 6c, increasing the DOX concentration from 10 to 70 mg L−1 results in decreasing the adsorption
percentage. These results may be explained by the fact that, at low DOX concentration, the ratio of the surface active sites of adsorbent to the total of the adsorbate (i.e., DOX) concentration is high, but with the increase in adsorbate concentration, the number of active adsorption sites is not enough to accommodate drug ions. From Figure 6d, it was observed that higher the contact time between the DOX and nanocarrier, higher the equilibrium of adsorption efficiency.
Analysis of the variance (ANOVA)
The DOX adsorption was determined by performing the analysis of variance (ANOVA). Sum of squares (SS) of each factor quantifies its importance in the process. Increasing
the value of the SS, the significance of the corresponding factor in the undergoing process also increases (Table 3). The main and interaction effects of each factor having P values < 0.05 are considered as potentially significant. To evaluate the significance of the regression coefficients, the Student’s t-test and Fischer F-test were applied. Greater calculated F- and t-values than the tabulated F and t-values at a particular level of significance and a certain number of degrees of freedom shows that a given model is a good predictor.36 According to the F-ratio, t-value
and P-value, it seems that the effects of pH, adsorbent dosage (A), the initial concentration of DOX (D), and time (T) are statistically significant. Analyzing the data in Table 3, it can be inferred that the solution pH was the most important variable of the overall adsorption procedure since its coefficient was the largest at 40.02. Also it can be seen that the positive sign of this coefficient shows DOX adsorption was enhanced at higher pH values. The other parameters had almost the same small positive effects on DOX adsorption efficiency.
In addition to statistical tests, the adequacy of the model was also evaluated through the difference between the observed and predicted values (Table 4). A satisfactory correlation between the observed and predicted values of DOX adsorption efficiency is shown in Figure 7.
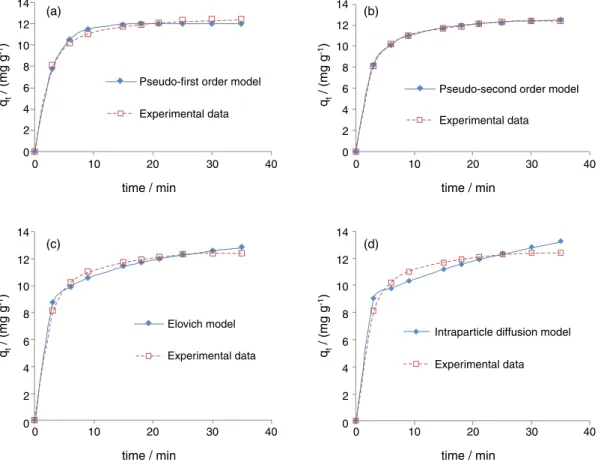
Kinetic studies
Various kinetic models such as pseudo-first order, pseudo-second order, Elovich and intra-particle diffusion
50 60 70 80 90 100
0 5 10 15
pH
(a)
0 20 40 60 80 100
0 0.2 0.4 0.6 0.8 1 1.2
Efficiency / %
Efficiency / %
Efficiency / %
Efficiency / %
Adsorbent dosage / (g L )-1
(b)
0 20 40 60 80 100
0 20 40 60 80
DOX concentration / (mg L )-1
(c)
0 20 40 60 80 100
0 10 20 30 40
time / min
(d)
models are used to study the kinetic adsorption of the DOX on the nanocarrier.37-39 The origin forms of these models
are generally expressed as:
1 –k t t e
q = q (1 – e ) Pseudo-first order (6)
2 2 e t
2 e
k q t q =
1 + k q t Pseudo-second order (7)
t
1 1
q = ln αβ + ln t
β β Elovich model (8)
qt = kit1/2 + Ci Intraparticle diffusion model (9)
where qt (mg g−1) and qe (mg g−1) are the adsorption capacity
at any time t (minutes) and the equilibrium adsorption capacity, respectively; k1 and k2 are the pseudo-first
order (min−1) and the pseudo-second order rate constant
(g mg−1 min−1), respectively; α and β, known as the
Elovich coefficients. Where α is the initial adsorption rate (mg g−1 min−1) and β is the desorption constant (g mg−1).
ki is the rate constant at stage i and Ci is related to the
thickness of the boundary layer of intra-particle diffusion model. Since non-linear method is an appropriate model
Table 3. Estimated regression coefficients of significant factors (coded units) and their effects for DOX entrapment
Term Effect Coefficient t-Value P-Value DF SS MS F-Value Error / %
Constant (x) 44.2 61.8 0 1 − − − −
pH 74.3 40.02 55.2 0 1 5231.8 5231.8 2982.1 29.8
A 4.12 2.12 3.08 0.006 1 148.2 148.2 9.16 0.41
D 4.02 2.07 3.05 0.007 1 132.7 132.7 8.3 5.23
T 4.22 2.22 3.09 0.005 1 151.3 151.3 9.42 0.58
pHA −0.42 −0.16 −0.27 0.601 1 1.9 1.9 0.12 3.52
pHD 2.89 1.81 2.12 0.014 1 113.7 113.7 6.1 0.21
pHT −0.21 −0.11 −0.13 0.749 1 0.3 0.3 0.02 11.99
AD −0.19 −0.99 −0.09 0.689 1 0.1 0.1 0.01 1.12
AT 0.12 0.072 0.11 0.902 1 1.2 1.2 0.1 10.89
DT −0.39 −0.17 −0.29 0.653 1 2.3 2.3 0.14 0.13
pHAD −0.42 −0.23 −0.34 0.695 1 8.2 8.2 0.42 3.99
pHAT −1.01 −0.52 −0.76 0.398 1 4.1 4.1 0.18 0.82
pHDT −0.67 −0.33 −0.53 0.491 1 2.02 2.02 0.12 18.88
ADT −0.49 −0.21 −0.31 0.623 1 5.3 5.3 0.23 1.02
pHADT −0.78 −0.42 −0.57 0.426 1 6.4 6.4 0.33 2.32
DF: degree of freedom; SS: sum of squares; MS: mean square; A: adsorbent dosage; D:drug concentration; T: time.
Table 4. Observed and predicted values of DOX adsorption efficiency
Run pH A D T Drug loading / % Residual
Theoretical Experimental
1 –1 –1 –1 –1 1.23 1.42 0.32
2 1 –1 –1 –1 70.02 78.2 −0.31
3 –1 1 –1 –1 4.82 4.02 −0.29
4 1 1 –1 –1 89.3 80.05 −0.58
5 –1 –1 1 –1 1.65 1.28 0.06
6 1 –1 1 –1 75.62 88.21 0.21
7 –1 1 1 –1 5.42 4.23 −0.62
8 1 1 1 –1 94.3 93.92 1.25
9 –1 –1 –1 1 2.88 4.82 −0.53
10 1 –1 –1 1 78.32 76.98 0.12
11 –1 1 –1 1 11 7.26 0.42
12 1 1 –1 1 89.3 88.5 0.79
13 –1 –1 1 1 3.98 4.58 −0.92
14 1 –1 1 1 94.8 95.01 1.02
15 1 1 1 1 95.23 96 1.31
16 –1 1 1 1 6.8 7.23 −2.33
to predict the optimum sorption kinetics,40,41 therefore the
experimental data were fitted to the kinetics models by non-linear regression, trial and error method using Solver add-In in Microsoft Excel.
The corresponding kinetic parameters are summarized in Table 5. The validity of each kinetic model was checked by regression index R2 and residual sum of squares (RSS).
The experimental data and predicted kinetics models shown in Figure 8.
R² = 0.9912
0 20 40 60 80 100
0 20 40 60 80 100
Predicted values /
%
Obseved values / %
Figure 7. Correlation between the experimental and predicted values.
Table 5. Kinetics parameters for DOX adsorption on MWNTs-PEG by various kinetic models
Kinetic model Parameter Value Kinetic model Parameter Value
Pseudo-first order
qe 12.026
Elovich
α 103.42
K1 0.345 β 0.596
R2 0.994 R2 0.992
RSS 0.749 RSS 1.009
Pseudo-second order
qe 13.133
intra-particle diffusion
Ci 6.867
K2 0.043 Ki 0.467
R2 0.999 R2 0.979
RSS 0.037 RSS 2.796
R: correlation coefficient; RSS: residual sum of squares; qe: equilibrium adsorption capacity; K1: pseudo-first order constant; K2: pseudo-second order rate constant; α: initial adsorption rate; β: desorption constant; Ci: thickness of the boundary layer of intra-particle diffusion model.
0 2 4 6 8 10 12 14 0 0 10 10 20 20 30 30 40 40
time / min
time / min
Pseudo-first order model
Experimental data (a) (c) 0 2 4 6 8 10 12 14 0 0 10 10 20 20 30 30 40 40 q
/ (mg g
)
t
-1
q
/ (mg g
)
t
-1
q
/ (mg g
)
t
-1
q
/ (mg g
)
t
-1
time / min
time / min
Pseudo-second order model
Experimental data (b) (d) 0 0 2 2 4 4 6 6 8 8 10 10 12 12 14 14 Elovich model Experimental data
Intraparticle diffusion model
Experimental data
Figure 8. Adsorption kinetics of DOX on MWNTs-PEG: (a) pseudo-first order; (b) pseudo-second order; (c) Elovich and (d) intra-particle diffusion models.
0 2 4 6 8 10 12 14 0 0 10 10 20 20 30 30 40 40 time / min
time / min
Pseudo-first order model
Experimental data (a) (c) 0 2 4 6 8 10 12 14 0 0 10 10 20 20 30 30 40 40 q
/ (mg g
)
t
-1
q
/ (mg g
)
t
-1
q
/ (mg g
)
t
-1
q
/ (mg g
)
t
-1
time / min
time / min
Pseudo-second order model
Experimental data (b) (d) 0 0 2 2 4 4 6 6 8 8 10 10 12 12 14 14 Elovich model Experimental data
Intraparticle diffusion model
On comparing the R2 and RSS for the different models
(Table 5), it can be said that the pseudo-second order is the best model as it has the highest regression coefficients values (R2) and the lowest RSS. Its equilibrium sorption
capacities is 13.133 mg g−1 which is very close to
experimental value. The better fit of the pseudo-second order model therefore indicates that the adsorption depends on the adsorbate as well as the adsorbent and involves chemisorption process (electrostatic interaction, hydrogen bonding and π-π stacking interaction) in addition to physisorption. The chemisorption might be the rate-limiting step where valency forces are involved via electrons sharing or exchange between the adsorbent and the adsorbate.42
However, it is not possible to conclude that, in all the time range, the chemisorption reaction is the rate-limiting step. This conclusion may not be valid because a good model fit does not necessarily indicate the real nature of the rate-limiting step. In many other chemisorption cases, diffusion rather than the chemical reaction was the rate-limiting step, at least in the initial instants. Curves in Figure 8 also reveal that DOX adsorption on MWNTs-PEG easily take place, as 90% of the adsorption was achieved within initial 7 min.
Isothermal studies of the adsorption
The isotherm study was carried out by varying initial DOX concentration from 20 to 80 mg L−1 at temperature
range 293-310 K (Figure 9). Two different models (Langmuir and Freundlich isotherm models) were applied to simulate the experiment data.43
The Langmuir equation (simplest theoretical model) is valid for monolayer adsorption on a surface with a finite number of identical sites and is expressed as:
max e e
q C
Q =
L e
1 + K C (10)
where Ce is equilibrium solution concentration (mg g−1), q is
the solid phase concentration (mg g−1), q
max is the maximum
adsorption capacity and KL is the Langmuir constant related
to affinity of the binding sites. Freundlich model is an empirical equation based on adsorption on a heterogeneous surface or surfaces supporting sites of varied affinities. It is
assumed that the stronger binding sites are occupied first and that the binding strength decreases with the increasing degree of site occupation. The isotherm is expressed as:
qe = kFCe1/n (11)
where kF is a Freundlich constant related to adsorption
capacity (L g−1), 1/n is an empirical parameter related to
adsorption intensity. The magnitude of the exponent n gives an indication on the favorability of adsorption. It is generally stated that values of n in the range 2-10 represent good, 1-2 moderately difficult, and less than 1 poor adsorption characteristics. The isotherm constants and determination coefficients are summarized in Table 6.
The regression coefficients of Freundlich model (R2 = 0.9904-0.9931), indicate that the Freundlich model
gave a better fit than Langmuir model on the adsorption of DOX. This result may be due to the heterogeneous distribution of active sites on the edge and two sides of the nanocarrier.
The results show that the values of the Freundlich exponent n were greater than 2, which confirm that the adsorption for the DOX is favorable.
Thermodynamic study
Thermodynamic parameters are used to judge whether the reaction occurs spontaneously or not. The
0 10 20 30 40 50 60
0 10 20 30 40 50
C / (mg L )e -1
q
/ (mg g
)
e
-1
293 298 310
Figure 9. Effect of temperature on DOX adsorption (C0 = 10, 20, 50, 70 and 80 mg L−1, m
(MWNTs-PEG) = 0.8 g L−1, pH 7, time = 35 min).
Table 6. Isotherm parameters for the adsorption of DOX on MWNTs-PEG
Temperature / K Langmuir isotherm model Freundlich isotherm model
qmax KL R2 KF n R2
288 53.402 1.032 0.9326 24.924 4.843 0.9904
298 41.597 0.823 0.9275 22.888 4.531 0.9931
310 28.98086 0.595 0.9333 20.7055 4.333 0.9898
R2: correlation coefficient; q
max: maximum adsorption capacity; KL: Langmuir constant related to affinity of the binding sites; KF: Freundlich constant; n: Freundlich constant, sorption intensity.
0 10 20 30 40 50 60
0 10 20 30 40 50
C / (mg L )e -1
q
/ (mg g
)
e
-1
thermodynamic parameters, enthalpy (∆H0), change in
standard Gibbs free energy (∆G0) and entropy (∆S0) for the
adsorption, were also deduced using the equations 12-14:44
0
0 3 0 1
–ΔH 1 1
ln K (T ) – ln K (T ) = –
R T3 T1
(12)
∆G0 = –RT ln K
0 (13)
0
0 0
ΔG – ΔH ΔS = –
T (14)
where ∆H0 (kJ mol−1), ∆G0 (kJ mol−1) and ∆S0 (J mol−1 K−1) are
changes of enthalpy, free energy and entropy, respectively; R is the universal gas constant (8.314 J mol−1 K−1); T is the
absolute temperature (K); K0 is the ratio of concentration
of DOX on adsorbentat equilibrium (qe) to the remaining
concentration of the DOX in solution at equilibrium (Ce).
K0 can be obtained from the intercept of ln (qe/Ce) vs. qe
plot (Figure 10). The thermodynamic parameters were calculated and are listed in Table 7. The negative values of ∆G0 at three tested temperatures reveal that the adsorption
process is spontaneous. The negative values of ∆H0 suggest
that the interaction of DOX adsorbed by nanocarrier is an exothermic process, the negative values of ∆S0 indicate
decreased randomness at the adsorbent/solution interface during the adsorption of DOX on nanocarrier.
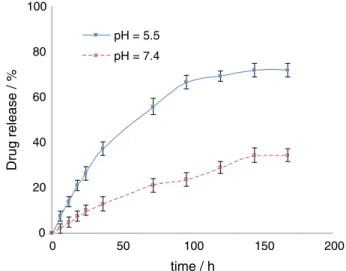
In vitro release of DOX
DOX release profile of the drug loaded nanocarrier in buffer solution of pH 7.4 and 5.5 has been presented in Figure 11. Release curves show a rapid release process in the initial stage, and followed by a slow and sustained release process, which seems to continue for a prolonged period of time. The release rate in pH 5.5 is faster than release rate in pH 7.4. This trend was attributed to the increased hydrophilicity and higher solubility of DOX at lower pH caused by increased protonation of NH2 groups on DOX,
thereby reducing the hydrophobic interaction between DOX and nanocarrier. The pH dependent drug release from MWNTs could be exploited for drug delivery applications since the micro environments of extracellular tissues of tumors and intracellular lysosomes and endosomes are acidic, potentially facilitating active drug release from MWNTs-PEG.
Conclusions
In this research work, the MWNTs-PEG adsorbent was prepared and characterized by using several methods. The performance of MWNTs-PEG as a carrier for controlled-release of DOX is investigated. For this purpose, the drug loading and release behavior of the modified MWNTs studied. The full factorial experimental designs is used to investigate the effects of drug concentration, adsorbent dosage, pH and time on the adsorption for the DOX on the nanocarrier. The mathematical model showed that the pH has the most significant effect on the adsorption.
Under optimal conditions, 96% of DOX adsorption was achieved. Four kinetic and two isothermal models were investigated by non-linear regression method. The pseudo-second order kinetic model shows the best fitting of DOX, indicating the possible involvement of
Table 7. Thermodynamic parameters for DOX adsorption on
MWNTs-PEG
Thermodynamic parameter
K0 / (kJ mol−1)
∆G0 / (kJ mol−1)
∆H0 / (kJ mol−1)
∆S0 / (J mol−1)
293 603.23 –15.60
–44.6 –101
298 411.25 –14.91
310 217.22 –13.87
K0: ratio of concentration of DOX on adsorbentat equilibrium to the remaining concentration of the DOX in solution at equilibrium; ∆G0: change of free energy; ∆H0: change of enthalpy; ∆S0: change of entropy.
Figure 10. Plots of ln(qe/Ce) vs. qe for DOX adsorbed on MWNTs-PEG.
0 20 40 60 80 100
0 50 100 150 200
time / h
Dr
ug release / %
pH = 5.5
pH = 7.4
Figure 11. Release of DOX from MWNTs-PEG at pH 5.5 and 7.4.
0 20 40 60 80 100
0 50 100 150 200
time / h
Dr
ug release / %
chemisorption. The adsorption isotherms were well described by the Freundlich model, which indicate heterogeneous surface where the stronger binding sites are occupied first and the binding strength decreases with the increasing degree of site occupation. The negative values of indicate the spontaneous nature of DOX adsorption on the adsorbent and negative values of shows an decrease of randomness of the adsorbent/solution. The negative value of reveals the exothermic nature of the adsorption and in this case electrostatic interactions are dominant. The rapid desorption of DOX from MWCNTs-PEG in acidic solution (pH 5.5) rather than pH 7.4 demonstrated that the drug release of the nanocarrier is pH dependent.
Acknowledgements
The authors gratefully acknowledge the support of this work by the Imam Khomeini International University, Qazvin, Iran Research for financial support and providing laboratory facilities for this work.
References
1. Bethune, D. S.; Kiang, C. H.; Devries, M. S.; Gorman, G.; Savoy, R.; Vazquez, J.; Beyers, R.; Nature 1993, 363, 605. 2. Iijima, S.; Ichihashi, T.; Nature 1993, 363, 603.
3. Bianco, A.; Hoebeke, J.; Godefroy, S.; Chaloin, O.; Pantarotto, D.; Briand, J. P.; Muller, S.; Prato, M.; Partidos, C. D.; J. Am. Chem. Soc. 2005, 127, 58.
4. Bianco, A.; Kostarelos, K.; Prato, M.; Curr. Opin. Chem. Biol.
2005, 9, 674.
5. Klumpp, C.; Kostarelos, K.; Prato, M.; Bianco, A.; Biochim. Biophys. Acta, Biomembr. 2006, 1758, 404.
6. Kostarelos, K.; Lacerda, L.; Pastorin, G.; Wu, W.; Wieckowski, S.; Luangsivilay, J.; Godefroy, S.; Pantarotto, D.; Briand, J. P.; Muller, S.; Prato, M.; Bianco, A.; Nat. Nanotechnol. 2007, 2, 108. 7. Lacerda, L.; Bianco, A.; Prato, M.; Kostarelos, K.; Adv. Drug
Delivery Rev. 2006, 58, 1460.
8. Lacerda, L.; Pastorin, G.; Wu, W.; Prato, M.; Bianco, A.; Kostarelos, K.; Adv. Funct. Mater. 2006, 16, 1839.
9. Pantarotto, D.; Singh, R.; McCarthy, D.; Erhardt, M.; Briand, J. P.; Prato, M.; Kostarelos, K.; Bianco, A.; Angew. Chem. 2004,
116, 5354.
10. Pastorin, G.; Wu, W.; Wieckowski, S.; Briand, J. P.; Kostarelos, K.; Prato, M.; Bianco, A.; Chem. Commun. 2006, 21, 1182. 11. Singh, R.; Pantarotto, D.; Lacerda, L.; Pastorin, G.; Klumpp, C.;
Prato, M.; Bianco, A.; Kostarelos, K.; Proc. Natl. Acad. Sci. U. S. A. 2006, 103, 3357.
12. Chou, A.; Bocking, T.; Singh, N. K.; Gooding, J. J.; Chem. Commun. 2005, 7, 842.
13. Maeda, H.; Adv. Enzyme Regul. 2001, 41, 189.
14. Iyer, A. K.; Khaled, G.; Fang, J.; Maeda, H.; Drug Discovery Today 2006, 11, 812.
15. Lacerda, L.; Russier, J.; Pastorin, G.; Herrero, M. A.; Venturelli, E.; Dumortier, H.; Al-Jamal, K. T.; Prato, M.; Kostarelos, K.; Bianco, A.; Biomaterials 2012, 33, 3334. 16. Boncel, S.; Zajac, P.; Koziol, K. K.; J. Controlled Release 2013,
169, 126.
17. Abi, T. G.; Karmakar, T.; Taraphder, S.; Comput. Theor. Chem.
2013, 1010, 53.
18. Feng, W.; Ji, P.; Biotechnol. Adv. 2011, 29, 889.
19. Chen, Q.; Kaneko, T.; Hatakeyama, R.; Curr. Appl. Phys. 2011,
11, S63.
20. Porter, A. E.; Gass, M.; Muller, K.; Skepper, J. N.; Midgley, P. A.; Welland, M.; Nat. Nanotechnol. 2007, 2, 713.
21. Prakash, S.; Malhotra, M.; Shao, W.; Tomaro-Duchesneau, C.; Abbasi, S.; Adv. Drug Delivery 2011, 63, 1340.
22. Torchilin, V. P.; Eur. J. Pharm. Sci. 2000, 11, S81.
23. Tagmatarchis, N.; Prato, M.; J. Mater. Chem. 2004, 14, 437. 24. Chen, J.; Meziani, M. J.; Sun, Y. P.; Cheng, S. H.; Toxicol. Appl.
Pharmacol. 2011, 250, 184.
25. Ciofani, G.; Raffa, V.; Mini-Rev. Med. Chem. 2009, 9, 1251. 26. Cheng, J.; Meziani, J.; Sun, Y. P.; Cheng, Sh. H.; Int. J. Pharm.
2011, 25, 184.
27. Zhang, Y.; Xu, Y.; Li, Z.; Chen, T.; Lantz, S. M.; Howard, P. C.; Paule, M. G.; Slikker, W.; Watanabe Jr., F.; Mustafa, T.; Biris, A. S.; Ali, S. F.; ACS Nano 2011, 5, 7020.
28. Ezzati Nazhad Dolatabadi, J.; Jamali, A. A.; Hasanzadeh, M.; Omidi, Y.; Int. J. Biosci. Biochem. Bioinforma.2011, 1, 21. 29. Liu, Z.; Sun, X.; Nakayama-Ratchford, N.; Dai, H.; ACS Nano
2007, 1, 50.
30. Modi, C. D.; Patel, S. J.; Desai, A. B.; Murthy, R.; J. Appl. Pharm. Sci. 2011, 1, 103.
31. Vashist, S. K.; Zheng, D.; Pastorin, G.; Al-Rubeaan, K.; Luong, J. H. T.; Sheu, F. S.; Carbon 2011, 49, 4077.
32. Datsyuk, V.; Kalyva, M.; Papagelis, K.; Parthenios, J.; Tasisb, D.; Siokou, A.; Kallitsis, I.; Galiotis, C.; Carbon 2008, 46, 833. 33. Dyke, A.; Tour, J. M.; J. Am. Chem. Soc. 2003, 125, 1156. 34. Dresselhaus, M. S.; Dresselhaus, G.; Jorio, A.; Souza Filho,
A. G.; Samsonidze, G. G.; Saito, R.; J. Nanosci. Nanotechnol.
2003, 3, 19.
35. Buisson, J. P.; Chauvet, O.; Lefant, S.; Stephan, C.; Benoit, J. M.; Mater. Res. Soc. Symp. Proc.2001, 633, A14.
36. Bingol, D.; Tekin, N.; Alkan, M.; Appl. Clay Sci. 2010, 50, 315.
37. Dash, S.; Murthy, P. N.; Nath, L.; Chowdhury, P.; Drug. Res.
2010, 67, 217.
38. Cheung, W. H.; Szeto, Y. S.; McKay, G.; Bioresour.Technol.
2007, 98, 2897.
39. Ma, W.; Ya, F. Q.; Han, M.; Wang, R.; J. Hazard. Mater. 2007,
143, 296.
41. Ho, Y. S.; Water Res.2006, 40, 119.
42. Ho, Y. S.; McKay, G.; Process Biochem. 1999, 34, 451. 43. Khaled, A.; Nemr, A. E.; Sikaily, A. E.; Abdelwahab, O.;
J. Hazard. Mater. 2009, 165, 100.
44. Venkatesha, T. G.; Viswanatha, R.; Nayaka, Y. A.; Chethana, B. K.; Chem. Eng. J. 2012, 198, 1.
Submitted: August 13, 2015