ISSN 0104-6632 Printed in Brazil
www.abeq.org.br/bjche
Vol. 25, No. 03, pp. 585 - 601, July - September, 2008
Brazilian Journal
of Chemical
Engineering
PERFORMANCE PREDICTION AND VALIDATION
OF EQUILIBRIUM MODELING FOR
GASIFICATION OF CASHEW NUT SHELL CHAR
M. Venkata Ramanan
*, E. Lakshmanan, R. Sethumadhavan and S. Renganarayanan
1
Institute for Energy Studies, College of Engineering, Anna University,
Phone:+(91) (44) 2220-3269, Fax:+(91) (44) 2235-3637, Chennai, Tamilnadu, PIN: 600025, India. E-mail [email protected], E-mail: [email protected]
www.annauniv.edu
(Received: May 21, 2007 ; Accepted: March 15, 2008)
Abstract - Cashew nut shell, a waste product obtained during deshelling of cashew kernels, had in the past been deemed unfit as a fuel for gasification owing to its high occluded oil content. The oil, a source of natural phenol, oozes upon gasification, thereby clogging the gasifier throat, downstream equipment and associated utilities with oil, resulting in ineffective gasification and premature failure of utilities due to its corrosive characteristics. To overcome this drawback, the cashew shells were de-oiled by charring in closed chambers and were subsequently gasified in an autothermal downdraft gasifier. Equilibrium modeling was carried out to predict the producer gas composition under varying performance influencing parameters, viz., equivalence ratio (ER), reaction temperature (RT) and moisture content (MC). The results were compared with the experimental output and are presented in this paper. The model is quite satisfactory with the experimental outcome at the ER applicable to gasification systems, i.e., 0.15 to 0.30. The results show that the mole fraction of (i) H2, CO and CH4 decreases while (N2 +H2O) and CO2 increases with ER, (ii) H2 and CO
increases while CH4, (N2 +H2O) and CO2 decreases with reaction temperature, (iii) H2, CH4, CO2 and (N2 +
H2O) increases while CO decreases with moisture content. However at an equivalence ratio less than 0.15, the
model predicts an unrealistic composition and is observed to be non valid below this ER. Keywords: Equilibrium modeling; Gasification; Cashew shell char; Producer gas,
INTRODUCTION
Cashew (Kingdom - Plantae, Division - Magnoliophyta, Class - Magnoliopsida, Order - Sapindales, Family - Anacardiaceae, Genus - Anacardium, Species - A occidentale, Binomial name - Anacardium occidentale L) (http://en.wikipedia.org/wiki/Cashew), native to eastern Brazil, was introduced into India, just as other commercial crops like rubber, coffee, tea etc. by the Portuguese nearly five centuries ago. The cashew was introduced into India in Goa, from where it spread to other parts of the country. In the beginning it was mainly considered as a crop for afforestation and soil binding to check erosion. The nuts, apple and other
by-products of this crop are of commercial importance. Because of its adaptability to a wide range of agroclimatic conditions, it has become a crop of high economic value and has attained the status of an export-oriented commodity, contributing considerably to the foreign exchange earnings of the country (http://dacnet.nic.in/cashewcocoa/cashew.htm).
Statistics Division, Ministry of Agriculture, Government of India, 2003).
The cashew tree, generally a spreading, evergreen tree, has simple, alternate, glabrous, penninerved leaves. The true fruit of the cashew tree is a kidney or boxing-glove shaped drupe that grows at the end of the pseudo-fruit. The cashew fruit (Figures 1 and 2) is unusual in comparison with other tree nuts since the nut is outside the fruit. The cashew apple is an edible pseudo fruit, attached to the externally born nut by a stem. In its raw state, the shell of the nut is leathery, not brittle. It contains thick vesicant oil, cashew nut shell liquid (CNSL), within a sponge-like interior. A thin skin, called the testa surrounds the kernel and separates it from the inside of the shell. The primary products of cashew nuts are the kernels which are valuable as confectionery nuts, CNSL _ an important industrial raw material for resin manufacture and the shells – burnt (combusted) inefficiently for meeting thermal energy requirements.
CASHEW PROCESSING
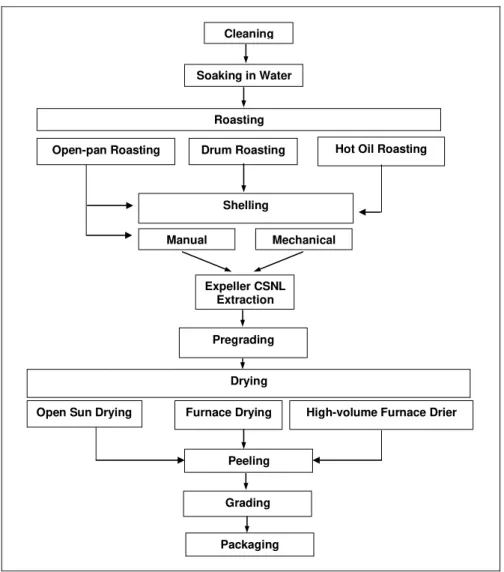
Traditionally, extraction of the kernel from the shell of the cashew nut has been a manual operation. The nut is roasted, which makes the shell brittle and loosens the kernel from the inside of the shell. By soaking the nuts in water, the moisture content of the kernel is raised, reducing the risk of it being scorched during roasting and making it more flexible so it is less likely to crack. The CNSL is released when the nuts are roasted. The shell can be cracked either manually, using a hammer or mechanically. Manually operated blade openers are relatively
inexpensive. Once the kernel is removed from the shell, it is dried, the testa is peeled off and the kernel is graded. Figure 3 gives an overview of cashew nut processing and the various choices of method.
The cashew nut shells (CNS), generated as a waste by-product, are being sold at a throw away price. Due to their low cost and abundant availability, cashew shells are utilized in an inefficient manner. These shells are burnt in a way that is generally regarded as a disposal option rather than a source of energy. The CNSL is reported to be 15-20% by weight of the unshelled nut in Africa, 25-30% by weight in India and 25% overall (Piyali Das and Anuradda Ganesh, 2003).
GASIFICATION OF CASHEW SHELL
Owing to the rise in the cost of conventional fuel and its difficult sourcing problems, attention is now being focused towards an efficient utilization of cashew shells. Gasification is one of the effective and efficient bioenergy conversion technologies _ known for its modularity, turn down ratio and fuel versatility _ available for harnessing this renewable bioenergy resource. Attempts have been made to convert these shells into a burnable low btu gas. However the inherent CNSL content of these shells make the gasification technology infeasible in the long run (IES, Anna University, 2006). In order to overcome the drawback posed by CNSL, the shells were charred in a chamber, thereby de-oiling them for consequent gasification. The characteristics of raw and charred cashew nut shell (charred CNS) are presented in Tables 1 and 2. The bulk density of charred CNS was measured to be 190 kg/m3, indicating its amenability for gasification.
Cashew
Nut Shell
Testa
Kernel
Cleaning
Soaking in Water
Roasting
Open-pan Roasting Drum Roasting Hot Oil Roasting
Shelling
Mechanical Manual
Expeller CSNL Extraction
Pregrading
Drying
Open Sun Drying Furnace Drying High-volume Furnace Drier
Peeling
Grading
Packaging
Figure 3: Cashew Processing – An Outline
Table 1: Proximate analysis of raw and charred cashew shells
CNS
(wt% on an as-received basis)
Charred CNS (wt% on an as-received basis)
Moisture 10.43 7
Volatile Matter 69.31 28
Fixed Carbon 19.26 59
Ash 1.00 6
Table 2: Ultimate analysis of raw and charred cashew shells
CNS
(wt% on an as-received basis)
Charred CNS (wt% on an as-received basis)
Carbon 48.7 63
Hydrogen 6.96 3.6
Nitrogen 0.36 6.4
EXPERIMENTAL SETUP
The main objective of this study was (i) to investigate the feasibility of gasification of cashew nut shells in a down-draught gasifier in the long run and (ii) to ascertain the effect of equivalence ratio (ER), moisture content (MC) and reaction temperature (RT) on gasification of cashew nut shells. Figures 4 (a), (b) and (c) depict a schematic diagram and a photograph of the experimental setup.
An induced air, closed-top, 20 kWe, down-draught
gasifier was chosen for the study. Provision for air entry into the gasification system was made through two inclined tuyeres, unclosed at the throat. A grate made of SS was used for holding the feedstock. The region between throat and grate functioned as a reduction zone. The hot gas generated was passed
along the annuli of the reduction zone for maintenance of high reaction temperature and minimization of heat loss. A cyclone separator was placed at the gasifier outlet ahead of the ID blower to remove particulates. An aerated burner was used for flaring the producer gas generated. The whole gasifier assembly was mounted on a toughened helical spring, enabling it to vibrate to ensure a smooth fuel flow. A poking rod was fixed at the bottom and linked to the grate. Pushing and pulling the poking rod created an impact on the grate, thereby disintegrating and discharging any clogged residual particles into the ash box. Provisions were made for measuring the temperature, pressure and gas composition at appropriate location in the gasifier. A stand with a ladder arrangement was used for feeding the raw material in at the fuel feed port.
M
22
50
Ø1030
Ø 465
95
0
1
150
130
0
47
5
20
0
Grate Throat
Poking rod Vibrator
Cyclone Separator
ID Blower Air pipe Control valve
Aerated burner T1
T2
T3
T4
T6
T5 S
Tar port
P1 & P2 - Pressure tapping T1 to T6 - K typeThermocouples S - Gas sampling port All dimensions are in mm P1
Annular space
P2
Figure 4(b): Photograph of experimental setup Figure 4(c): Gasification of CNSC
PROCESS INSTRUMENTATION AND CONTROL
The base fuel characteristics were established with a proximate analyzer (muffle furnace + micro weighing balance with associated auxiliaries). The parameters studied included moisture content (ASTM D 3173-73), volatile matter (ASTM D 3175-73) and ash content (ASTM D 3174-3175-73). The remainder was fixed carbon (FC). The calorific value of cashew shell was established using a standardized (benzoic acid-based) bomb calorimeter and the result was observed to match well the correlations framed for estimation of calorific value for biofuels (Parikh et al. 2005). A Junkers gas calorimeter was used for determining the calorific value of producer gas. Producer gas composition was analyzed using a Siemens Oxymat 61 online gas analyzer (which estimates O2 using the paramagnetic principle),
Ultramat 23 (which estimates CO, CO2 and CH4
using nondispersive infrared multilayer technology) and Calomat 61 (which estimates H2 using the
thermal conductivity principle). Details regarding the producer gas composition were recorded on the PC every second using Siprom-GA software. The gas sampling system consisted of a wash bottle, a condensation pot, a coalescence filter, a suction pump, a fine filter, a flame arrestor and a diaphragm pump. Chromel-Alumel (K-type) thermocouples were used for measuring the temperature in different zones (T1 to T6). Thermocouples were fixed permanently and measured continuously in all zones except at the throat (T4). For temperature measurement at the throat, a flexible K-type
thermocouple was inserted along the air port at regular intervals. Temperatures from different zones were logged simultaneously using an Agilent (34907 A) data acquisition system. The surface temperature of the gasifier was measured with a Kane infrared thermometer (UEI-INF 200). An Airflow thermoanemometer (TA 35) was used for measuring the air flow to the gasifier. A calibrated S-type Pitot Tube & Comark digital manometer was employed for establishing the producer gas flow. The air entry into the system, and thus the ER, is controlled by a globe valve placed at the discharge end of the blower. Water-filled U-tube manometers were deployed for measuring the pressure buildup across the gasifier bed.
EXPERIMENTAL PROCEDURE
reduction zone. The fuel consumption rate was measured by recharging the gasifier on an hourly basis and filling the gasifier volume to a predetermined level at the top of the gasifier hopper. The ash door was operated at regular intervals to remove the ash that had accumulated on the grate.
The major influential parameters in the performance of gasification system are equivalence ratio, the bed temperature and moisture content of the feed stock. Equivalence ratio was varied by adjusting the air supplied to the gasifier bed. Since, the gasifier used was autothermal, the option of maintaining constant bed temperature for varying equivalence ratio/moisture content was ruled out. The experiments were conducted in various permutations and combinations and the outcomes are compared with the modeled results.
EQUILIBRIUM MODELING
The typical chemical formula of CNS char, based on a single atom of carbon, is observed to be CH0.686O0.32. Equilibrium modeling was carried out,
based on this formula, for predicting its gasification characteristics.
The following assumptions are made in the modeling approach:
The ideal gas laws are valid.
All reactions are at thermodynamic equilibrium. Gases are in equilibrium during flow through the
char bed.
The pressure in the char bed is atmospheric and constant.
Reactions proceed adiabatically.
Nitrogen present in both fuel and air is inert. Ash is inert and is not involved in any of the
reactions, either as a chemical species or as a catalyst.
No radial temperature gradients/concentrations exist.
No gas is accumulated in the char bed.
There is no resistance to conduction of heat and diffusion of mass inside the char particles.
There is no tar in the gasification zone. Carbon conversion efficiency is 100 %
Producer gas comprises only CO2, CO, H2, CH4,
N2 and H2O.
Based on the above assumptions, the global reaction of CNS char with air could be written as
CH0.686O0.32 + w H2O + m O2 + 3.76 m N2 = x1 H2 +
(1) x2 CO + x3 CO2 + x4 H2O + x5 CH4 + 3.76 m N2
The above reaction represents an overall reaction, but a number of competing intermediate reactions take place during the process, of which the following are predominant:
Oxidation
C + O2 = CO2 (- 393.8 kJ / mol) (2)
Steam gasification
C + H2O = CO + H2 (+ 131.4 kJ / mol) (3)
Boudouard reaction
C + CO2 = 2CO (+ 172.6 kJ / mol) (4)
Methanation reaction
C + 2H2 = CH4 (- 74.9 kJ / mol) (5)
Water gas shift reaction
CO+ H2O = CO2 + H2 ( - 41.2 kJ / mol) (6)
Of these, only four reactions are independent, the oxidation, steam gasification, Boudouard and methanation reactions. The water gas shift reaction can be considered as the subtraction of the steam gasification and Boudouard reactions. According to Von Fredersdorff and Elliot (1963) the oxidation reaction is typically assumed to be very fast and is completed quickly, while the other three reactions, namely boudouard, steam gasification and methanation, are in equilibrium. As observed, the water gas shift reaction is a combination of the boudouard and steam gasification reactions. Hence, the water gas shift and methanation reaction could be considered to be in equilibrium.
The equilibrium constants for the methanation and water gas shift reactions [Eq. (5)] are
4
2
CH
1 2
H P K
p
= (7)
2 2
2
CO H
2
CO H
P P
K
P P O
⋅ =
⋅ (8)
molar composition of five unknown species in the producer gas and the oxygen content for the reaction. Hence, to predict the constituents of producer gas, a set of six equations, formulated by balancing the different constituents involved in the global reaction, is required.
Carbon balancing
1 = X2 + X3 +X5 (9)
Hydrogen balancing
2 w + 0.6847 = 2 X1 + 2 X4 + 4 X5 (10)
Oxygen balancing
w + 0.3217 + 2 m = X2 + 2 X3 + X4 (11)
Equilibrium constant from methanation [Eq. (5)]
( )
51 2
1
X K
X
= (12)
Equilibrium constant from the shift reaction [Eq. (8)]
( )( )
( )( )
2 4 1 3 2 X X X XK = (13)
mass of water
MC 100%
mass of wet biomass
= × (14)
18 w
MC 100%
17.80 18 w
= ×
+ (15)
When moisture content is known, the value of w is a constant.
The reaction process is assumed to be adiabatic, and hence heat balancing of the reactants and products of the global reaction results in the equation shown:
2
O2 N2
H2 CO CO2 H O2
CH4 H2 CO
CO2 H O2 CH4 N2
f fH O(1) (vap)
CNSC
f f
1 f 2 f 3 f 4 f
5 f 1 p 2 p
3 p 4 p 5 p p
H w(H H )
m H 3.76m H
X H X H X H X H
X H T (X C X C )
X C X C X C 3.76 mC )
° + ° + + ° + ° ° + ° + ° + ° + ° + ∆ + + + + = (16)
The heating value of the fuel (
CNSC
H f° ) was determined experimentally with a bomb calorimeter. The heat of formation of the various gases could be sourced from the JANAF thermochemical tables (Stull and Prophet, 1971) and the ∆H° for the gases constituting the present study are presented in Table 3. The dependence of specific heat on temperature is given by various empirical equations and the most simplified version (Robert and Don, 1984) is
CP R[ A BTam am
C 2 D
(4T am T T )1 2 ]
3 T T1 2
= + +
− +
(17)
The values of the heat capacity constants, applicable to our equations, are shown in Table 4.
The equilibrium constant K is a function of temperature and could be equated as (Zainal et al. 2001)
-RT ln K = ∆ ° G (18)
d ln K ∆H 2
dT =RT
°
(19)
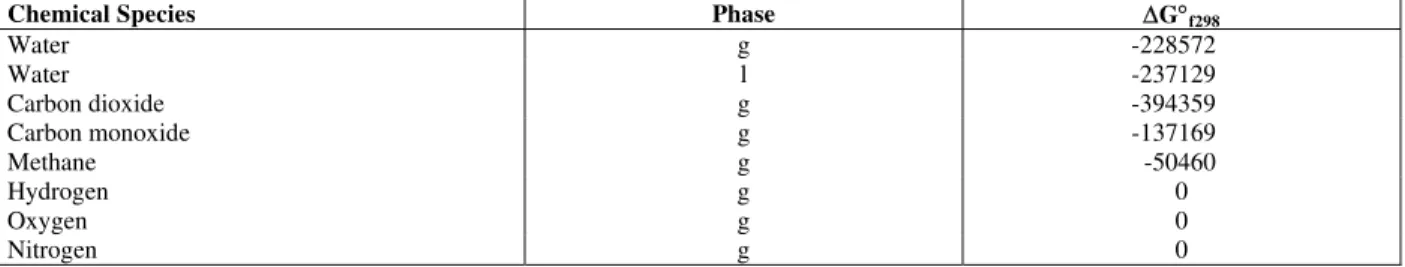
The values of standard Gibbs function of formation for various gas compositions involved are shown in Table 5 (Stull and Prophet, 1971)
Heat of formation is basically a function of temperature, and hence Eq. (19) can be integrated as follows (Zainal et al. 2001):
H
ln K dT I
2 RT
∫∆ °
= + (20)
∆H° could also be equated as (Robert and Don, 1984)
J ∆H
( A)T
R R
B 2 C 3 D
T T
2 3 T
° = + ∆ +
∆ +∆ −∆ (21)
Substituting Eq. (21) into Eq. (20)
J
ln K - A ln T RT
B C 2 D
T T I
2
2 6 2T
= + ∆ +
The dependence of ∆G° on temperature can be analyzed as
G J - RT ( A ln T
B C 2 D
T T I)
2
2 6 2T
∆ = ∆ +
∆ +∆ + ∆ + (23)
Both J and I are respectively calculated from Eq. 21 and Eq. 23 at temperature 298.15 K.
Two equilibrium equations are required to determine the equilibrium constants K1 and K2. K1 is
the equilibrium constant for the reaction in Eqn. (5) and is solved as follows:
C+ 2H2 = CH4
∆ = CH4 – C - 2H2
∆A, ∆B, ∆C and ∆D can be obtained from the data on heat capacity.
The equations to determine the values of ∆A, ∆B, ∆C and ∆D can be expressed as
∆A = ACH4 – AC_ 2AH2 ∆B = BCH4 – BC – 2BH2 ∆C = CCH4 – CC – 2CH2 ∆D = DCH4 – DC – 2DH2
Application of these equations reveals the equilibrium constants for K1.
Similarly K2 is the equilibrium constant for the
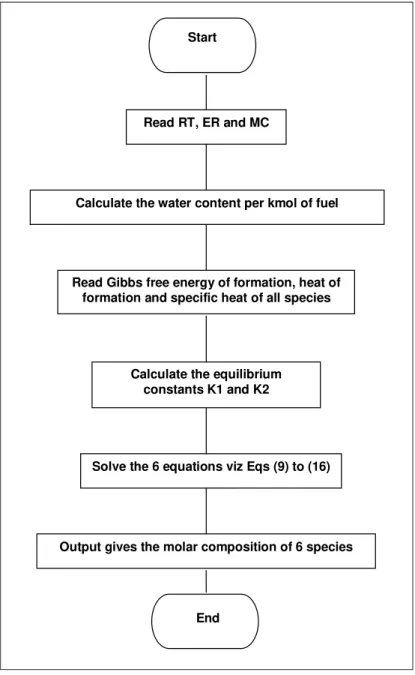
water gas shift reaction (Eq. 6) and could be solved by adopting the same procedure. Figure 5 depicts the calculation procedure for the equilibrium model in a concise fashion.
The molar concentration of individual species could be predicted by using K1 and K2 and solving
equations 9 to 16.
Table 3: Heat of formation at 298.15 K (Stull and Prophet, 1971)
Chemical Species Phase ∆H°f298
Water g -241818
Water l -285830
Carbon dioxide g -393509
Carbon monoxide g -110525
Methane g -74520
Hydrogen g 0
Oxygen g 0
Nitrogen g 0
Table 4: Heat Capacities for constants A, B, C and D (Robert and Don, 1984)
Chemical Species Tmax A 103B 106C 10-5 D
Methane 1500 1.702 9.081 -2.164 -
Hydrogen 3000 3.249 0.422 - 0.083
Carbon monoxide 2500 3.376 0.557 - -0.031
Carbon dioxide 2000 5.457 1.047 - -1.157
Nitrogen 2000 3.280 0.593 - 0.040
Water 2000 3.470 1.450 - 0.121
Carbon 2000 1.771 0.771 -0.867
Table 5: Gibbs functions of formation at 298.15 K (Stull and Prophet, 1971)
Chemical Species Phase ∆G°f298
Water g -228572
Water l -237129
Carbon dioxide g -394359
Carbon monoxide g -137169
Methane g -50460
Hydrogen g 0
Oxygen g 0
Start
Read RT, ER and MC
Calculate the water content per kmol of fuel
Read Gibbs free energy of formation, heat of formation and specific heat of all species
Solve the 6 equations viz Eqs (9) to (16)
End
Calculate the equilibrium constants K1 and K2
Output gives the molar composition of 6 species
Figure 5: Flow chart for calculation of equilibrium constant
RESULTS AND DISCUSSIONS
Effect of Equivalence Ratio on Molar Concentration
Equivalence ratio (ER) is the ratio of the actual A/F ratio to the stoichiometric A/F ratio. Discarding the fuel component, it could also be defined as the ratio of actual air supplied to the stoichiometric air requirement. For an ideal combustion, the value of ER is 1, while in practical cases it is always greater than 1, being governed predominantly by the type of fuel being combusted. For gasifiers, the value of ER would range from 0.15 to 0.4. In the process of autothermal gasification, part of fuel is burnt to
release energy to sustain the endothermic gasification reactions. The lower limit of ER in an autothermal gasifier is fixed by considering a variety of factors like the minimum quantity of air required to burn part of the fuel to release energy for supporting endothermic reactions, required carbon conversion efficiency, the fixed loss of heat that needs to be accounted for in maintaining the reactor temperature etc., Similarly, the upper limit of ER is fixed by factors like tar quantity, gas quality, reactor temperature and ash fusion point.
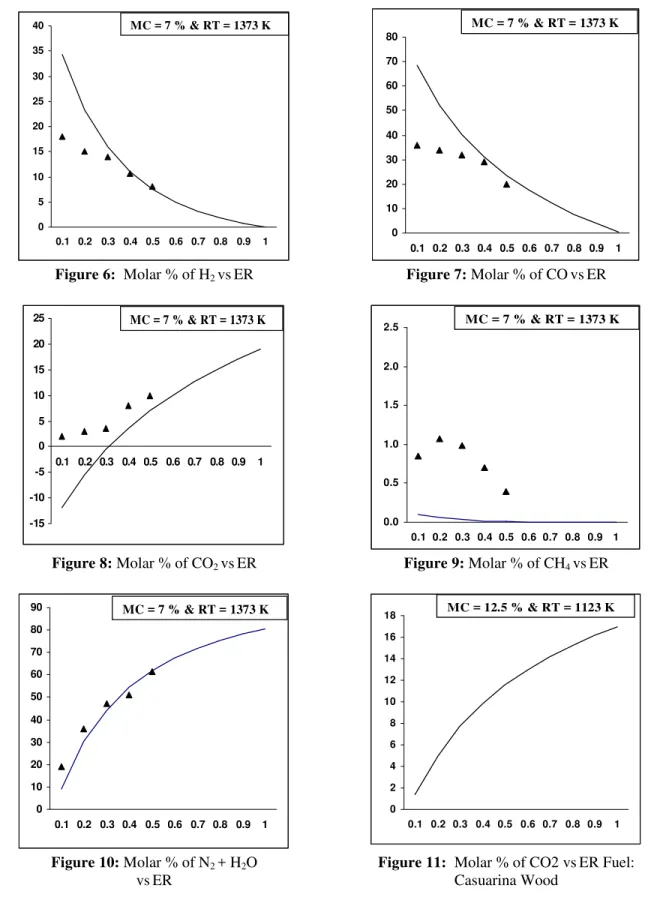
0 5 10 15 20 25 30 35 40
0.1 0.2 0.3 0.4 0.5 0.6 0.7 0.8 0.9 1 MC = 7 % & RT = 1373 K
0 10 20 30 40 50 60 70 80
0.1 0.2 0.3 0.4 0.5 0.6 0.7 0.8 0.9 1 MC = 7 % & RT = 1373 K
Figure 6: Molar % of H2 vsER Figure 7: Molar % of COvsER
-15 -10 -5 0 5 10 15 20 25
0.1 0.2 0.3 0.4 0.5 0.6 0.7 0.8 0.9 1 MC = 7 % & RT = 1373 K
0.0 0.5 1.0 1.5 2.0 2.5
0.1 0.2 0.3 0.4 0.5 0.6 0.7 0.8 0.9 1 MC = 7 % & RT = 1373 K
Figure 8: Molar % of CO2 vsER Figure 9: Molar % of CH4 vsER
0 10 20 30 40 50 60 70 80 90
0.1 0.2 0.3 0.4 0.5 0.6 0.7 0.8 0.9 1 MC = 7 % & RT = 1373 K
0 2 4 6 8 10 12 14 16 18
0.1 0.2 0.3 0.4 0.5 0.6 0.7 0.8 0.9 1 MC = 12.5 % & RT = 1123 K
Figure 10: Molar % of N2 + H2O
vsER
a) Effect of ER on Hydrogen and CO
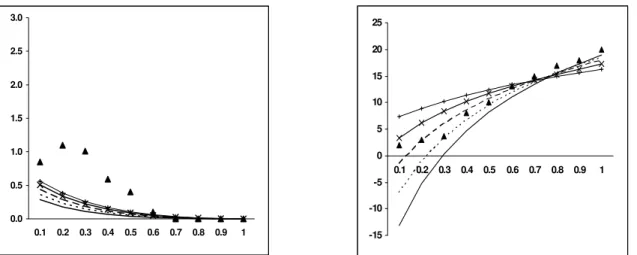
The yield of hydrogen from the model is observed to follow a decreasing trend with increasing ER. A similar trend is reported by other researchers like Turn et al. (1998).The trend is quite misleading at first sight. It is a common reality that as the ER increases, the temperature of the any oxidation reaction is bound to increase. This trend is applicable only to allothermal systems, where the temperature of the gasifier is controlled externally (McKendry, 2002). In equilibrium modeling, it is assumed that temperature is maintained constant even at different ERs. However for autothermal systems, the increase in ER would have two paradoxical phases, one following the other in a sequential manner. When the ER is increased from low values, the temperature of the system increases, resulting in a marked increase in generation of both gas and its H2 concentration _ phase 1. However
beyond a governing limit, the oxidation reaction predominates due to availability of excess oxygen and the yield of H2 drops for conversion of H2 to
H2O _
phase 2. The typical ER reported by Lv et al. (2004) is 0.19 to 0.23 for phase 1 and 0.23 to 0.27 for phase 2. The gasifier adopted for experimenting gasification of CNSC is autothermal. Hence, the bed reaction temperatures varied with different ERs. The model predicts unreasonably high H2 at lower ERs.
Ruggiero and Manfrida (1999) described the irrelevance of equilibrium models, which assume perfect gas behavior for very low ERs as these models cannot describe pyrolysis processes due to the presence of liquid hydrocarbons as pyrolysis products. Desrosiers (1981) predicted thermodynamic ER for gasification of dry wood as 0.28. Considering the range of H2 yield, as predicted by the model with
experimental values in the ER range of 0.25 to 0.35, the model values compare quite reasonable with the experimented values. At an ER of 1, the H2 is null,
indicating the complete combustion and conversion of all H2 to water vapor. The prevailing conditions
and criteria quoted for H2 are equally applicable for
CO, albeit at a different magnitude.
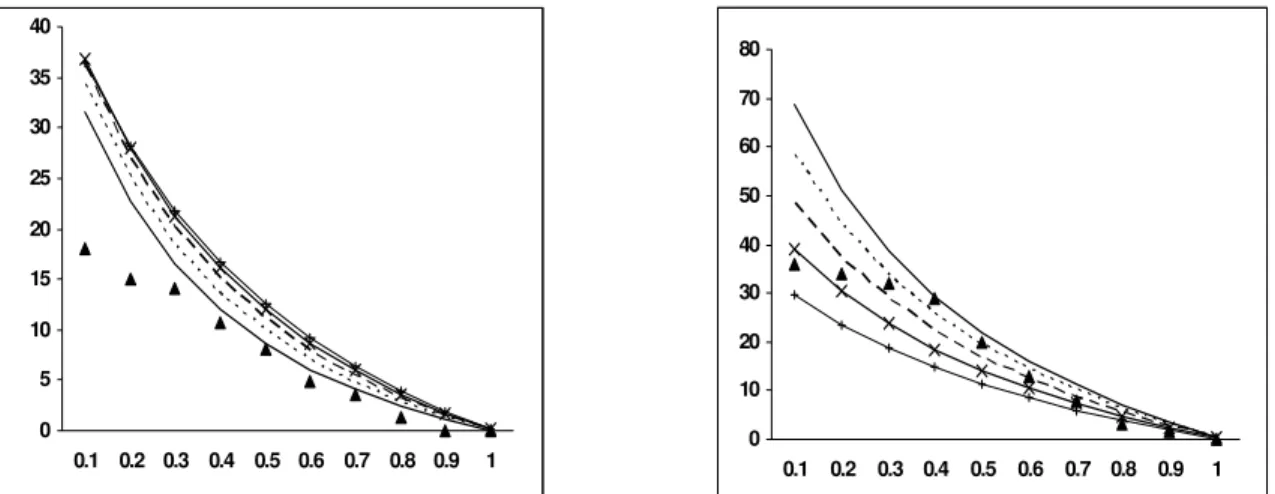
b) Effect of ER on CO2 and CH4
The molar percentage of CO2 is observed to
increase with an increase in ER, similar to the trend established by Altafini et al. (2003). In reality, the trend of CO2 could be correlated with the trend
opposite to that for CO. A decrease in concentration of CO2 indicates better gasification efficiency
(Zainal et al. 2002). The modeled results for charred CNS indicated negative values of CO2 at
lower ERs, which is quite unrealistic. Ruggiero and Manfrida’s (1999) statement could be applied to this condition also. However, after a critical analysis of the modeling, it was decided to check the trend of CO2 for other established fuels, for
which modeling results had already been reported. Accordingly, the devised model was applied to casuarina wood (CH1.44 O0.65), whose proximate and
ultimate analyses are listed in Tables 6 and 7. The trend of CO2 for casuarina wood is observed to be
increasing and positive for all ERs (Fig. 11). Other constituents of the global reaction [Eq.1] remain the same, the C/H and C/O ratios of charred CNS are observed to be 2.18 and 2.08 times greater than the C/H and C/O ratios of casuarina. Hence it was inferred that the C/H ratio to some extent affects the model output at lower ERs. This was confirmed by increasing the H/C ratio on the reactant side in the global reaction [Eq.1] by increasing the fuel moisture content and analyzing the molar percentage of CO2 at different ERs. At a moisture
level of 40 %, the CO2 yields are all observed to be
positive (Fig. 20), indicating the effect of C/H ratio on modeling at lower ERs. Though the values depicted by the model at lower ERs per se would not be relevant to gasification, the cause for it had been reported. It was found that the model predicts well the CO2 concentration at higher ERs and that
pertaining to gasification.
Table 6: Proximate analysis of casuarina wood
(wt% on an as-received basis)
Moisture 12.5
Volatile Matter 67.5
Fixed Carbon 18
Ash 2
Table 7: Ultimate analysis of casuarina wood
(wt% on an as-received basis)
Mansaray et al. (1999) inferred that increasing the ER results in a decrease in concentrations of methane and other light hydrocarbons, which have relatively high heating values. The model results validate the claim that CH4 concentration decreases with
increasing ER. Conversely, the prediction on CH4
made by the model is lower than the actual ones by a large margin. Pellegrini and Oliveira Jr. (2007) experienced similar differences in CH4 predicted by
the model and experiment and referred to the cause as a result of the sudden cessation of gasification reactions at the bottom of the reactor. This cessation is a consequence of the temperatures at the bottom, which are too low to start up the reactions. In an equilibrium model, it is assumed that all reactions achieve a steady-state condition; thus no kinetic effects (such as sudden cessation) are considered. To overcome the differences in mole fractions, a fixed CH4 molar correction needs to be adopted, as
reported by Fock and Thomsen (2000).
c) Effect of ER on N2 and H20
Gas analysis was not carried out on a dry basis for want of facilities. Hence the remainder of the measured components, viz., CO, CO2, H2, O2 and
CH4 is assumed to be mix of N2 and H2O. The
devised model predicted the yield of N2 and H2O
individually and the molar concentrations of these constituents were combined as a mix to compare with the experimental values. Generally nitrogen formation could be attributed to the N2 from fuel and
N2 from air. With the nitrogen in fuel remaining
constant, the increase in ER increases the N2
supplied to the system, and hence the higher yield of N2 at higher ERs. While the majority of researchers
had observed a similar pattern, Zainal et al. (2002) reported a decreasing trend of N2 with an increase in
ER, which is not quite possible. Water in the product gas also increases with an increase in ER for the ascendancy of the oxidation reaction of H2 at higher
ERs. The H2O and N2 mix predicted by the model
correlates well with the experimental values.
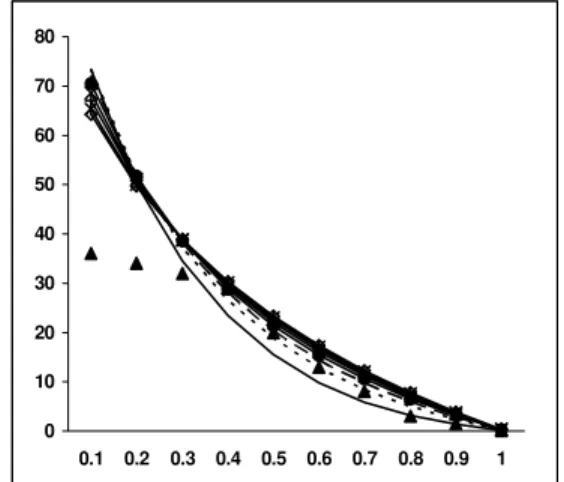
Effect of Temperature on Molar Concentration
Jayah et al. (2003) observed that a lower temperature reduces the reaction rate and thereby the conversion efficiency. Altafini et al. (2003) stated that equilibrium models are especially good at high temperatures where the reaction temperatures are above 1500 K. The temperatures generally assumed for equilibrium modeling by different researchers were not coherent and were predominantly modeled between 800 – 1000 K. Moreover the zone of the
gasifier having this temperature was also not reported. Prins et al. (2006) remarked that for fluidized bed gasifiers, the average bed temperature can be used as the process temperature, whereas for downdraft gasifiers, the outlet temperature at the throat exit should be used. The temperature measured in the throat zone [T4] of the gasifier, using charred CNS, was about 1100oC. Dogru et al. (2002) reported a throat temperature of 1015oC using hazelnut shells.
However keeping in mind the veracity of other work in the literature, the model was framed for a wide range of temperatures from 800 K to 1500 K and compared with the experimental results obtained at 1373K (Figs 12 to 16). It should be noted that the deviation in gas composition within the temperature range selected was not very significant. Both exothermic and endothermic reactions occurred in the gasification system. Based on Le Chatelier’s principle, it is understood that higher reaction temperatures favor the reactants in exothermic reactions while they favor the products in endothermic reactions. Methane formed in the gasifier at high temperatures underwent endothermic reactions with the already formed water vapor and was converted into CO, CO2 and H2. Hence the yield
of CH4 decreased at higher temperatures.
CH4 + H20 = CO + 3H2
CH4 + 2 H2O = CO2 + 4 H2
The yield of H2 in the above reactions is three to
four times that of formation of CO or CO2. Hence the
increase in molar concentration of H2 is significantly
higher than the increase observed in CO or CO2.
Hence for gasification systems aimed towards generation of H2, maintaining of higher reaction
temperature would be a remarkable advantage.
The endothermic reactions used the water vapor generated in the preliminary gasification process, as a result of which the yield of the N2 + H2O mix was
lower at higher temperatures. Since N2 forms the
majority of the mix, the dip caused by reduction in moisture was almost insignificant. Precisely, it could be inferred that the cause for the drop in methane at higher temperatures and the increase in CO and H2
0 5 10 15 20 25 30 35 40
0.1 0.2 0.3 0.4 0.5 0.6 0.7 0.8 0.9 1
0 10 20 30 40 50 60 70 80
0.1 0.2 0.3 0.4 0.5 0.6 0.7 0.8 0.9 1
Figure 12: Yield of H2 at different bed T vs ER Figure 13: Yield of COat different bed T vs ER
-15 -10 -5 0 5 10 15 20 25
0.1 0.2 0.3 0.4 0.5 0.6 0.7 0.8 0.9 1
0 1 2 3 4 5 6
0.1 0.2 0.3 0.4 0.5 0.6 0.7 0.8 0.9 1
Figure 14: Yield of CO2 at different bed T vs ER Figure 15: Yield of CH4 at different bed T vs ER
0 10 20 30 40 50 60 70 80 90
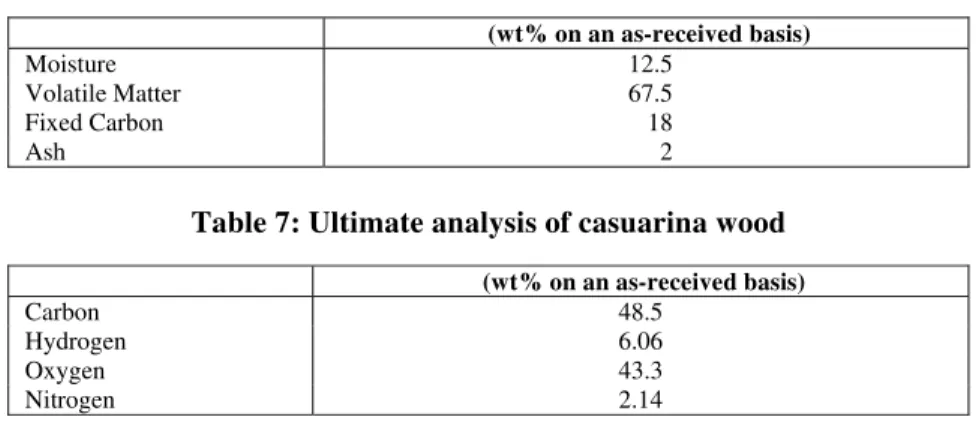
0.1 0.2 0.3 0.4 0.5 0.6 0.7 0.8 0.9 1
Legends indicating temperatures
Effect of Moisture on Molar Concentration
Moisture content is one of the most significant properties of any biomass that are known to affect the gasification process. Hos and Groeneveld (1987) detailed the effect of moisture content of the feed material on the composition of the product gas. Bridgewater et al. (1986) cited that moisture constraints for any gasifier fuel are dependent on type of gasifier used. Higher values are possible in updraft systems, but the upper limit acceptable for a downdraft reactor is generally considered to be around 40% on a dry basis. Reed and Das (1988) specified that moisture content of feedstock should be below 33% (d.b.) for generating a burnable, good quality gas, while moisture contents higher than 67% (d.b.) make the product gas too lean for ignition. McKendry (2002) inferred that moisture content above about 30% makes ignition difficult and reduces the CV of the product gas due to the need to evaporate the additional moisture before combustion/gasification can occur. With this background, the present model was analyzed for the impact of moisture content on gas composition and the results were compared with the experimental values. Moisture content in a biomass could be either intrinsic (inherent) or extrinsic (influenced by weather/handling). The moisture in the producer gas is an amalgamation of the moisture sourced from substoichiometric air (relative humidity), water vapor formed due to oxidation of hydrogen in fuel and the intrinsic and extrinsic moisture associated with fuel. Among these contributing factors, the first two absorb only the sensible form of heat for superheating the moisture, while the last component absorbs sensible, latent and superheat for converting the moisture into a
superheated vapor form. The higher the fuel moisture content, the higher is the heat absorbed by the moisture, paving the way for a reduced reaction temperature and associated incomplete cracking of the hydrocarbons released from the pyrolysis zone.
Increased levels of moisture and the presence of CO at lower ERs produce more H2 and CO2 by the
water gas shift reaction [Eq. 6]. The increased H2
content of the gas produces more CH4 by direct
hydrogenation. Pellegrini and Oliveira Jr. (2007) inferred that though more H2 is formed with
increased moisture, in order to maintain the process, more energy must be supplied, so exothermic reactions are favored, which promotes CO2
formation. The gain in H2 and CH4 of the product gas
does not however compensate for the loss of energy due to the reduced CO content of the gas and therefore gives a product gas with a lower CV (McKendry, 2002). Similar results on the effect of moisture content have also been reported for conventional gasifiers (Bhattacharya et al., 1999; Parikh, 1985; Walawender et al., 1987). The model revealed similar trends for CNSC and the experimental values were observed to follow suit predicted by the model (Figs 17-21).
Consolidation
A comparison of the equilibrium modeling results vs the experimental values obtained upon gasification of CNSC is presented in Fig 22. The deviation observed is very minimal on the ER applicable to gasification, i.e., 0.15 to 0.4 for all constituents except CO2. However the experimental
values of CO2 can be observed to match the modeled
outputs well at ER > 0.3.
0 5 10 15 20 25 30 35 40
0.1 0.2 0.3 0.4 0.5 0.6 0.7 0.8 0.9 1
0 10 20 30 40 50 60 70 80
0.1 0.2 0.3 0.4 0.5 0.6 0.7 0.8 0.9 1
0.0 0.5 1.0 1.5 2.0 2.5 3.0
0.1 0.2 0.3 0.4 0.5 0.6 0.7 0.8 0.9 1 -15 -10 -5 0 5 10 15 20 25
0.1 0.2 0.3 0.4 0.5 0.6 0.7 0.8 0.9 1
Figure 19: Molar % of CH4 with varied moisture vs ER Figure 20: Molar % of CO2 with varied moisture vs ER
0 10 20 30 40 50 60 70 80 90
0.1 0.2 0.3 0.4 0.5 0.6 0.7 0.8 0.9 1
Effect of moisture on gas composition Legends indicate % Moisture Content
Figure 21: Molar % of N2 + H2O
with varied moisture vs ER
CONCLUSIONS
The concept of equilibrium modeling applies well for prediction of the effect of ER, MC and RT in gasification of CNSC.
ER is observed to have a large impact on the composition of the producer gas. The model predicts well the trend for H2, CO, N2 and H20. For CO2, the
model depicts negative values, possibly, owing to the effect of the carbon-hydrogen ratio, which had been proven by application of the same model for gasification of casuarina wood.
The contribution of reaction temperature is significant for hydrogen yield. The composition of H2 at an ER of 0.3 maintained at a RT of 800 K is
10.5 %, while at 900 K it is 14 %, an increase of 33 %. However at the same ER, the yield is not so pronounced between 1100 and 1500 K. Higher temperatures favor the formation of CO and minimize the yield of CH4. For temperatures higher
than 1200 K, CH4 generation is practically nil. The model does predict the effect of MC in a relevant manner. The CH4 content increases with
moisture content. At an ER of 0.3 and with a fixed RT of 1373 K, the yield of CH4 is 0.14 % at 10 %
moisture, while it is 0.25 % at 50 % moisture, an 80 % increase.
The model predicts an unrealistic gas composition at ERs less than 0.15, due to pyrolysis, for all constituents of producer gas. For ER pertaining to gasification and beyond that, the model’s prediction is coherent with experimental values.
ACKNOWLEDGEMENTS
The financial support provided by the Ministry of New & Renewable Energy, Government of India, New Delhi is thankfully acknowledged. The support rendered by Mr. M. Sundaresan, Fitchner Consulting Engineers, Chennai; Mr. S. Kasiraman, GE-Bangalore; Mr. G. Vidyasagar and Mr. G. Muthukumar are appreciated.
NOMENCLATURE
°
∆G Standard Gibbs function of formation
(-)
∆A, ∆B, ∆C and ∆D
Coefficients for determining specific heat
(-)
∆H° Heat of formation (-)
A, B, C and D
Constants for the properties of the gases
(-)
CNS Cashew nut shell (-)
CNSC Cashew nut shell char (-)
CNSL Cashew nut shell liquid (-)
Cp Specific heat (-)
Cp(am) Specific heat at arithmetic
mean temperature
(-)
ER Equivalence ratio (-)
HHV Higher heating value kJ/kg
I Constant of integration (-)
J Constant (-)
K1 & K2 Equilibrium constants (-)
m Amount of oxygen per kmol of wood
(-)
MC Moisture content per mol of wood
(-)
MC Moisture content (-)
R Universal gas constant (J /mol k)
(-)
RT Reaction temperature (-)
T1 Reference temperature (-)
T2 Reaction temperature (-)
Tam Arithmetic mean
temperature
(-)
w Amount of water per kmol of wood
(-)
x1, x2, x3, x4
and x5
Coefficients of constituents of the producer gas
(-)
REFERENCES
Agricultural statistics at a glance – India, Agricultural Statistics Division, Ministry of Agriculture, Government of India p. 100 (2003). Bhattacharya, S. C., Md. Mizanur Rahman Siddique
A. H., Hoang-Luong Pham, A study on wood gasification for low-tar gas production, Energy 24, p. 285-296 (1999).
Bridgewater, A. V., Double, J. M. and Earp, D. M., Technical and market assessment of biomass gasification in the United Kingdom, ETSU Report, UKAEA, Harwell, UK (1986).
Carlos R. Altafini, Paulo R. Wander and Ronaldo M. Barreto, Prediction of the working parameters of a wood waste gasifier through an equilibrium model, J. Energy Conversion and Management, 44, p. 2763 - 2777 (2003).
Dogru M., Howarth, C. R., Akay G., Keskinler B. and Malik, A. A., Gasification of hazelnut shells in a downdraft Gasifier, Energy, 27, p. 415-427 (2002)
Fock, F. and Thomsen, K. P. B, Modelling a biomass gasification system by means of EES, The Scandinavian Simulation Society, Technical University of Denmark (2000).
Hos, J. J and Groeneveld, M. J., Biomass Gasification. In: Hall DO, Overend RP, editors. Biomass regenerable energy.chichester: Wiley (1987).
http://dacnet.nic.in/cashewcocoa/cashew.htm. http://en.wikipedia.org/wiki/Cashew.
http://www.cashewindia.org.
Jigisha Parikh, Channiwala, S. A. and Ghosal, G. K., A correlation for calculating HHV from proximate analysis of solid fuels, Fuel, 84, p. 487-494 (2005).
Luiz Felipe Pellegrini, Silvio de Oliveira Jr., Exergy analysis of sugarcane bagasse gasification, J. Energy, 32, p. 314-327 (2007).
Lv, P. M., Xiong, Z. H., Chang J., Wu, C. Z., Chen Y. and Zhu J. X., An experimental study on biomass air-steam gasification in a fluidized bed, Bioresource Technology, 95, p. 95-101(2004). Mansaray, K. G., Ghaly, A. E., Al-taweel, A. M.,
Hamdullahpur F. and Ugursal, V.I., Air gasification of rice husk in a dual distributor type fluidized bed gasifier, Biomass and Bioenergy, 17, p. 315-332 (1999).
Mark J. Prins, Krzysztof J. Ptasinski and Frans J. J. G. Janssen., From coal to biomass gasification: Comparison of thermodynamic efficiency, Energy doi: 10.1016/ j.energy.2006.07.017 (2006).
Natarajan E., Nordin A. and Rao, A. N., Overview of Combustion and Gasification of Rice Husk in Fluidized Bed Reactors, Biomass and Bioenergy, Vol. 14, Nos. 5/6, p. 533–546, (1988).
Parikh P. P, State of art report on gasification of biomass, Report of DNES project, IIT – Bombay (1985).
Peter McKendry, Energy production from biomass, part 3: Gasification Technologies, Bioresource Technology, 83, p. 55-63 (2002).
Philippe Mathieu, Raphael Dubuisson, Performance analysis of a biomass gasifier, Energy Conversion and Management, 43, p. 1291-1299 (2002). Piyali Das, Anuradda Ganesh, Bio-oil from pyrolysis
of cashew nut shell _ a near fuel, Biomass and Bioenergy, 25, p. 113 - 117 (2003).
R & D report, Decentralized power generation through carbonization & gasification of cashew shells, IES, Anna University, May 2006.
Reed, T. B. and Das A., Handbook of biomass downdraft gasifier engine system. Golden, CO: SERI (1988).
Robert, H. P. and Don, W. G., Perry’s chemical engineer’s handbook, Sixth edition, New York: McGraw Hill (1984).
Ruggiero M. and Manfrida G., An equilibrium model for biomass gasification processes. Renewable Energy, 16, p. 1106-1109 (1999).
Schuster G., Loffler G., Weigl K. and Hofbauer H., Biomass steam gasification - An extensive parametric modeling study, Bioresource Technology, 77 (2001).
Sergrapagna and Ajmal Latif, Steam Gasification of Almond Shells in a Fluidized Bed Reactor: The influence of Temperature and Particle size on Product Yield and Distribution, Biomass and Bioenergy,Vol. 12, No. 4, p. 281-288 (1997). Stull D. R. and Prophet H., JANAF Thermochemical
Tables, NSRDA - NBS 37 (1971).
T. H. Jayah, Lu Aye, R. J. Fuller and D. F. Stewart, Computer simulation of a downdraft wood gasifier for tea drying, Biomass and Bioenergy, 25, p. 459 – 469 (2003).
Turn S., Kinoshita C., Zhang Z., Ishimura D. and Zhou J., An Experimental Investigation of Hydrogen Production from Biomass Gasification, Int. J. Hydrogen Energy, Vol. 23, No. 8, p. 641-648 (1998).
Von Fredersdorff, C. G., Elliot, M. A., Chemistry of Coal Utilization, 3, H.H. Lowry, Ed., Wiley Publisher, New York (1963).
Walawender, W.P., Chern S.M., Fan LT. In: Klass DL, editor, Energy from biomass and wastes XI, Chicago: Institute of Gas Technology (1987). Yang, Y. B., Effect of fuel properties on biomass
combustion. Part II. Modelling Approach - Identification of the controlling factors, Fuel, 84, p. 2116-2130 (2005).
Zainal, Z. A., Ali Rifau, Quadir, G. A. and Seetharamu, K. N., Experimental investigation of a downdraft biomass gasifier, Biomass and Bioenergy, 23, p. 283 - 289 (2002).