ISSN 1517-7076 artigo e-11979, 2018
Correspondent author: Alexandre de MacêdoWahrhaftig Received: 23/02/2017 Accepted: 16/10/2017
10.1590/S1517-707620170001.0315
Experimental exploratory study of failure
modes in models of wooden rectangular
beams of
Hymenae spp
Alexandre de Macêdo Wahrhaftig1
1 Universidade Federal da Bahia (UFBA), Departamento de Construção e Estruturas (DCE), Escola Politécnica, Salvador, BA.
e-mail: [email protected]
ABSTRACT
According to the study of mechanical properties, wood is an elastic or elastoplastic material that presents different structural behaviour when tensioned or compressed. From the viewpoint of elasticity, wood is con-sidered anisotropic, or rather it is a material with elastic properties that vary with the direction concon-sidered. During tree growth, the internal structure of the solid material consisting of the wood becomes highly orient-ed and therefore anisotropic. To study the failure modes of wooden parts and to observe their anisotropy in this process, we performed a series of exploratory tests on models of beams, taking into account the different positions of fibers and growth rings and the different relationships between height and length for a specific specie of wood, in other words, a test with tangent, radial and inclined load applied to the fibers. The pieces were made of dicotyledonous wood that was first category and free of defects, making a total of nine samples in three groups. Failure by shearing and normal stresses was observed and was well characterized in terms of records left in the samples. In addition, when describing the failure modes, the results are discussed with the presentation of images and graphics for each case.
Keywords: Anisotropy, Failure modes, Beams, Wood, Experimental exploration.
1. INTRODUCTION
According to the study of mechanical properties, wood is an elastic or elastoplastic material that presents different structural behaviours when tensioned or compressed. From the viewpoint of elasticity, wood is con-sidered anisotropic, or rather it is a material with elastic properties that vary with the direction concon-sidered, unlike an isotropic material, in which they remain constant. According to KONOPKA et al. 0, wood is an inhomogeneous, anisotropic, and porous material with moisture-, temperature-, and time-dependent behav-iour. In function of the anisotropic and viscoelastic behaviour of wood, combined with its orthotropic charac-ter, the study of wood remains difficult for the research and engineering communities. Due to complex load-ing modes, this difficulty is increased greatly by the action of small cracks, leadload-ing to the crack-growth pro-cess and finally the collapse of the structure, according to PITTI et al. 0
.
During tree growth, the internal structure of the solid material consisting of the wood becomes highly oriented and thus anisotropic. On a macroscopic level, the arrangement of the timber structure results in length and diametric growth processes. The anisotropy of the wood also stems from its cell structure, which is composed mainly of fibrous material and will have an impact on its apparent mechanical properties. The structure of the timber is therefore usually referred to two privileged axes related to these directions: the lon-gitudinal direction (L) along the fiber and the radial direction (R) relative to the annual growth rings. A third direction (T) is tangential to the annual growth rings. The three orthogonal planes RT, RL, and LT formed by these directions are then three planes of symmetry of the internal structure of the wood, as represented in Figure 1(a) and (b). Depending on the relative position in which the pieces of wood are extracted from the trunk of the tree, several relationships between the growth rings and the fibers can be formed (Figure 1(c)).
(a) Interior structure (b) Preferential directions
(c) Extraction of pieces
Figure 1: Representation of wood anisotropy (ALMEIDA 0).
The knowledge of the rupture modes in bent parts can help in the understanding and identification of the mechanisms of collapse of real structures, assisting in analyses such as those in the area of the forensic investigations, according to YATES and LOCKLEY 0. A study on causes of ruin in wooden structures was developed by HANSSON 0, who investigated over 127 cases of failure of timber structures and their modes of collapse and found that the most common cause of failure is related to weaknesses or lack of design strength (41.5%). Considering the kinds of structural elements, HANSSON 0 states that beams are still the structural elements most frequently used in roof structures and are the elements that fail most frequently in the cases studied.
Equations derived from purely elastic behaviour of the material were used to calculate the stresses and modulus of elasticity of the material. It is important to mention that these typical equations of solid mechan-ics serve as a comparative parameter between the different modes of rupture, in the scope of the research, in the sense of assisting the practice of design and structural analysis in wooden structures, even though there is no theory for that situation. According to JORISSEN and FRAGIACOMO 0, timber elements are usually designed using linear elastic analysis for the calculation of both the effects of loads on the structural members (strength demand) and the strength of members at cross-sections (strength capacity), which is the only design method currently recommended in the Eurocode. KIM and HARRIES 0 predicted the behaviour of timber structures by using models ranging from simple analytical ones based on linear elastic theory to three-dimensional finite element analysis models, even though wood is an anisotropic material. According to KONOPKA et al. 0, orthotropic elasticity is a commonly used material model for the description of the ap-proximately linear (in the range of small strains) and cylindrical anisotropic behaviour. Therefore, Hooke’s law gives the linear relation between elastic strain and stress.
In this direction, the study performed by SERRANO and GUSTAFSSON 0 show that it is possible to approximate to the linear elastic analysis more complex behaviour which are typical of the non-linear analy-sis of the crack mechanics, taking into account the deformation, strength, and fracture energy of the material in the region of the fracture process. They concluded that in some cases the calculations can be carried out analytically by use of the theory of beams. Another study that can be mentioned in the sense of understanding the mechanisms of rupture of wood was performed by NAKAMURA et al. 0, who conducted a series of physical tests and analysed the results using images. The tests performed were bending tests on normal cli-mate specimens, bending tests on specimens stored in water, tensile tests, impact-bending tests, computed tomography tests, and scanning tests. A proposal to understand the rupture mechanism was made by JEN-SEN and GUSTAFSSON 0, who studied the shearing-resistance of joints with glued sticks. Other studies on shear stresses in transversely loaded beams were performed by VAN DER PUT and LEIJTEN 0 and by JENSEN 0. BUCHELT and WAGENFUHR 0 performed mechanical tests of bending and tension in order to evaluate the proprieties of veneer with the load being applied parallel and transversely to the fibers.
2. MATERIALS AND METHODS
analysis of a preliminary investigation, which aimed to verify the influence of the wood anisotropy in modes of rupture of bending parts, there is no specific normalization for this kind of work. However, the scientific methodology was carefully observed in the steps adopted in the experimentation.
The pieces tested were made of dicotyledonous wood usually of first category, free of defects, with a moisture standard admitted of about 12%, making a total of nine samples in three groups. It is registered that moisture was not a parameter of control related to the investigation. Failure by shearing and normal stresses was observed and was well characterized in terms of records left in the samples. In addition, when describing the failure modes, the results are discussed with the presentation of images and graphics for each case.
In order to experimentally investigate the rupture modes in bent wood parts of rectangular section, prospective three-point bending tests were carried out on wood specimens. Specifically, the study aimed to evaluate the structural behaviour of wood beams using models with different h/L ratios, with h being the height and L the beam span. The specimens used in the tests were measured with callipers in order to verify the dimensions of interest and were made of wood considered of first category, forming a set of nine samples divided into three groups. The directions of the fibers and the growth rings were obtained by visual inspec-tion of the surface and texture of each sample. The visual sense of these parameters can be appreciated in the work of NAKAMURA et al. 0, as mentioned.
In the experiment, a computer-controlled servosystem (Figure 2) was used to apply the force and metal components to simulate the boundary conditions of pinned and roller supports, according to the struc-tural arrangement adopted in the test: hyperstatic and hypostatic beams, as indicated. The force was applied in the middle of the span.
2.1 Materials and equipment
The test specimens were made of wood of the species known by the common name of jatobá, scientific name Hymenaespp, having as main characteristics: apparent density of 1074 kg/m3, compressive stress resistance parallel to fiber of 93.3 MPa, tension resistance parallel to fiber of 157.5 MPa, shearing resistance of 15.7 MPa, and longitudinal modulus of elasticity of 23607 MPa, with these characteristics summarized in Table 1 and Table 2, according NBR 7190/1997 from Brazilian Association for Standardization (ABNT) 0.
Table 1: Material characteristics
COMMON NAME
SCIENTIFIC NAME
ap(12%)
(kg/m3
)
fc0
(MPa)
ft0
(MPa) ft90
(MPa) fv
(MPa) Ec0
(MPa)
Jatobá Hymenaespp. 1074 93.3 157.5 3.2 15.7 23607
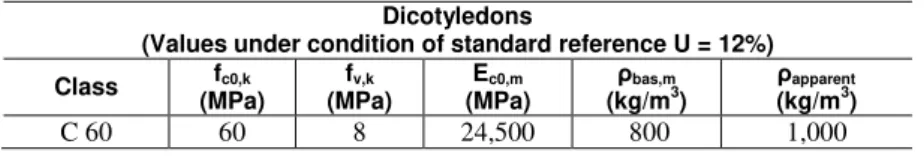
Table 2: Reference values of characteristic resistance
Dicotyledons
(Values under condition of standard reference U = 12%)
Class fc0,k
(MPa)
fv,k
(MPa)
Ec0,m
(MPa) ρ
bas,m
(kg/m3) ρ
apparent
(kg/m3)
C 60 60 8 24,500 800 1,000
In Table 1 the symbology means: ap(12%) – density under 12% humidity; ρbas,m– basic density; fc0 –
compressive stress resistance parallel to fiber, because of the orientation of the wood is parallel to gain; ft0–
tension resistance parallel to fiber, because of the orientation of the wood is parallel to gain; fv– shearing
resistance, because of the orientation of the wood is parallel to gain; ft90– tension resistance normal to fiber,
because of the orientation of the wood is normal to gain; Ec0– longitudinal modulus of elasticity found from
compression test. It is important to have in mind that the values of resistance of wood depend on the orienta-tion of force in relaorienta-tion to the fibers in standard test of characterizaorienta-tion, as menorienta-tioned. The class of resistance (C 60) was defined according NBR 7190/1997 from Brazilian Association for Standardization) (ABNT) 0.
associated with the paratracheal vasicentric or aliform; Rays: visible to the naked eye at the top and visible under a lens on the tangential face, few; Vases: visible to the naked eye, medium; very few; Diffuse porosity; Solitary and multiple; Clogged by oil-resin; Growth layers: distinct, individualized by marginal parenchyma.
The samples were divided into three groups according to their h/L ratios, as follows: Group 1: h/L ra-tio = 0.04, three samples, 20 × 20 × 500 mm; Group 2: h/L ratio = 0.10, three samples, 20 × 50 × 500 mm; Group 3: h/L ratio = 0.16, three samples, 20 × 80 × 500 mm. A pachymeter was used for measuring the di-mensions of the specimens, a mechanical servosystem testing machine (Figure 2) was used for the applica-tion of force, with a speed descripted follow, and a pinned and roller metallic supports were used in order to simulate the boundary conditions.
2.2 Assumptions and hypotheses
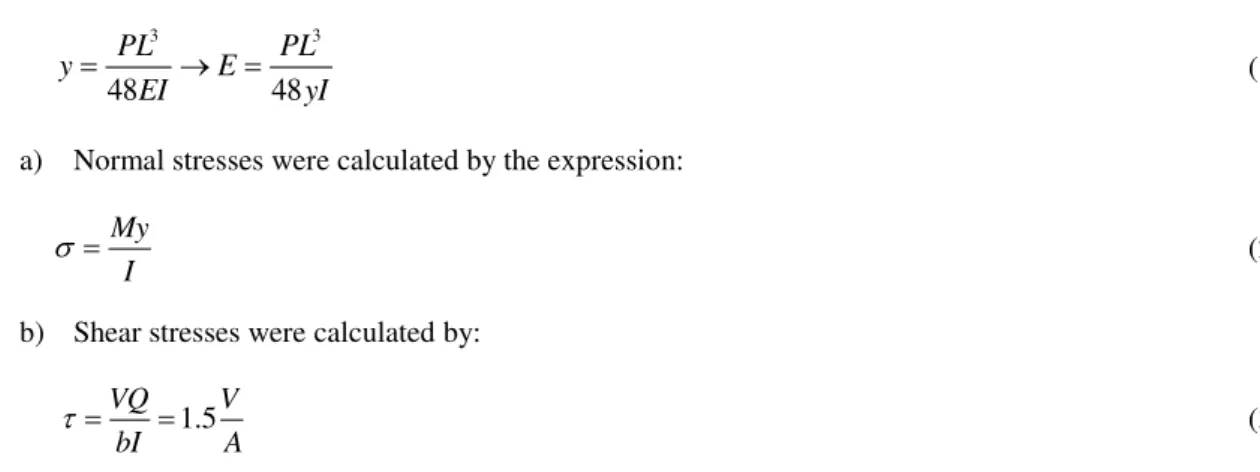
A first-category wood and defect-free test pieces, with a dry wood with 12% moisture content was consid-ered as base condition. A Bernoulli-Euler beam theory, which considers that the cross-section is originally a plane remains as a plane and orthogonal to the axis after deformation was adopted for obtaining of induced stresses by the vertical effort. The apparent modulus of elasticity was obtained by maximum displacement of the elastic line, given by:
3 3
48 48
PL PL
y E
EI yI
(1)
a) Normal stresses were calculated by the expression:
My I
(2)b) Shear stresses were calculated by:
1.5
VQ V
bI A
(3)In the above expressions, P is the concentrated vertical force applied in the middle of the span, L is the distance between supports, EI is the bending stiffness, M is the bending moment, y is the height in the cross-section with respect to the neutral line, V is the shearing effort, Q is the static moment of the sector above the centroid in the cross-section, b is the shearing base, I is the moment of inertia of the cross-section with re-spect to its centroid, and E is the apparent modulus of elasticity.
Figure 2: Computer controlled servosystem.
2.3 Procedures performed
DARTEC
Sample position
Actuator Reaction bar
A quasi-static controlled deformation test was performed at 0.05 mm/min. A quasi-static test is a process that happens slowly enough for the system to remain in internal equilibrium. In this case, no dynamic or impact effect is considered, consisting of statically acting force at each test moment. The samples were identified and numbered according their dimensions, with a code that specifies the group of each sample; for example, AM-21 refers to the first element of a Group 2 sample. It is important to remember that the samples were manufactured with different directions in relation to the fiber orientation, in other words, a test with tangent, radial and inclined load applied to the fibers. Fiber orientation was verified based on visual observation of each sample.
The adopted distance between supports was 460 mm, which corresponds to a model thickness of 20 mm in relation to the extremity. That is a freely chosen measure that has been defined based on the plat-form available on the test machine. They are, therefore, physical models for the understanding of structural behaviours. The loading sequence was as follows: initial loading up to 20% of the estimated rupture load, total unloading, and finally reloading up to sample rupture. The relation force and displacement over time were recorded in a digital archive.
3. RESULTS AND DISCUSSION
The results and discussion of the modes of rupture are presented below in the order in which the tests were performed. It should be noted that the test with the hyperstatic beam contour conditions was used in order to detect a possible membrane effect arising due to the horizontal impossibility of displacement of the supports. On the other hand, for the test condition with two rolled supports, the friction between actuator and the beam establishes the equilibrium in horizontal direction. That last boundary condition is the most commonly used in experimental investigations of wood.
3.1 h/L ratio = 0.10; sample dimensions = 20 mm × 50 mm × 500 mm.
3.1.1 First sample: AM-21
Structural system
A structural system characterized by a Hyperstatic beam (Figure 3) was used.
Procedure
Procedure performed followed the sequence: The first loading phase with force up to 2 kN; elastic behaviour verification; complete unloading; and reloading until rupture.
Figure 3: Test arrangement with pinned supports.
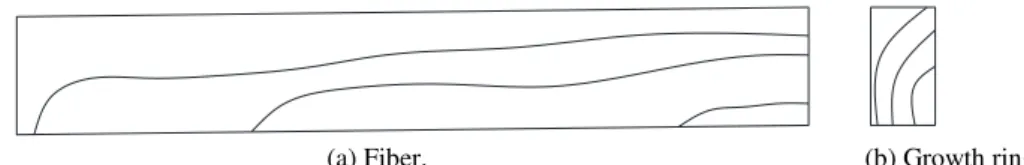
Positions of fibers and growth rings
The positions of fibers and growth rings can be seen in Figure 4.
(a) Fiber. (b) Growth rings.
Figure 4: Positions of fibers (a) and growth rings (b) for AM-21.
20 mm 460 mm
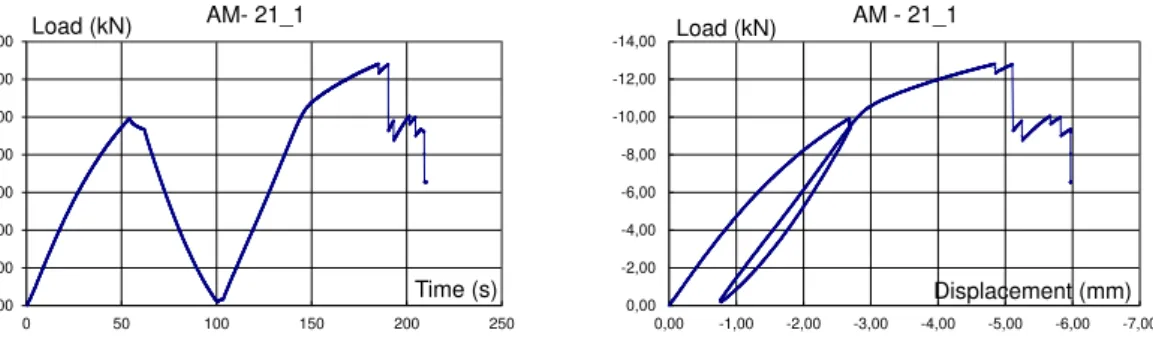
Obtained results
The load–time relation (graph AM-21_1) and load–displacement (graph AM-21_2) were obtained.
It was possible to see that the unloading in the first phase of the test followed a different curve to the loading, indicating possible entry into the plastic deformation region. It was also possible to note the occur-rence of plastification of the fibers in the compressed flange in the central region of the beam and in the posi-tions on the supports. The load of the first rupture was 12.81 kN. After this force the piece returns to recover its resistance capacity and the load rises slightly, with breaking reoccurring at 12.78 kN. The apparent modu-lus of elasticity according to Eq. (1) is E = 45.50 GPa; the normal stress on rupture according to Eq. (2) is = 81.34 kN/mm2; and the shearing stress on rupture according to Eq. (3) is = 0.02 kN/mm2.
Discussion of rupture mode
The first rupture of the compressed flange occurred in the central part of the sample and then the tension stress at the most distal edge was reached according to the preferred direction of cleavage. Cleavage is a property of certain materials whereby they divide more easily along certain planes than in other directions; then tension cracking of the part occurred.
3.1.2 Second sample: AM-22
Structural system
The Structural system used was as Hypostatic beam (Figure 5):
Figure 5: Test arrangement with roller supports.
Procedure
Procedure performed were: first loading up to 10 kN; elastic behaviour verification; complete unloading; reloading up to rupture.
Positions of fibers and growth rings
Positions of fibers and growth rings: according to Figure 6:
(a) Fibers (b) Growth rings
Figure 6: Position of fibers (a) and growth rings (b) for AM-22. -14,00
-12,00
-10,00
-8,00
-6,00
-4,00
-2,00
0,00
0 50 100 150 200 250
Load (kN)
Time (s) AM- 21_1
-14,00
-12,00
-10,00
-8,00
-6,00
-4,00
-2,00
0,00
-7,00 -6,00 -5,00 -4,00 -3,00 -2,00 -1,00 0,00
Load (kN)
Displacement (mm) AM - 21_1
P
20 mm 460 mm
Obtained results
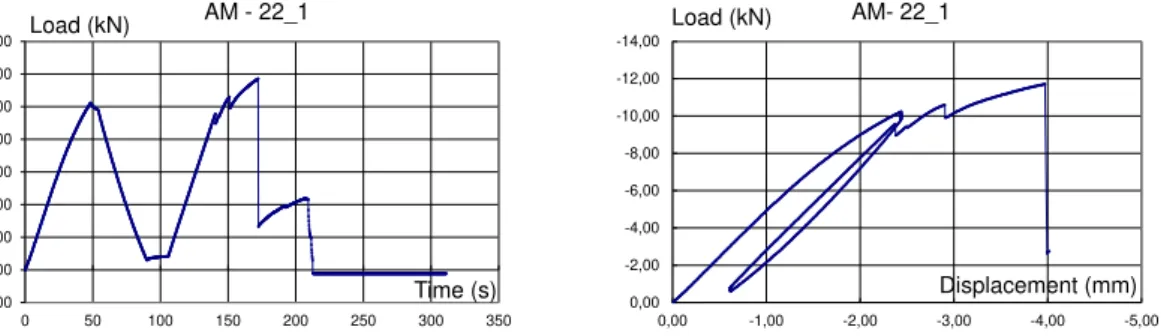
The load–time relation (graph AM-22_1) and load–displacement relation (graph AM-22_2) as shown below.
The vertical force was applied in the radial direction of the trunk of the tree and the test specimen pre-sented a clear linear elastic behaviour up to a force of 6.5 kN, after which it assumed a non-linear behaviour. It is possible to affirm there was a residual deformation after the unloading in the first stage of the test, indi-cating a loss of energy by plastification of the compressed flange.
The rupture load was 9.56 kN, which was lower than the strength in the first stage of the test. After this load, the sample recovers its resistant capacity and the load rises, with new breaking occurring again at 10.59 kN, and the process is repeated successively until the definitive rupture at 11.71 kN.
The average experimental modulus of elasticity or apparent modulus of elasticity according to Eq. (1) is E = 47.04 GPa; the normal stress on rupture according to Eq. (2) is = 60.71 kN/mm2; and the shearing
stress on rupture according to Eq. (3) is = 0.01 kN/mm2.
Discussion of rupture mode
A disruption clearly occurred by shearing stresses at the medial line of height in the cross-section on the mid-dle of the span. After the displacement of the central region, the body modified its inertia, so that it corre-sponded to the two separated parts. Finally, it ruptured by tension stress in a local bending process. There was no delamination at rupture; and the rupture occurred in a brittle way in successive stages according to the changing of the neutral line.
3.1.3 Third sample: AM-23
Structural system
A Structural system as in 3.1.2 was used.
Procedure
Procedure performed was as in 3.1.1.
Positions of fibers and growth rings
Positions of fibers and growth rings: according to Figure 7:
(a) Fibers (b) Growth rings
Figure 7: Positions of fibers (a) and growth rings (b) for AM-23.
Obtained results
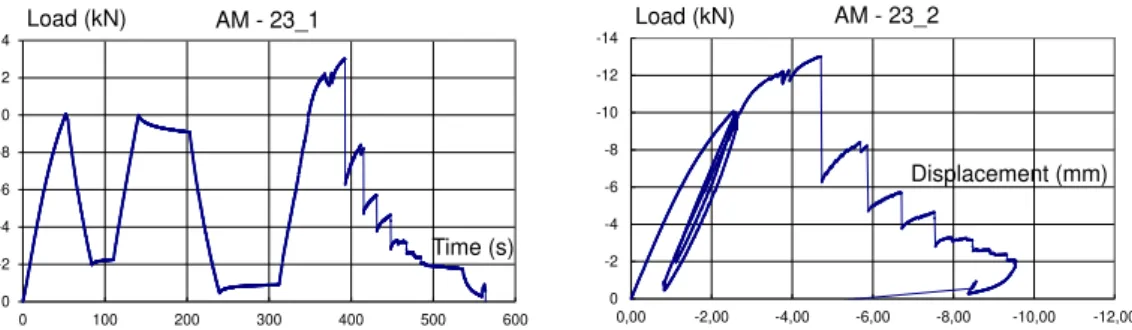
Obtained results as in 3.1.1, except for the following: The load–time relation (graph AM–23_1) and load– displacement relation (graph AM–23_2) are represented below.
-14,00 -12,00 -10,00 -8,00
-6,00 -4,00 -2,00
0,00 2,00
0 50 100 150 200 250 300 350
Load (kN)
Time (s) AM - 22_1
-14,00
-12,00
-10,00
-8,00
-6,00
-4,00
-2,00
0,00
-5,00 -4,00 -3,00 -2,00 -1,00 0,00
Load (kN)
For that sample, the rupture force was 12.21 kN. After that, the sample recovered its resistant capacity and the load rose, with new rupture occurring at 12.23 kN. The rupture process was repeated over and over again up to definitive rupture at 13.01 kN. The apparent modulus of elasticity according to Eq. (1) is E = 45.58 GPa; the normal stress on rupture according to Eq. (2) is = 44.33 kN/mm2; and the shearing
stress on rupture according to Eq. (3) is = 0.011 kN/mm2;
Discussion of rupture mode
The rupture occurs as in 3.1.1, although the positions of the growth rings differ, being slightly more vertical than those in 3.1.1. Only with register objective, it is of interest to mention that the dimension of the actuator did not produced modifications to the results. It is important to take in consideration that the sample width is 20 mm. The visual aspect of the sample final condition occurs due to the test to have entered in the plastic zone of the behaviour of material.
3.1.4 Graphic record and group summary
The rupture modes and results are presented in Figure 8 and Table 3:
Figure 8: Images after tests; h/L ratio = 0.1.
Table 3: Summary table: h/L ratio = 0.1
RESULT SAMPLE
AM-21 AM-22 AM-23 AVERAGE
Modulus of elasticity 45.50 47.04 45.58 46.04 (GPa) Shearing stress 0.02 0.01 0.01 0.01 (MPa) Normal stress 81.34 60.71 44.34 62.13 (MPa)
3.2 h/L ratio = 0.16; sample dimensions = 20 mm × 80 mm × 500 mm
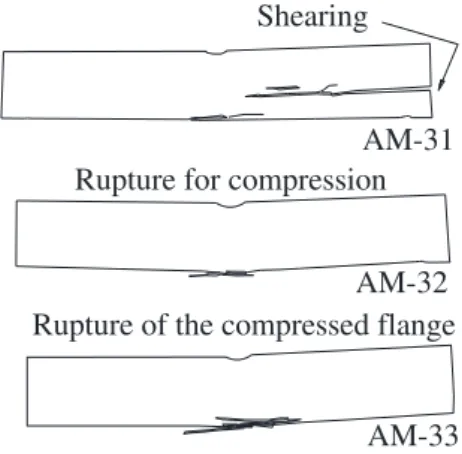
3.2.1 First sample: AM-31
Structural system and procedure -14
-12
-10
-8
-6
-4
-2
0
0 100 200 300 400 500 600
Load (kN)
Time (s) AM - 23_1
-14
-12
-10
-8
-6
-4
-2
0
-12,00 -10,00 -8,00 -6,00 -4,00 -2,00 0,00
Load (kN)
Displacement (mm) AM - 23_2
1st rupture for compression
2nd rupture for tension AM-21
Shearing
AM-22 1st rupture for compression
The structural system and procedure adopted were similar to those adopted in 3.1.2. The fiber and growth rings position are as in 3.1.3.
Obtained results
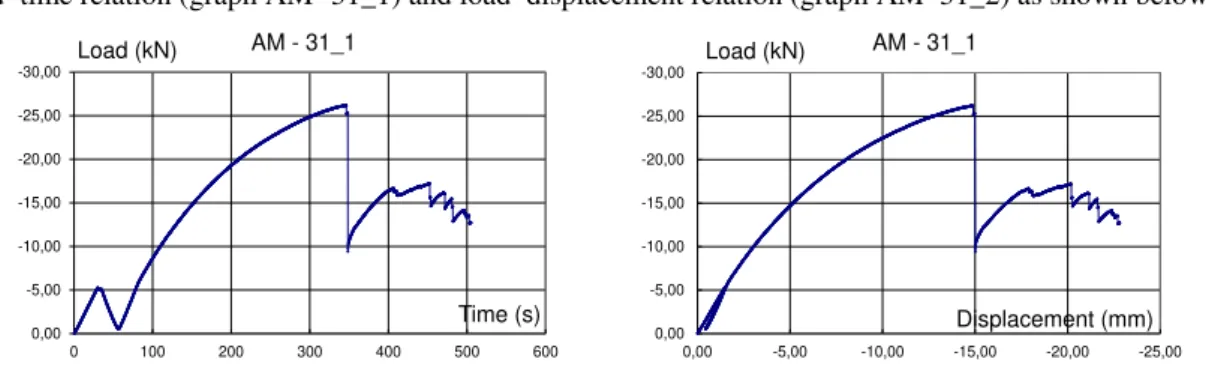
Load–time relation (graph AM- 31_1) and load–displacement relation (graph AM–31_2) as shown below.
The plastification occurred at the contact point of the vertical force and support points of the model. Because the sample has a greater inertia, the specimen provides greater stiffness to the flexion, and due to the mentioned plastification, this model showed a well-defined nonlinear behaviour. The sample tested presented its elastic limit at a force of around 7.0 kN. The force on rupture was 26.16 kN. After that, the sample no longer resumed its resistance capacity. The modulus of elasticity according to Eq. (1) is E = 8.32 GPa; the normal stress on rupture according to Eq. (2) is = 64.87 kN/mm2; and the shearing stress on rupture
accord-ing to Eq. (3) is = 0.02 kN/mm2.
Discussion of rupture mode
The rupture mechanism was similar to that in 3.1.2, with the horizontal shear stress separating the body into two parts, causing movement of the upper part relative to the lower part in the section on the right support. A proposal to understand the rupture mechanism of this sample was made by JENSEN and GUSTAFSSON 0. There was clear plastification at the point of application of force of the servosystem actuator.
3.2.2 Second sample: AM-32
Structural system and procedure
Structural system and procedure performed was as in 3.1.2, with the first loading conducted up to 5 kN;
Positions of fiber and growth rings
Positions of fiber and growth rings as in Figure 9:
(a) Fiber (b) Growth rings
Figure 9: Positions of fibers (a) and growth rings (b) for AM-32.
Obtained results:
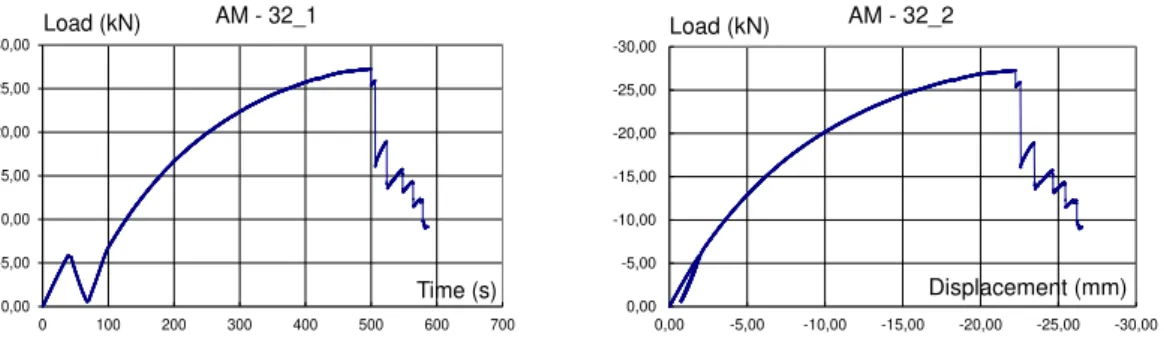
Obtained results as in 3.1.3, except for the following: force–time relation (graph AM-32_1) and load– displacement relation (graph AM-32_2). The elastic limit of 6.94 kN. The apparent modulus of elasticity ac-cording to Eq. (1) is E = 7.15 GPa; the normal stress on rupture acac-cording to Eq. (2) is = 67.60 kN/mm2;
the shear stress on rupture according to Eq. (3) is = 0.03 kN/mm2. -30,00
-25,00
-20,00
-15,00
-10,00
-5,00
0,00
0 100 200 300 400 500 600
Load (kN)
Time (s) AM - 31_1
-30,00
-25,00
-20,00
-15,00
-10,00
-5,00
0,00
-25,00 -20,00 -15,00 -10,00 -5,00 0,00
Load (kN)
Discussion of rupture mode
Discussion of rupture mode occurred as in 3.1.3, except for the following: The growth rings were more slop-ing in the section than in 3.1.3; no crackslop-ing of the part occurred.
3.2.3 Third sample: AM-33
Structural system and procedure
A structural system and procedure: as in 3.1.2 was adopted.
Positions of fibers and growth rings
Positions of fibers and growth rings as in 3.1.3.
Obtained results
Load–time relation (graph AM-33_1) and load–displacement relation (graph AM-33_2) as presented in fig-ures below. The elastic limit of 7.61 kN was found. The apparent modulus of elasticity is 21.37 GPa; the normal stress on rupture is 66.23 kN/mm2; and the shear stress on rupture is 0.03 kN/mm2.
Discussion of rupture mode
Discussion of rupture mode as in 3.1.1, in which there was rupture of the compressed flange.
3.2.4 Graphic record and group summary
The obtained results are listed in Table 4 and the rupture modes are presented in Figure 10:
Table 4: Summary table: h/L ratio = 0.16
RESULT SAMPLE
AM-31 AM-32 AM-33 AVERAGE
Modulus of elasticity 8.32 7.15 21.37 12.28 (GPa) Shearing stress 0.02 0.03 0.03 0.03 (MPa) Normal stress 64.87 67.60 66.23 66.23 (MPa) -30,00
-25,00
-20,00
-15,00
-10,00
-5,00
0,00
0 100 200 300 400 500 600 700
Load (kN)
Time (s) AM - 32_1
-30,00
-25,00
-20,00
-15,00
-10,00
-5,00
0,00
-30,00 -25,00 -20,00 -15,00 -10,00 -5,00 0,00
Load (kN)
Displacement (mm) AM - 32_2
-30,00
-25,00
-20,00
-15,00
-10,00
-5,00
0,00
0 50 100 150 200 250
Load (kN)
Time (s) AM - 33_1
-30,00
-25,00
-20,00
-15,00
-10,00
-5,00
0,00
-10,00 -8,00 -6,00 -4,00 -2,00 0,00
Load (kN)
Figure 10: Images after tests; h/L ratio = 0.16
3.3 h/L ratio = 0.04; sample dimensions = 20 mm × 20 mm × 500 mm
3.3.1 Samples AM-11 and AM-12
Structural system and procedure
A structural system as in 3.1.2. was adopted. The procedure performed was as in 3.1.2, with the first phase of loading being conducted up to 1 kN.
Positions of fibers and growth rings
Positions of fibers and growth rings: for AM-11, as in 3.1.2; for AM-12 and AM-13: as in 3.1.3.
Obtained results
Load–time relation (graph AM-11_1) and load–displacement relation (graph AM-12_1); and load–time rela-tion (graph AM-11_2) and load–displacement relation (graph AM-12_2) descripted below.
An elastic limit of 1.56 kN was found. An apparent modulus of elasticity of 22.72 GPa; a normal stress on rupture of 82.92 kN/mm2; and a shearing stress on rupture of 0.01 kN/mm2 were calculated.
AM-31
AM-32 Rupture for compression
AM-33 Rupture of the compressed flange
Shearing
-2,50
-2,00
-1,50
-1,00
-0,50
0,00
0,00 20,00 40,00 60,00 80,00 100,00
Load (KN)
Time (s) AM - 11_1
-2,50
-2,00
-1,50
-1,00
-0,50
0,00
-40,00 -35,00 -30,00 -25,00 -20,00 -15,00 -10,00 -5,00 0,00
Load (kN)
Displacement (mm) AM - 11_2
-2,50
-2,00
-1,50
-1,00
-0,50
0,00
0 50 100 150 200 250 300 350 400
Load (kN)
Time (s) AM - 12_1
-2,50
-2,00
-1,50
-1,00
-0,50
0,00
-30,00 -25,00 -20,00 -15,00 -10,00 -5,00 0,00
Load (kN)
Discussion of rupture mode:
Similar to previous cases, obeying the mode for each described situation in function of the growth rings. Due to their small inertia, these pieces have low flexural strength, having a typically elastic behaviour. For this reason, the rupture modes for the three cases correspond to the modes of compression rupture of the upper flange followed by tension in the most distant edge in relation to the centre of the section, according to the preferred directions of rupture.
3.3.2 Third sample: AM-13
For this third sample were researched the follow: Apparent modulus of elasticity of 31.28 GPa; normal stress on rupture of 49.34 kN/mm2; shearing stress on rupture of 0.005 kN/mm2; and the load–time relation (graph
AM-13_1) and load–displacement relation (graph AM-13_2).
3.3.3 Graphic record and group summary
Rupture modes are presented in Figure 11 and a synthesis of the obtained results is shown in Table 5.
Figure 11: Images after tests: h/L ratio = 0.04
Table 5: Summary table: h/L ratio = 0.04
RESULT SAMPLE
AM-11 AM-12 AM-13 AVERAGE
Modulus of elasticity 22.72 22.72 31.28 25.58 (GPa) Shearing stress 0.01 0.01 0.00 0.01 (MPa) Normal stress 82.92 82.92 49.34 71.73 (MPa)
3.4 Summary
The graphs in Figure 12 together with Table 6 summarize the obtained results for the set of tests performed
.
(a) Apparent modulus of elasticity (b) Shear stress in failure (c) Normal stress in failure
Figure 12: Summary of obtained results. -2,50 -2,00 -1,50 -1,00 -0,50 0,00
0 100 200 300 400 500 600 700 800
Load (kN)
Time (s) AM - 13_1
-2,50 -2,00 -1,50 -1,00 -0,50 0,00 -30,00 -25,00 -20,00 -15,00 -10,00 -5,00 0,00 Load (kN) Displacement (mm) AM - 13_2
AM-11 Compression AM-12 Compression AM-13 Compression Tension 0 5 10 15 20 25 30 35 40 45 50
0,04 0,1 0,16
App aren t mod ulus of elas ticity (GPa) Rate h/L 0 0,005 0,01 0,015 0,02 0,025 0,03 0,035
0,04 0,1 0,16
Sh ea r s tres s in failure (MPa ) Rate h/L 56 58 60 62 64 66 68 70 72 74
0,04 0,1 0,16
Table 6: Final summary table.
AVERAGE VALUES h/L RATIO
0.04 0.10 0.16
Apparent modulus of elasticity (GPa) 25.58 46.04 12.28 Shearing stress on failure (MPa) 0.01 0.01 0.03
Normal stress on failure (MPa) 71.73 62.13 66.23
4. CONCLUSIONS
The rupture modes of bent parts should take into account the cleavage surfaces along the beam axis. The elastoplastic material hypothesis is inadequate to model the rupture by the existence of cleavage surfaces. For this reason, can be concluded, considering the experimental investigation performed and restricting the re-sults to the present experimentation in function of the number of samples tested, that the structural behaviour of wood in flexion tends to be considered as elastoplastic in compression and elastic-brittle in tension.
Grow rings function as reinforcement pieces at the transversal direction. When the grow rings are aligned perpendicularly to the axis of the beam the predominant rupture is occurred by shearing stress. How-ever, when a bar of wood undergoes bending, with its fiber more or less in the same direction of the grown rings, occur the failure of the compressed fibers predominantly in the more distant board. With this, a gradual migration of the neutral line in the direction of the tensioned board occurs and finally the piece collapses by distension of the more tensioned side. This phenomenon becomes more accentuated in parts of greater iner-tia.
Although the classic formulas for linear elastic behaviour have been used for calculating the modulus of elasticity and the normal and shear stresses in the section, the rupture mechanisms cannot be analysed only by the typical distribution of tensions along the cross-section, and it is necessary to carry out specific tests to determine the modulus of elasticity in compression and tension, since that obtained from the flexion is an apparent modulus.
It is of interest to note that characterization using rupture diagrams can be a helpful tool to analyse ac-tual cases of failure of acac-tual structures.
5. BIBLIOGRAPHY
[1] KONOPKA, D., GEBHARDT, C., KALISKE, M., ―Numerical modelling of wooden structures‖,Journal of Cultural Heritage, (In Press), available online 24 May 2016.
[2] PITTI, R. M., DUBOIS, F., POP, O., ―Sur une éprouvette assurant la stabilité de la propagation de fissure en mode mixte dans le matériau bois‖, Comptes Rendus Mécanique, v. 336, n. 9, pp. 744–749, September 2008.
[3] ALMEIDA, P.A.O., Estruturas de Grande Porte de Madeira [Large Timber Structures]. Tese de D.Sc. (Doctoral thesis), EPUSP, São Paulo-SP, 1990.
[4] LUKACEVIC, M., FUSSL, J., ―Numerical simulation tool for wooden boards with a physically based approach to identify structural failure‖, Eur. J. Wood Prod., v. 72, n. 4, pp. 497–508, July 2014.
[5] ZHU, J., NAKANO, T., TOKUMOTO, M.,TAKEDA, T., ―Variation of tensile strength with annual rings for lumber from the Japanese larch‖, Journal of Wood Science, v. 46, n. 4, pp. 284–288, August 2000. [6] YATES, J.K., LOCKLEY, E.E., ―Documenting and analysing construction failure‖, Journal of Construc-tion and Engineering Management. v. 128, n. 1, February 2002.
[7] HANSSON, E.F., ―Analysis of structural failures in timber structures: Typical causes for failure and fail-ure modes‖, Engineering Structures, v. 33, n. 11, pp. 2978–2982, November 2011.
[8] JORISSEN, A., FRAGIACOMO, M., ―General notes on ductility in timber structures‖, Engineering Structures, v. 33, n. 11, pp. 2987–2997, 2011.
[9] KIM, Y.J., HARRIES, K.A., ―Modeling of timber beams strengthened with various CFRP composites‖, Engineering Structures, v. 32, n. 10, pp. 3225–3234, October 2010.
[10] SERRANO, E., GUSTAFSSON, P.J., ―Fracture mechanics in timber engineering – Strength analyses of components and joints‖, Materials and Structures, v. 40, n. 1, pp. 87–96, January 2007.
[12] Instituto de Pesquisas Tecnológicas (IPT) (Technological Institute for Research), São Paulo (SP), http://www.ipt.br/informacoes_madeiras/14.htm, accessed on May 2017. (In Portuguese).
[13] NAKAMURA, M., NAKAGAWA, S., NAKANO, T., ―Evaluation of visual impact of multiple image characteristics observed in edge-grain patterns‖, Journal of Wood Science, v. 61, n. 1, pp. 19–27, February 2015.
[14] JENSEN, J.L., GUSTAFSSON, P.J., ―Shear strength of beam splice joints with glued-in rods‖, Journal of Wood Science, v. 50, n. 2, pp. 123–129, April 2004.
[15] VAN DER PUT, T.A.C.M., LEIJTEN, A.J.M., ―Evaluation of perpendicular to grain failure of beams caused by concentrated loads of joints‖, In: Proceeding of the International Council for Research and Inno-vation in Building and Construction, CIB-W18, Meeting Thirty-Three, , paper 33-7-7, Delft, The Netherlands, August 2000.
[16] JENSEN, J.L., ―Splitting strength of beams loaded perpendicular to grain by dowel joints‖, Journal of Wood Science, v. 51, n. 5, pp. 480–485, October 2005.