Reproducibility of Pop-Ins in Laboratory Testing of Welded Joints
C. Berejnoi*a, J.E. Perez Ipiñab, C.L. Llorentec
a
Facultad de Ingeniería, Universidad Nacional de Salta, Avda. Bolivia 5150, Salta (4400), Argentina b
Grupo Mecánica de Fractura, Facultad de Ingeniería, Universidad Nacional del Comahue/ CONICET, Buenos Aires st. 1400, Neuquén (8300), Argentina c
Comisión de Investigaciones Científicas, Facultad de Ingeniería - Universidad Nacional de La Plata, Calle 48 y 116, La Plata (1900), Argentina
Received: August 7, 2000; Revised: November 13, 2000
The pop-in phenomenon, quite common in fracture mechanics tests of welded joints, corre-sponds to a brittle crack initiation grown from a local brittle zone (LBZ) that is arrested in reaching the higher toughness material that surrounds thisLBZ.
A methodology to obtain a high percentage of pop-in occurrence in laboratory testing is necessary to study the pop-in significance. Such a method is introduced in this work and includes the consumable combination and welding procedures for the SMAW welding process to generate artificialLBZ.
In order to find out the influence of the loading state upon the pop-in phenomenon, laboratory
CTOD tests were performed using two specimen configurations: some single edge-notched specimens were loaded on a three-point bending (SE(B)) fixture while others were tested in tensile load (SE(T)). A higher frequency of pop-in occurrence was observed in theSE(B)geometry.
Keywords:pop-in, local brittle zone, fracture toughness
1. Introduction
The material intrinsic heterogeneous (mechanical and metallurgical) properties resulting from any welding pro-cedure bring about some difficulties when fracture mechan-ics tests of welded joints are performed following the procedures issued in ordinary standards (ASTM E399, E1290, E1820, BS 7448: Part 1). CriticalCTODvalues are very sensitive to the microstructures surrounding the crack tip and, as it may sample different zones, the test results show large scatter1. A very low value of toughness is measured if a local brittle zone (LBZ) is met by the crack tip.
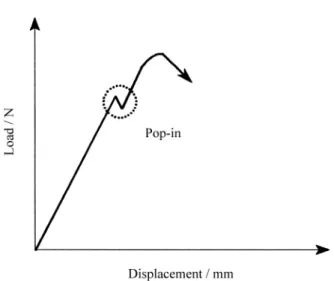
In fracture mechanics tests of welded joints, small oc-currences of brittle crack initiation and arrest are very usual and they appear as discontinuities in the load versus clip gage displacement record (generally a drop in load and an increment in displacement followed by both increment of displacement and load) (Fig. 1). This phenomenon is called
pop-inand results from a small brittle crack growth trig-gered from aLBZthat is subsequently arrested by a mate-rial that is supposed of higher toughness that surrounds this
LBZ. It is important to know the significance of any pop-in because too conservative values of fracture toughness may be obtained when it is regarded as a critical event2.
Pop-ins are normally triggered fromLBZlocated in the heat affected zone (HAZ), but when different aspects of pop-in are to be studied, performing these tests in HAZ
turns both difficult and time and money consuming because a) This zone is small and very heterogeneous.
b) Many times the whole or part of the fatigue precrack tip is placed outside the coarse grain sector of theHAZ.
As described above, a high percentage of tests lack pop-ins. It would be very convenient to achieve a method-ology which should make a high rate of pop-ins available. It is desirable that this methodology should also allow a high percentage of pop-in production at near room tempera-ture.
Laboratory tests are generally performed under dis-placement control conditions while actual structures are many times subject to conditions closer to load control than to displacement control. The stress intensity factor may diminish as a consequence of an increment in crack length under constant displacement conditions, and this decrement
a
in load severity is likely to be the cause of the crack arrest. The crack arrest would also be produced by a stress waves reflection in the specimen boundaries close to the crack tip. If a crack is arrested in a specimen due to any of these causes, the same crack would not be arrested in a structural component and consequently a brittle failure would result
2-5
.
It is important to note that the load state acting over an actual structure may be different from the corresponding load acting over a specimen in a standard test (SE(B) orCT
specimens),i.e., mainly tension loads instead of bending loads.
A methodology for the generation of pop-ins in labora-tory testing is introduced in this work. It includes the search for consumable combination (welding procedure) for the
SMAWwelding process to generate artificialLBZ, and the choice of the most convenient orientation of the crack regarding the weld direction in order to improve the occur-rence of pop-ins at relatively high temperatures (between -18 °C and room temperature).
Once the most favorable conditions for the occurrence of pop-ins were selected, the influence of the loading state over the pop-in was studied. In order to do this, tests were performed with some specimens subject to bending loads (SE(B)) and some others subject to tensile loads (SE(T)). The specimens always belonged to the single edge-notched type.
A scanning electronic microscope was used to watch the fracture surfaces of the broken specimens, while an optical microscope was employed to determine the differ-ent zones reached by the crack.
2. Reproducibility of Pop-Ins
2.1. Consumable and specimen geometry selection
Specimens were obtained from A516 grade 70 steel plates (25 mm thickness), and welded using the SMAW
process.
In order to produce artificialLBZ,two different elec-trodes were employed (Fig. 2). Arimochiet al.also used this technique, except that they performed the tests at very low temperatures2.
TheAWS E6013electrode was selected for filler beads, while the three electrodes used in the central bead to pro-duceLBZwere:
-DIN E6-55 (60w) r, -AWS E7018-A1, and -AWS E7010-A1.
Table 1 shows chemical and mechanical characteristics of the above mentioned electrodes.
Single edge-notched bending (SE(B)) specimens with square section (BxB)were machined in order to test them within two types of notch orientation (Fig. 3) (In accord-ance with nomenclature in Ref. 6):
Type 1 specimens 6TS-W
Type 2 specimens 6TW-W
The first letter indicates the normal direction to the notch plane, the second letter indicates the expected fatigue
Figure 1.Typical pop-in manifestation in aPvs.CMODrecord.
Table 1.Chemical and mechanical characteristics of the electrodes used.
Electrode Chemical composition (%) σU(MPa) σY(MPa) Hardness HRC
C Mn Mo Si Cr
AWS E6013 0.10 0.35 - 0.25 500-600 400-500
-AWS E7010-A1 0.11 0.35 0.50 0.18 - 540-640 440-540
-AWS E7018-A1 0.06 0.70 0.50 - - 530-630 450-550
-DIN E6-55 (60w)r 0.75 - - - 7.00 - - 55
crack growing direction, and the third letter refers to the zone where the crack tip is located (W corresponding to Weld Metal).
Sumpter used bothTSandTWgeometries7,8. Arimochi
et al.used special designed specimens to produce artificial
LBZ: they used consumables with no Ni for the central bead, while a high Ni content electrode was used as tough filler.2They tested the specimens using aTWgeometry at very low temperatures (-120 °C < T < -60 °C). Koçaket al.tested compact specimens at room temperature with the crack tip located at the heat affected zone (HAZ)3. They used both transverse and longitudinal crack tip orientation. Specimen fatigue precracking was performed in accord-ance with BS 7448: Part 19. Previous to fatigue precracking, a mechanical stress relief technique (reverse bending) was performed6.
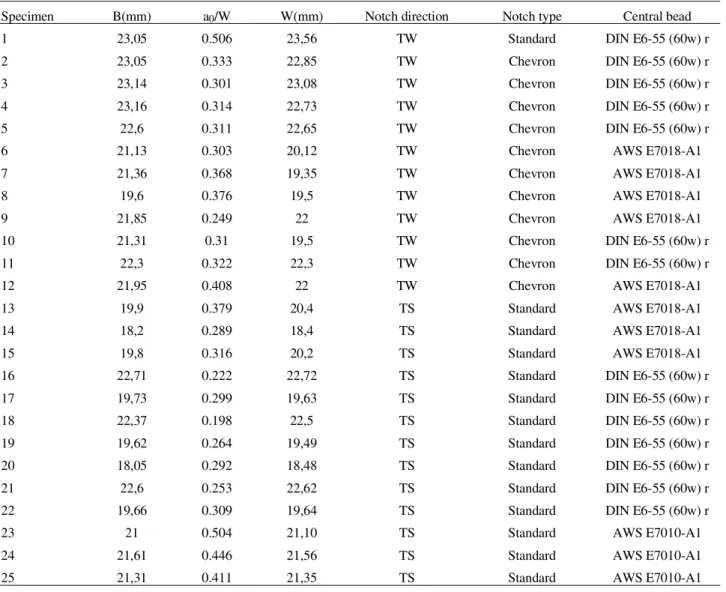
Table 2 shows the specimen dimensions, notch directions, notch types and the electrodes used as cen-tral bead.
Figure 3.TSandTWgeometries.
Table 2.Specimen dimensions, notch characteristics and type of electrode used as central bead.
Specimen B(mm) a0/W W(mm) Notch direction Notch type Central bead
1 23,05 0.506 23,56 TW Standard DIN E6-55 (60w) r
2 23,05 0.333 22,85 TW Chevron DIN E6-55 (60w) r
3 23,14 0.301 23,08 TW Chevron DIN E6-55 (60w) r
4 23,16 0.314 22,73 TW Chevron DIN E6-55 (60w) r
5 22,6 0.311 22,65 TW Chevron DIN E6-55 (60w) r
6 21,13 0.303 20,12 TW Chevron AWS E7018-A1
7 21,36 0.368 19,35 TW Chevron AWS E7018-A1
8 19,6 0.376 19,5 TW Chevron AWS E7018-A1
9 21,85 0.249 22 TW Chevron AWS E7018-A1
10 21,31 0.31 19,5 TW Chevron DIN E6-55 (60w) r
11 22,3 0.322 22,3 TW Chevron DIN E6-55 (60w) r
12 21,95 0.408 22 TW Chevron AWS E7018-A1
13 19,9 0.379 20,4 TS Standard AWS E7018-A1
14 18,2 0.289 18,4 TS Standard AWS E7018-A1
15 19,8 0.316 20,2 TS Standard AWS E7018-A1
16 22,71 0.222 22,72 TS Standard DIN E6-55 (60w) r
17 19,73 0.299 19,63 TS Standard DIN E6-55 (60w) r
18 22,37 0.198 22,5 TS Standard DIN E6-55 (60w) r
19 19,62 0.264 19,49 TS Standard DIN E6-55 (60w) r
20 18,05 0.292 18,48 TS Standard DIN E6-55 (60w) r
21 22,6 0.253 22,62 TS Standard DIN E6-55 (60w) r
22 19,66 0.309 19,64 TS Standard DIN E6-55 (60w) r
23 21 0.504 21,10 TS Standard AWS E7010-A1
24 21,61 0.446 21,56 TS Standard AWS E7010-A1
25 21,31 0.411 21,35 TS Standard AWS E7010-A1
2.2. Results
Table 3 and Table 4 show theCTOD (δ*) values at
maximum load and at pop-in initiation. All tests were performed at room temperature.CTODvalues were calcu-lated using the procedure issued in BS 7448: Part 1.
2.3. Analysis
1) The “Reverse Bending” technique was effective. Precrack fronts were generally acceptable according to the requirements set forth by BS 7448: Part 1. When DIN
E6-55 [60w] electrode was used as central bead, a chevron notch had to be machined as a consequence of its great hardness. In these cases, the fatigue precrack grew some-times in two different planes.
2) The welding procedure was effective in producing
LBZfor all three electrodes used as central bead, combined withAWS E-6013electrode as filler bead.
DIN E6-55 (60w) relectrode presented a poor weld-ability and it was also too brittle. In some specimens small cracks were observed prior to fatigue precracking. Of
Table 3. CTODvalues at maximum load and at pop-in initiation.TWspecimens
Specimen δm
(mm)
δp-i (mm)
Notch direction
Pop-in occurrence with respect to maximum load plateau
1 0.16 - TW
-2 0.15 - TW
-3 0.14 - TW
-4 0.29 - TW
-5 0.23 - TW
-6 0.063 - TW
-7 0.24 - TW
-8 0.058 0.058 TW coincident
9 0.39 1.4 TW after
10 0.11 0.033 TW before
11 0.10 - TW
-12 0.31 1.8 TW after
Table 4. CTODvalues at maximum load and at pop-in initiation.TSspecimens.
Specimen δm (mm) δp-i (mm) Notch direction Pop-in occurrence with respect to maximum load plateau
13 0.76 0.94 TS after
14 0.52 - TS
-15 0.53 0.17 TS before
16 0.077 0.18 TS after
17 0.072 0.026 TS before
18 - 0.21 TS near
19 0.053 0.053 TS coincident
20 0.063 - TS
-21 0.068 0.12 TS after
22 0.06 0.031 TS before
23§ 0.30 - TS
-24 0.30 0.30 TS coincident
25 0.33 - TS
course, such specimens were not tested. This electrode is also very hard, making it difficult to machine the resulting welding bead.
The electrode combinations producing artificial LBZ
that proved convenient were:
AWS E6013-AWS E7010-A1(central bead), or
AWS E6013-AWS E7018-A1(central bead). 3) TS notch orientation proved the most convenient because 76.9 % of the tests (10 over a total of 13) presented pop-ins, whilst only 33.3% (4 over a total of 12) of the tests with theTWnotch direction gave pop-ins (Fig. 4 and Fig. 5). It must be noted that in the latter specimens, multiple audible pop-ins were listened to in the linear elastic region, although they were not recorded in the Load vs. Displace-ment graph because of their small size.
A similar analysis based only on equal consumables showed that the most convenient direction to produce pop-in was that referred asTS.
4) For AWS E6013 / AWS E7018-A1 and AWS E6013 / AWS E7010-A1 combinations and TS-W orientation, the presence of coarse grains at the brittle initiation point was verified in each specimen that showed pop-in by means of scanning electronic and optical microscopic examinations. Figures 6-a and 6-b are examples of such examinations. The first one corresponds to the optical microscopic examina-tion of the specimenSE(T) - 7, and shows that the pop-in was initiated at a coarse grain zone. Figure 6-b is the observation taken by a scanning electronic microscope of the same specimen, and reveals the existence of cleavage zones where the pop-in was supposed to initiate at.
5) Pop-ins are considered more important when they occur before the maximum load plateau and most research on this subject has been focused on this situation, but in testing welded joints of parent materials working in the upper shelf zone this phenomenon is sometimes present at or after the maximum load plateau. As not much work has been performed in the latter situation, we consider that a further study is desirable.
6) It is important to note that this methodology can be used for pop-in occurrence before maximum load plateau simply by lowering the test temperature.
3. Influence oof the Loading State
3.1. Experimental procedure
In order to find out the influence of the loading state over the pop-in phenomenon, twenty-one laboratory
CTODtests were performed using two specimen configu-rations: 10 single edge-notched specimens were loaded in a three-point bending fixture (SE(B)), while the remaining 11 specimens were loaded in tensile mode (SE(T)). In order to improve the probability of pop-in occurrence the test temperature was -18 °C. The specimens had a square sec-tion (B = W = 20 mm) (Fig. 3) with shallow cracks, i.e.
TS-W specimens. Prior to fatigue precracking areverse bendingtreatment was applied to each specimen.
The consumables combination chosen was: AWS E6013/AWS E7018-A1.
TheCTODvalues inSE(B) tests were calculated meas-uring the crack mouth opening displacement(CMOD) (Fig. 7) in accordance with BS 7448: Part 19. Instead, *510was
considered as CTODvalue forSE(T) tests and was then directly measured with a clip gage at the specimen surface as shown in Fig. 8.
3.2. Results
Tables 5 and 6 show specimen dimensions andCTOD
values forSE(B) andSE(T) tests respectively.
Figure 4.Frequency of pop-in inTWorientation.
3.3. Analysis
In Table 5 and Table 6 it can be seen that 6 out of 10
SE(B) specimens presented pop-ins, whilst only 4 speci-mens (out of a total of 11) failed due to pop-in in tensile tests. The frequency of pop-in occurrence is greater in the first tests than in the second ones. This is in accordance with the results of Arimochiet al.2, who observed pop-ins at
different temperature ranges, depending on the loading type. ForSE(B) tests the pop-in phenomenon was present at temperatures between -70 °C and -100 °C, while with wide plates under tensile loads, temperatures between -100 °C and -120 °C were necessary to observe this phenomenon. This would indicate that the occurrence of a pop-in in a laboratory bend test does not mean that the same behavior should be expected in an actual structure under tensile loading. However, this is not a conclusive observation, and a further study on this subject is necessary.
With Arimochiet al.2results in mind, it is possible to think that the test temperature (-18 °C) corresponds to one in which the pop-in phenomenon might be observed in both
SE(B) andSE(T) tests, being of a higher frequency in the first ones.
Pop-in occurrence depends upon the distance between the crack tip and theLBZ2,3. If this distance is large, the
Figure 6a.Micrograph of specimenSE(T) 7.
Figure 6b.Pop-in initiation point observed using a scanning microscope (specimenSE(T) 7).
Figure 7.SE(B)specimen.
crack would grow reaching the maximum load value before sampling aLBZ. It would also be possible that the loss of constraint due to ductile crack growth causes a lower peak stress value at maximum load plateau, not producing brittle crack growth even when potential LBZ were sampled pre-viously on the crack front.
Referring to loss of constraint,SE(B) andSE(T) speci-mens present very different behaviors when cracks grow in a stable way, being considerably larger in the latter speci-mens10. This would explain the difference in pop-in occur-rence between the analyzed specimen types.
Brittle fracture initiation, when manifested, was always arrested (pop-in phenomenon). The amount of load drop was different inSE(B) andSE(T) tests. In the first ones, the average load drop was 9120 N (64%of the load at pop-in
initiation) whilst in the latter the average load drop was only 3259 N (3.3%of the load at pop-in initiation). As it can be seen, there is a great difference in the average load drop between SE(B) andSE(T) specimens. This would be in accordance with the conclusions of Arimochiet al.2: they found that a pop-in crack is easier to be arrested in an infinite body subjected to tensile load than inSE(B) tests if the unstable crack extension is shorter than certain critical crack length. In this way the load drop would be lower in
SE(T) configuration than inSE(B) one.
The median value forCTODminSE(T) tests is greater than the one corresponding in SE(B) tests. As CTOD
values at maximum load depend on specimen geometry and specimen size, it would not be correct to compareCTODm Table 5.CTODvalues, three point bending specimens (SE(B)).
Specimen a B
(mm)
W (mm)
a/W (mm)
δm (mm)
δpop-in (mm)
Pop-in occurrence with respect to maximum load plateau
SE(B)-1 10.94 19.92 19.64 0.557 0.232 -
-SE(B)-2 9.07 19.58 19.72 0.46 0.131 0.131 coincident
SE(B)-3 11.36 19.82 19.64 0.578 0.082 -
-SE(B)-4 9.93 19.55 19.56 0.508 0.295 -
-SE(B)-5 11.02 20 19.93 0.553 0.685 1.142 after
SE(B)-6 10.00 19.95 19.95 0.501 0.727 -
-SE(B)-7 10.05 19.97 19.96 0.504 0.382 1.502 after
SE(B)-8 9.53 18.97 18.95 0.503 0.211 0.438 after
SE(B)-9 10.6 20.04 19.75 0.537 0.464 0.718 after
SE(B)-10 10.14 20.07 20.06 0.505 0.623 1.041 after
Table 6.CTODvalues, tensile specimens (SE(T)).
Specimen a B
(mm)
W (mm)
a/W (mm)
δm (mm)
δpop-in (mm)
Pop-in occurrence with respect to maximum load plateau
SE(T)-1 9.01 19.89 19.62 0.459 0.443 -
-SE(T)-2 9.18 19.7 19.67 0.466 0.421 -
-SE(T)-3 9.28 19.93 19.62 0.473 & 0.095 before
SE(T)-4 11.07 19.99 19.87 0.557 0.722 -
-SE(T)-5 10.4 19.83 19.76 0.526 1.248 -
-SE(T)-6 8.84 19.63 19.59 0.451 1.659 -
-SE(T)-7 9.58 19.50 20.00 0.479 1.444 1.444 coincident
SE(T)-8 10.28 19.85 19.70 0.522 - 1.045 before
SE(T)-9 7.9 19.00 19.00 0.416 1.068 -
-SE(T)-10 9.77 20.01 20.00 0.489 1.383 -
-SE(T)-11 10.65 19.20 19.26 0.553 0.922 1.145 after
values betweenSE(T) andSE(B) tests. Some other factors would also have influence on this discrepancy:
- different methods for the measurement of displace-ment were used: inSE(T) testsCTODwas directly meas-ured on the specimen surface (*5), whileCTODinSE(B)
tests was calculated, according to BS 7448: Part 1, using the geometric relation betweenCMODandCTOD;
- as ductile crack growth produces more constraint relaxation inSE(T) specimens than inSE(B) ones, maxi-mum load toughness will be larger inSE(T) tests.
4. Conclusions
1) A method for the reproducibility of pop-ins in labo-ratory testing consisting in the combination of welding procedure and crack orientation was introduced.
2)TSspecimens showed a significantly greater percent-age of pop-in occurrence thanTWspecimens. This would be a consequence of a difference in either the amount or in the disposition ofLBZnear the crack front in both speci-men configurations.
3) By using SEM and optical microscopes it was ob-served that the pop-in initiation point was located in coarse grain regions in all cases.
4) Brittle fracture initiation, when manifested, was al-ways arrested (pop-in phenomenon) in both loading states. 5) Occurrence of pop-in was more frequent under bend-ing loadbend-ing than in tensile loadbend-ing, in accordance with other authors observations.
6) Although further work must be led in order to explain the pop-in occurrence frequency difference betweenSE(T) andSE(B) tests, the different constraint relaxation in each geometry due to ductile crack growth would play an impor-tant role.
7) Most pop-ins occurred after the maximum load pla-teau was reached. The absence of LBZ near the crack front and/or the loss of constraint due to ductile crack growth would explain this. Simply by lowering the test
tempera-ture, the methodology introduced here could lead to pop-in occurrence before maximum load plateau is attained.
Acknowledgments
The authors wish to thank Mr. Carlos G. Rodríguez Anido and R.A. Servicios Especiales company for the specimens welding, and Pablo Bilmes for his collaboration in the microscopic examinations.
References
1. Machida, S.; Miyata, T.; Toyoda, M.; Hagiwara, Y.
Fatigue and Fracture Testing of Weldments, ASTM STP 1058, p. 142-156, 1990.
2. Arimochi, K.; Isaka, K. International Institute of Welding, IIW Doc.X-1118-86, 1986.
3. Koçak, M.; Terlinde, G.; Schwalbe, K.-H.; Gnirss, G.
The Fracture Mechanics of Welds, EGF Pub. 2, p.77-95, 1987.
4. Satoh, K.; Toyoda, M.International Institute of Weld-ing, IIW Doc.X-1063-84, 1984.
5. Willoughby, A.A.International Journal of Fracture, 30, R3-R6, 1986.
6.Draft ASTM Test Method for Fracture Toughness Testing of Welds, ASTM E24.06.05.
7. Sumpter, J.D.G. International Journal of Offshore and Polar Engineering, v. 1, n. 3, p. 208, 1991. 8. Sumpter, J.D.G.Fatigue Fract. Engng Mater. Struct.,
v. 14, n. 5, p. 565, 1991.
9. BS 7448: Part 1. Fracture Mechanics Toughness Tests. Part 1.Method for Determination of KIC, Criti-cal CTOD and CritiCriti-cal J Values of Metallic Materials, 1991.