ISSN 0104-6632 Printed in Brazil
www.abeq.org.br/bjche
Vol. 32, No. 01, pp. 59 - 71, January - March, 2015 dx.doi.org/10.1590/0104-6632.20150321s00003158
Brazilian Journal
of Chemical
Engineering
COMPARISON OF UASB AND FLUIDIZED-BED
REACTORS FOR SULFATE REDUCTION
S. M. Bertolino, L. A. M. Silva, S. F. Aquino and V. A. Leão
*Federal University of Ouro Preto, Bio&Hydrometallurgy Laboratory, Department of Metallurgical and Materials Engineering, Campus Morro do Cruzeiro, s.n., Bauxita, 35400-000, Ouro Preto - MG, Brazil.
Phone: + (55) (31) 35591102, Fax: + (55) (31) 35591561 E-mail: [email protected]; [email protected]
(Submitted: December 8, 2013 ; Revised: May 1, 2014 ; Accepted: May 6, 2014)
Abstract - Reactor hydrodynamics is important for sulfidogenesis because sulfate reduction bacteria (SRB) do not granulate easily. In this work, the sulfate reduction performance of two continuous anaerobic bioreactors was investigated: (i) an upflow anaerobic sludge blanket (UASB) reactor and (ii) a fluidized bed reactor (FBR). Organic loading, sulfate reduction, and COD removal were the main parameters monitored during lactate and glycerol degradation. The UASB reactor with biomass recirculation showed a specific sulfate reduction rate of 0.089±0.014 g.gSSV-1.d-1 (89% reduction), whereas values twice as high were achieved in the FBR treating either lactate (0.200±0.017 g.gSSV-1.d-1) or glycerol (0.178±0.010 g.gSSV-1.d-1). Sulfate reduction with pure glycerol produced a smaller residual COD (1700 mg.L-1) than that produced with lactate (2500 mg.L-1) at the same COD.sulfate-1 mass ratio. It was estimated that 50% of glycerol degradation was due to sulfate reduction and 50% to fermentation, which was supported by the presence of butyrate in the FBR effluent. The UASB reactor was unable to produce effluents with sulfate concentrations below 250 mg.L-1 due to poor mixing conditions, whereas the FBR consistently ensured residual sulfate concentrations below such a value.
Keywords: Sulfate reduction; Anaerobic processes; Fluidized bed bioreactors; Glycerol; Upflow anaerobic sludge blanket; Wastewater treatment.
INTRODUCTION
Treatment of sulfate-containing effluents is a ma-jor issue for both mining, metallurgical, and chemi-cal industries due to a frequently large anion content (INAP, 2003). The reasons for such contamination are the widespread use of sulfuric acid in chemical and metallurgical industries, in addition to the natural oxidation of sulfide minerals in mining operations.
Sulfate is not a very toxic compound, but above 600 mg.L-1 in drinking water, it usually has laxative effects. Therefore, the World Health Organization (WHO) does not establish a guideline value for sulfate and only recommends that authorities should be notified when the anion concentration is above
500 mg.L-1 in drinking water. Conversely, since the presence of sulfate in concentrations higher than 250 mg.L-1 may affect the acceptability of drinking water, this concentration is usually taken as a target from a water quality perspective. Regarding waste-water, most countries do not specify a value for sulfate, but limits on maximum total dissolved solids (TDS) are usually set, implying that sulfate concen-trations must comply with such limits (INAP, 2003). Overall, discharge limits varying between 250 mg.L-1 and 500 mg.L-1 are commonplace in mining countries, requiring effluent treatment when sulfate concentra-tions are above such threshold values (WHO, 2011).
60 S. M. Bertolino, L. A. M. Silva, S. F. Aquino and V. A. Leão
are the most studied. Ideally, both reactors must ensure a high concentration of active biomass along with good mixing conditions so that high perform-ances can be achieved (Kato et al., 1994; Nielsen, 1987; Omil et al., 1996). Furthermore, in the case of UASB reactors, the residence time must be larger than the generation time to avoid microorganism washout (during sulfidogenesis) (Kaksonen et al., 2004). Overall, the performance of anaerobic reactors treating high sulfate loading rates (SLR) is defined by: (i) substrate type (Liamleam and Annachhatre, 2007); (ii) COD.sulfate-1 ratio (Shayegan et al., 2005; Velasco et al., 2008); (iii) inoculum source and en-richment procedure (Mohan, 2005); (iv) pH values (Cao et al., 2009); (v) competition among different groups of microorganisms (Dar et al., 2008; Zhao et al., 2008), and reactor configuration (Sahinkaya et al., 2007; Sheoran et al., 2010). Moreover, competi-tion between sulfate-reducing bacteria (SRB) and methane-producing microorganisms (MPM) in an-aerobic reactors is well documented (Bhattacharya et al., 1996; Harada et al., 1994; Omil et al., 1998), but the fermentative metabolism, which can also degrade low molecular weight carbon sources (Dinkel et al., 2010; Ren et al., 2007; Zhao et al., 2008), is less discussed in the context of continuous sulfate reduction.
It is also worth emphasizing that the main barriers for the widespread implementation of a biological alternative for sulfate removal are both the cost of organic matter and the need for downstream COD removal. An alternative organic substrate could be crude glycerol (g-phase). This is a by-product of biodiesel production that contains approximately 50– 60% glycerol, 12–16% alkali soaps and hydroxides, 15–18% methyl-ethers, 8–12% methanol and 2–3% water. With the development of the biodiesel indus-try, a surplus of crude glycerol is foreseen, but it has been tested mostly as a substrate for methane production (Álvarez et al., 2010; Fountoulakis and Manios, 2009; Lopez et al., 2009; Yang et al., 2008), and only a few studies have addressed glycerol application as a potentially inexpensive carbon and electron source for SRB growth (Dinkel et al., 2010; Qatibi, 1990). Therefore, this work initially sought to assess the performance of two different bioreactors treating sulfate-laden waters: (i) an UASB reactor, which has a simple and inexpensive design and does not require a supporting material for bacterial growth, and (ii) a FB reactor, in which activated carbon was utilized as support. The second goal was to investigate the use of pure glycerol as a carbon source for sulfate reduction in the reactor with the best performance (fluidized bed reactor), as a
preliminary step before investigating the use of crude glycerol.
MATERIALS AND METHODS
Bioreactors
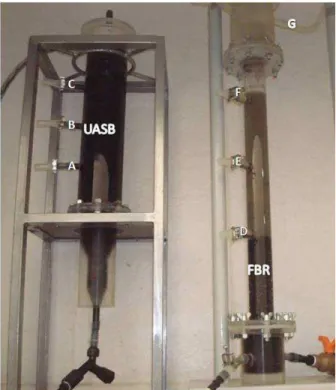
Two lab-scale bioreactors were projected and assembled as shown in Figure 1. Both reactors were placed inside a fume hood in a temperature-con-trolled room, whereby the temperature was main-tained at 25±2 ºC (simulating an industrial opera-tion). Peristaltic pumps fed a Postgate C medium supplemented with sulfate (0.5 g.L-1 KH2PO4; 1.0 g.L-1 NH4Cl; 0.06 g.L-1 MgSO4.7H2O; 0.1 g.L-1 FeSO4.7H2O; 0.25 g.L-1 yeast extract; 2.96 g.L-1 Na2SO4; and 3.76 g.L-1 lactate as carbon and electron source) into both reactors. The UASB reactor has been previously described (Bertolino et al., 2012). The operational conditions followed in this paper are detailed in Table 1.
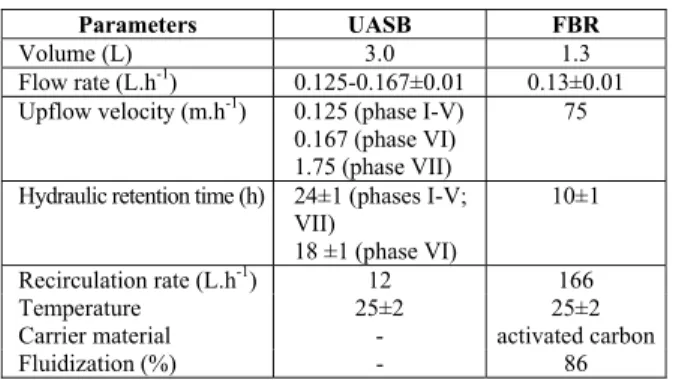
Table 1: Characteristics and operating conditions of the reactors studied.
Parameters UASB FBR
Volume (L) 3.0 1.3
Flow rate (L.h-1) 0.125-0.167±0.01 0.13±0.01 Upflow velocity (m.h-1) 0.125 (phase I-V)
0.167 (phase VI) 1.75 (phase VII)
75
Hydraulic retention time (h) 24±1 (phases I-V; VII)
18 ±1 (phase VI)
10±1
Recirculation rate (L.h-1) 12 166
Temperature 25±2 25±2
Carrier material - activated carbon
Fluidization (%) - 86
The total volume of the FBR was 1.3 liters. Three sampling ports (D, E, and F), a gas outlet (G), a feed tank, and an effluent tank completed the system. Activated granulated carbon (Synth) was used as the biomass carrier material (150 g; 2.1 mm mean diameter; density: 1.63 g.cm-3), and it was fluidized by means of flow recirculation by a second pump with the flow rate set at 166 L.h-1. This resulted in an upflow velocity of 75.0 m.h-1 and 86% of bed expan-sion (Table 1). For fluidization, the effluent from the outlet port (G) was recycled into the system.
Microorganisms and Reactor Start-Up
The original inoculum (granular sludge) was ob-tained from a UASB reactor (real scale) treating domestic wastewater. Enrichment of sulfate-reducing bacteria was performed in a batch reactor (5 liters) with a Postgate C mineral medium (as described in the previous section).
The time diagram depicted in Figure 2 shows the experimental conditions applied in each reactor. The Postgate C medium, with variable sulfate and lactate concentrations (Table 2), was applied for growth. During the FBR operation, the sulfate concentration was kept at 2.0 gSO42-.L-1 in phases I and II, while in phases III and IV, the COD was set at 5.0 g.L-1. The
optimum COD.sulfate-1 ratio (2.5) was applied dur-ing phase V, aimdur-ing at prepardur-ing the FBR for a sub-strate change (from lactate to glycerol). Phase VI was run with glycerol as the only carbon source, since it replaced lactate in the Postgate C medium. Similarly, the operational conditions for the UASB reactor were as follows: reactor start-up during phases I and II; COD increasing from 3.6 gCOD.L-1 to 6.0 gCOD.-1 in phases III to V; flow rate change from 0.125 L.h-1 to 0.167 L.h-1 (HRT reduced from 24h to 18h) (phase VI); and effluent recirculation during phase VII (Bertolino et al., 2012).
The effects of COD.sulfate-1 mass ratio, upflow velocities (UASB), and substrate type (FBR) in the performance of both reactors were assessed. To ac-complish this, the reactor effluents were analyzed twice a week for total filtered chemical oxygen de-mand (COD), sulfate, alkalinity, volatile fatty acids (VFA), volatile suspended solids (VSS), pH, and redox potential (Eh). Once a week, a sample from inside the reactor was withdrawn for measuring VSS, alkalinity, pH, and redox potential, whereas viable cells were determined monthly.
Figure 2: Time diagram showing experimental con-ditions applied in both the UASB reactor and the FBR. Inside each box is depicted the COD.sulfate-1 mass ratio. When there was a change on the COD or sulfate loading the other parameter was kept con-stant. During phase VI (UASB reactor), the change on the COD.Sulfate-1 ratio was due to different flow rate applied.
Table 2: COD and sulfate concentrations applied during the operation of both FBR and UASB reactors (mean values ± standard deviation).
Phases monitored Parameter Reactor
type I II III IV V VI VII
FBR 5086±276 3690±266 5026±250 5007±303 5122±242 4916±503 - COD (mgL-1)
UASB 3546±330 5007±284 3624±254 4743±300 6040±411 5226±800 5200±332 FBR 1989±082 2096±082 2385±137 2756±138 2068±135 1990±082 - Sulfate (mgL-1)
62 S. M. Bertolino, L. A. M. Silva, S. F. Aquino and V. A. Leão
Analytical Methods
Sulfate concentration was determined by ionic chromatography (Metrohm) using an ASSUP-10 column and conductivity detection. Prior to the analy-sis, cupric chloride was added to the reactor effluent sample to precipitate sulfide. The pulp was then filtered (0.22 µm membrane filters), and the aqueous phase was analyzed. VFA (acetic, propionic, valeric, and butyric) were determined by high-performance liquid chromatography, (HPLC, Shimadzu), with an ion exchange column Aminex HPX-87H 300mm x 7.8mm (Bio-Rad). Prior to injection, samples were filtered using 0.22 µm membrane filters (Millipore). Bicarbonate alkalinity (BA), VSS, and COD analysis were carried out according to the Standard Methods for Water and Wastewater (APHA, 2012). Before COD determination, any sulfide present in effluent samples was stripped off by adding a drop of HCl (35%) and flushing the sample for 10 min with N2. The solution’s pH (Hanna HI931400) and its redox potential (Digimed) (vs. an Ag-AgCl electrode) were also recorded.
Microorganisms in the liquid phase (free cells) were quantized by a 3-tube most probable number (MPN) procedure utilizing the Postgate C medium for SRB growth. Prior to the experiments, culture tubes were degassed with pure N2, sealed, and auto-claved (120 °C, 1.5 atm, 20 min). Subsequently, cul-ture tubes plus the control were incubated for 30 days at 35 °C.
Bacterial Diversity
Gene sequences were utilized to determine the bacterial phylogeny and taxonomy present in the sludge of both reactors. Genomic DNA from a mixed culture of SBR representing the different operational conditions of both reactors was extracted and puri-fied using the CTAB/NaCl 10% method. The quality of the DNA was analyzed on a 0.6% agarose gel (w/v). For PCR amplifications, the initial DNA con-centration was determined by spectrophotometry at 260 nm (SHIMADZU UV—1601 spectrophotometer) and adjusted to 50ng/L. Subsequently, PCR amplifi-cation cloning and sequencing of both 16S-23S rRNA Intergenic and dsrB (for SRB), as well as 16S rRNA (for fermentative) gene fragments, were carried out. All samples were cloned into the pGEMT-Easy vector and then sequenced in an ABI 3100 automated
sequencer (Applied Biosystems) using a dye termi-nator kit. The sequences were then used for phylo-genic analysis. The experimental procedures were fully described in Rampinelli et al. (2008) and Rodrigues (2012).
RESULTS
The performance of the UASB reactor treating lactate was previously discussed (Bertolino et al., 2012). It is utilized in the present paper as a refer-ence for analyzing the performance of the FB reactor.
Reactor Performance
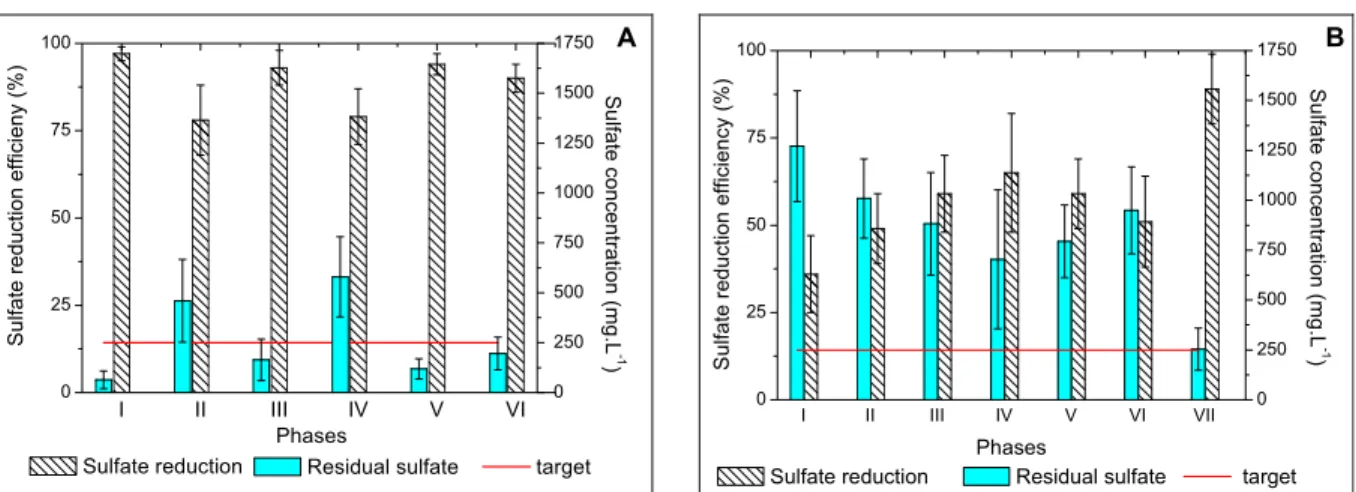
Although both reactors were started up with the same inocula, which were enriched with the same growth medium (Postgate C), their performances were quite distinct. The higher residence time in the UASB reactor (24 hours) would imply better per-formance as compared to the FBR (10-hour resi-dence time). However, such an outcome was not observed due to the different reactor configurations. A high sulfate reduction efficiency (>90%) was observed in the FBR as soon as the adaptation phase ended (Figure 3A), resulting in residual sulfate concentrations below 250 mg.L-1 already in phase I. Similar behavior was not observed in the UASB reactor, which showed sulfate removal efficiencies between 36% and 66% (Figure 3B) during the phases in which the reactor operated without biomass recirculation (I-VI). Nevertheless, when the upflow velocity changed from 0.024 m.h-1 to 1.75 m.h-1 (phase VII), sulfate removal increased to 89%.
I II III IV V VI
0 25 50 75 100
Sulfate reduction
Phases
Su
lfa
te
re
duction efficieny (%)
0 250 500 750 1000 1250 1500 1750
Residual sulfate target
A
S
u
lfat
e co
nc
en
tr
a
tio
n (
m
g.
L
-1
)
I II III IV V VI VII
0 25 50 75 100
Sulfate reduction
B
Phases
S
u
lfate r
edu
ction
e
fficien
cy
(%)
0 250 500 750 1000 1250 1500 1750
Residual sulfate target
S
u
lfat
e co
nc
en
tr
a
tio
n (
m
g.
L
-1
)
Figure 3: Sulfate reduction, residual and target sulfate concentrations in different phases of FBR (A) and UASB reactor (B) operations.
Table 3: Best parameters achieved during sulfate reduction in the UASB reactor and the FBR, treating synthetic sulfate wastewater with lactate (phases VII - UASB reactor and I – FBR) or glycerol (phase VI - FBR).
UASB FBR Parameters Unit
III VII I VI Chemical oxygen demand (COD) mg.L-1 3624±254 5200±320 5086±276 4916±503 Organic loading rate (OLR) gCOD.L-1.d-1 3.25±0.25 5.04±0.33 12.34±0.98 11.54±1.19 Sulfate loading rate (SLR) gSO42-.L-1.d-1 2.08±0.13 2.0±0.14 4.82±0.32 4.67±0.20
Residual sulfate conc. mg.L-1 882±257 275±106 78±10 90±4
pH - 7.7±0.3 7.7±0.3 8.4±0.1 7.5±0.2
Volumetric COD removal rate gCOD.L-1.d-1 1.44±0.45 1.94±0.56 6.25±0.63 7.44±1.68
Volumetric sulfate reduction rate gSO42-.L-1.d-1 1.22±0.24 1.60±0.26 4.67±0.35 4.21±0.25
Sulfate reduction efficiency % 59±11 80±8 97±2 90±4
COD removal efficiency % 40±11 39±11 51±5 64±12
Overall biomass concentration gVSS.L-1 16.0 18.0 25.6 25.3
Mean specific sulfate reduction rate gSO42-.gVSS-1.d-1 0.077±0.12 0.089±0.014 0.200±0.017 0.178±0.010
Mean specific COD removal rate gCOD.gVSS-1.d-1 0.09±0.028 0.108±0.031 0.266±0.027 0.314±0.071
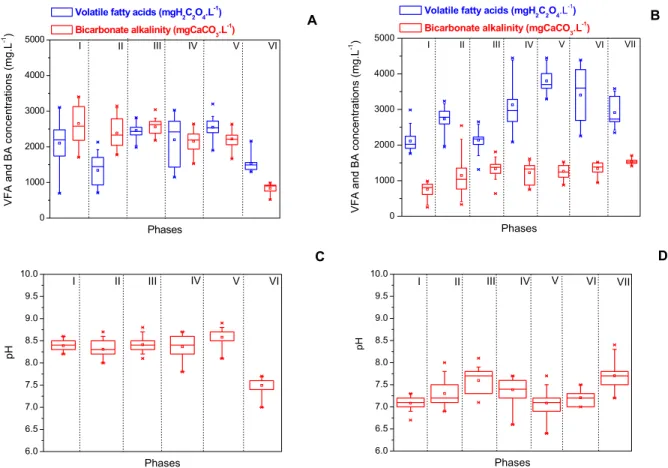
The alkalinity profile (Figures 4A and 4B) was also an important parameter in the assessment of the sulfate reduction performance. This was because the alkalinity is a product of incomplete substrate oxida-tion (of either lactate or glycerol) by different SRB groups (Desulfovibrio, Desulfobulbus,
Desulfoto-maculum, and Desulfomona). Another important
aspect to be assessed was related to the volatile fatty acid (VFA) concentration. VFAs were produced due to lactate/glycerol fermentation, causing a pH de-crease in the reactor. Therefore, the VFA–alkalinity balance ultimately defined the reactor pH profile, as shown in Figures 4C and 4D. The larger alkalinity production in both reactors (Figures 4A and 4B) enabled the pH values (Figure 4C and 4D) to be maintained in the optimum range for SRB growth (Barton, 1995), without any external alkalinity re-quirement. Thus, in the FBR, pH values varied be-tween 7.9 and 8.8, with a mean value of 8.4 (Figure
4C) when lactate was the carbon source, dropping to 7.5 when glycerol was the substrate.
64 S. M. Bertolino, L. A. M. Silva, S. F. Aquino and V. A. Leão
0 1000 2000 3000 4000 5000
Phases
A
VI V IV III II I
VFA
a
nd BA c
o
ncen
tra
ti
ons (mg.
L
-1)
Volatile fatty acids (mgH
2C2O4.L
-1 )
Bicarbonate alkalinity (mgCaCO
3.L
-1)
0 1000 2000 3000 4000 5000
B
VII VI V IV III II I
Phases
VFA an
d BA conc
ent
rat
ions (mg
.L
-1)
Volatile fatty acids (mgH
2C2O4.L
-1 )
Bicarbonate alkalinity (mgCaCO 3.L
-1)
6.0 6.5 7.0 7.5 8.0 8.5 9.0 9.5 10.0
Phases
C
VI V IV III II I
pH
6.0 6.5 7.0 7.5 8.0 8.5 9.0 9.5 10.0
Phases
D
VII VI V IV III II I
pH
Figure 4: Performance parameters in different phases (according to the time diagram, Figure 2) in the FBR (A and C) and the UASB reactor (B and D). VFA: volatile fatty acids; BA: bicarbonate alkalinity.
That impaired the sulfate removal efficiency, which was reduced from 93% (phase III) to 79% during phase IV (Figure 3A). In the best operational conditions (phases III and V), a VFA.alkalinity-1 ratio around 1 was observed. Both VFA and alkalinity were reduced during phase VI, as will be discussed later.
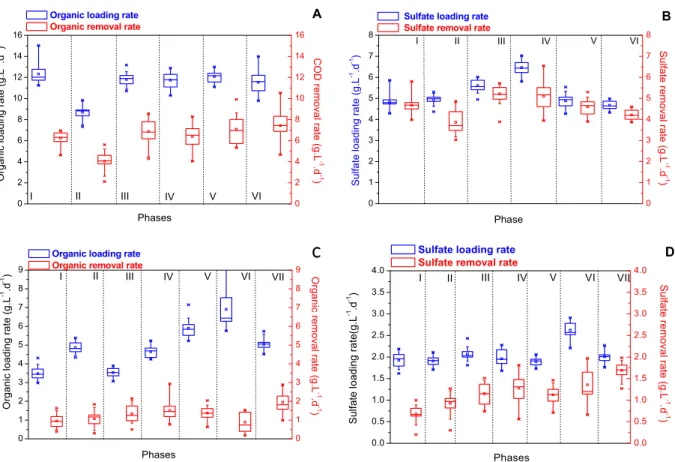
In the UASB reactor during the phases without recirculation (I to VI), alkalinity production in-creased in phases I and 2 and stabilized in the 1300– 1500 mg/L range during phase III, as show in Figure 4B, whereas pH values increased from 7.1 (phase I) to 7.6 (phase III), as shown in Figure 4D. During phases IV and V, the reduction in pH values (7.6 to 6.9, Figure 4D) were ascribed to increased OLR (from 4.65±0.30 g.L-1.d-1 to 5.89±0.48 g.L-1.d-1) (Figure 5C), which implied larger VFA production (Figure 4C). Biomass recirculation (phase VII) enabled stabilization of both VFA and alkalinity, which resulted in higher pH values (7.5, Figure 4D) and can be related to the recovery and stabilization of the
0 2 4 6 8 10 12 14 16 0 2 4 6 8 10 12 14 16 Phases COD
removal rate (g.L
-1 .d -1 ) A VI V IV III II I
Organic loading rate
Organic removal rate
Organi c load ing r a te (g.L -1 .d -1 ) 0 1 2 3 4 5 6 7 8 0 1 2 3 4 5 6 7 8 Sulfat e remov a l rat e (g. L -1 .d -1 ) Phase B VI V IV III II I
Sulfate loading rate Sulfate removal rate
Sulf ate loading r a te ( g .L -1.d -1) 0 1 2 3 4 5 6 7 8 9 0 1 2 3 4 5 6 7 8 9 C O rganic r e mo v al rate (g.L -1 .d -1 )
Organic loading rate
Organic removal rate
Phases VII VI V IV III II I O rganic loadi ng rate (g.L -1 .d -1 ) 0.0 0.5 1.0 1.5 2.0 2.5 3.0 3.5 4.0 0.0 0.5 1.0 1.5 2.0 2.5 3.0 3.5 4.0 Phases S u lf at e re mova l rat e (g .L -1 .d -1 ) D VII VI V IV III II I S u lf ate l o ad in g r a te (g .L -1 .d -1 )
Sulfate loading rate
Sulfate removal rate
Figure 5: Volumetric organic and sulfate loading rates applied in the UASB reactor and the FBR. Organic loading and COD removalrates in the FBR (A) and UASB reactor (C); sulfateloading and removal rates in the FBR (B) and UASB reactor (D).
I II III IV V
0 25 50 75 100 Phases Oxizi d e d l a ctate (% ) 1E7 1E8 1E9 1E10 Lactate oxidized by SRB SRB population A S R B p opul ation (MPN)
I II III IV V VI VII
0 25 50 75 100 Lactate oxidized by SRB SRB population Phases O x iz id ed l a c tat e (% ) 1E7 1E8 1E9 1E10 1E11 B SR B po pu la tio n ( M PN )
Figure 6: SRB population and lactate oxidized by SRB during continuous sulfate removal in the FBR (A) and UASB reactor (B). Glycerol was utilized as substrate in phase VI during the operation of the FBR and therefore does not appear in Figure A.
Effect of the Reactor Configuration on Sulfate Removal
Mass transfer effects play an important role in the performance of high-rate anaerobic reactors (Kato
et al., 1994), and this was particularly important for
sulfidogenesis in the UASB reactor. How the bio-mass grew and was maintained in both reactors affected the enrichment step and therefore the com-petition with fermentative bacteria.
66 S. M. Bertolino, L. A. M. Silva, S. F. Aquino and V. A. Leão
by methanogens), which maintain the suspended sludge. Several studies have shown that granular sludge formation is related mainly to the presence of methanogens (Liu et al., 2003; Schmidt and Ahring, 1996). However, methanogens are highly sensitive to high sulfide concentrations, whereas propionibacte-ria, which are nucleation centers of the granules, are outcompeted by SRB in the presence of sulfide (Oyekola et al., 2009). Therefore, in the current work, an important limitation of the UASB reactor in treating sulfate was the granulation of the biomass (Speece, 1983). Indeed, the fine and weightless granular sludge observed in the UASB reactor was prone to washout. Such a phenomenon occurred during phase VI, when the flow rate was increased from 0.125 L.h-1 (residence time of 24 h) to 0.167 L.h-1 (residence time of 18h) and the upflow velocity was increased from 0.018 m.h-1 to 0.024 m.h-1 (Table 1) in an attempt to improve the mixing conditions in the vessel. This resulted in increased VSS concentrations in the UASB effluent, from 80 mg.L-1 (on average) to nearly 500 mgSSV.L-1 toward the end of the phase. Such biomass loss impaired the reactor performance with a drop in both COD consumption (from 1.6 g.L-1.d-1 in phase V to 0.8 g.L-1.d-1 in phase VI) (Figure 5C) and sulfate removal efficiencies (which progressively decreased from 70% to 40% during phase VI, as depicted in Figure 5D). Omil et al. (1996) also reported that increasing the upward velocity can impair sulfidogenesis.
Because increasing the superficial upflow veloc-ity resulted in bacterial washout, biomass recircula-tion was tested so that the upward velocity was increased to 1.75 m.h-1, thus improving mass transfer in the UASB reactor. Accordingly, sulfate reduction was improved to 89% (specific activity of 1.6 gSO4 2-gVSS-1.d-1) in the UASB reactor during phase VII, as shown in Figure 7. During this phase, there was higher COD consumption and lower dispersion in the VFA and alkalinity values; that is, the reactor operation was more stable. This is because in this new configuration, no biomass washout was ob-served and the bacterial population distribution throughout the UASB reactor was homogenized, as indicated by a higher VSS content in port b during this phase (Figure 8). Despite a shorter residence time, better mixing conditions coupled with the pres-ence of a solid enabled the prespres-ence of an SRB population larger than 109 free cells.mL-1 (Figure 6A) and therefore much larger sulfate removal efficien-cies, which reached 97% (Figure 3), corresponding to a specific sulfate reducing activity rate of 4.8 gSO42-gVSS-1.d-1 already in phase I (Table 3). There-fore, the FBR configuration favored sulfidogensis
because competition by fermentative bacteria was reduced, which was likely due to better mass transfer with a better utilization of the substrate (Figures 6A and 6B).
I II III IV V VI VII
0.055 0.060 0.065 0.070 0.075 0.080 0.085
Phases
Sp
ecif
ic
s
u
lf
at
e re
duct
ion r
a
te
(g
SO
4
2-.g
V
S
S
-1.d -1)
0.05 0.10 0.15 0.20 0.25 0.30
Specific sulfate reduction rate
Propionate production rate
107 - 108
cell.SRB/gVSS 105
- 106
cell.SRB/gVSS
Sp
eci
fic
p
rop
io
na
te p
rod
ucti
o
n
ra
te
(gC
3H 5O 3
-.g
VSS
-1
.d
-1
)
Figure 7: Values of specific sulfate-reduction and propionate production rates in the UASB reactor. Phase VI is characterized by a change in both flow rate and lactate concentration.
III VII
0 2 4 6 8 10 12
VS
S ma
ss (
g
)
Phases
Port A Port B Port C
Figure 8: Biomass profile in the UASB reactor (ports a, b and c) during phase III (no recirculation) and VII (with recirculation). Port c during phase VII was utilized for biomass recirculation.
Sulfate Reduction in the Presence of Pure Glycerol as Substrate
gSO4
2-.gVSS-1.d-1) was similar to that measured when lactate was the only carbon source (0.191±0.016 gSO42-.gVSS-1.d-1), whereas the aver-age specific COD removal rate (0.314±0.071 gCOD.gVSS-1.d-1) was superior to the highest rate observed with lactate (0.266±0.027 gCOD.gVSS-1.d-1), as depicted in Table 3. As glycerol became the sub-strate (phase VI), there was a remarkable reduction in both VFA and alkalinity values. Also, there was a decrease in acetate concentration, along with the appearance of butyrate (Figure 9) in the effluent, suggesting glycerol fermentation (Leja et al., 2011), as will be discussed subsequently.
0 500 1000 1500 2000 2500 3000 3500 4000
P h a se s
A V I V IV III II I
Acet
at
e/
bu
ty
rat
e
con
c
. (m
g
.L
-1 )
Acetate
Butyrate
0 1000 2000 3000 4000
Phases
B VII VI V IV III II I Acetate
Propionate
Ace
tat
e/
pr
op
io
nat
e con
c
.
(m
g.
L
-1)
Figure 9: Acetate, butyrate and propionate profiles in the FBR (a) and the UASB reactor (b). Details on the different phases are depicted in Figure 2.
DISCUSSION
The main metabolic pathways accounting for sulfate reduction and organic matter oxidation in both the UASB and the FBR can be assessed by analyzing the relationship between microbial diver-sity and VFA profiles. Figure 10 depicts a summary of such outcomes: the microorganisms identified in the biomass during lactate oxidation along with both VFA profiles in both reactor effluents and the pro-posed metabolic pathways.
Figure 10: Main metabolic pathways developed
during continuous sulfate removal in UASB and FBR during lactate and glycerol degradation. FB - Ferment-ing Bacteria; SRB - Sulfate ReducFerment-ing Bacteria.
Although lactate was not observed in the UASB reactor effluent, it took 220 days for the SRB population to reach 108–109 cells.mL-1 (Figure 6B), and thus a sulfate reduction efficiency of 66% was attained (Bertolino et al., 2012). That afforded the proposal of two main metabolic pathways in the reactor: (i) incomplete lactate oxidation to acetate during sulfate reduction by SRB (reaction 1) and (ii) lactate fermentation to both acetate and propionate by fermentative bacteria (FB), such as Clostridium
(reaction 2) (Bertolino et al., 2012):
(
)
2
3 5 3 4 2 3 2
3
2 C H O SO 2 C H O HS
2 HCO H 160.1 kJ
− − − −
− +
+ → +
+ + − (1)
(
)
3 5 3 2 3 2 3 5 2 3
3 C H O C H O 2 C H O HCO
H 169.7 kJ
− − − −
+
→ + +
+ −
(2)
68 S. M. Bertolino, L. A. M. Silva, S. F. Aquino and V. A. Leão
fermentative activity (Beaulieu et al., 2000; Omil et al., 1998).
Fluidization and SRB retention by carbon parti-cles in the FBR strongly reduced (or avoided) com-petition between SRB and FB because propionate was absent in the reactor effluent when lactate was the carbon source (Figure 9). Only acetate (2000 mg.L-1 to 2750 mg.L-1) was observed among the analyzed VFA, indicating incomplete lactate oxidation during sulfate reduction (reaction 1). Sulfate reduction as the predominant metabolic pathway in the FBR was further supported by a mass balance for substrate utilization, which confirmed that the entire inlet COD was converted only to acetate (Figure 9); there-fore, Equation (1) solely accounted for acetate production (Figure 6A). Sulfate reduction was lower only in those phases where the COD.sulfate-1 ratio was below 2 (II and IV); therefore, the organic sub-strate was limiting according to Equation (1). For instance, during phase I, a 97±2% sulfate reduction was observed for an OLR of 12.34±0.98 gCOD.L-1.d-1 (COD.sulfate-1 mass ratio > 2.5), as compared to 78±10% when the OLR was 8.7±0.63 g.L-1.d-1 (COD.sulfate-1 mass ratio of 1.8) in phase II. As the biomass concentration leveled out at 18.0 gVSS.L-1 (from phase III, onwards), the specific sulfate re-duction rate was 0.084±0.014 gSO42-.gVSS-1.d-1 in the UASB reactor (Figure 7), which is one order of magnitude smaller than that observed in the FBR (0.191±0.016 gSO42-.gVSS-1.d-1, Table 3), for which the biomass concentration was 24.5 gVSS.L-1, consid-ering free and attached (to activated charcoal) cells.
The incomplete oxidation of lactate to acetate (Equation (1)) is further supported by the absence of acetoclastic-SRB (Rodrigues, 2012), which explained acetate accumulation in the reactor effluent (Figure 9). It must be emphasized that incomplete substrate oxidation also affected the COD.sulfate-1 ratio re-quired in the system. According to Equation (1), during the reduction of 2.0 g.L-1 (21 mmol.L-1) sulfate, 4.0 gCOD.L-1 (42 mmol Lactate.L-1) would be required, following the incomplete oxidation path-way; therefore, the required COD.sulfate-1 ratio should be 2 instead of 0.67 (required when complete substrate oxidation is predominant). This explained the largest sulfate reduction yields observed for COD.sulfate-1 mass ratios above 2.5 (Table 3) in both FB and UASB reactors (as shown in Figures 2 and 3).
The behavior of the FBR was different when glycerol replaced lactate. Although the fermentative activity was considered negligible when lactate was utilized in the FBR with glycerol as the carbon source (phase VI), butyrate (150 mg.L-1) was detected in the
reactor effluent along with acetate (809±143 mg.L-1). Such an outcome suggested the onset of fermentative activity in the FBR (Drożdżyńska et al., 2011) due to the presence of Clostridiumsp, which was identified in all phases of FBR operation (Rodrigues, 2012). When metabolizing glycerol, some Clostridium
species were produced in addition to acetate and butyrate, 1,3-Propanediol (Biebl and Spröer, 2002; Drożdżyńska et al., 2011), which likely did not accumulate in the system because it is also utilized by SRB (Qatibi, 1990).
A metabolic pathway for the oxidation of glycerol during sulfate reduction by a mixed SRB population was hypothesized by Dinkel et al. (2007) and was presented in reaction 3. It predicted that alkalinity should be lower than that produced during lactate degradation (reaction 1), explaining the experimental results achieved in the FBR (Figure 4A). From the stoichiometry of Equation (3) and the residual sulfate concentration (3.0 mmol.L-1), the amount of acetate produced during the reduction of 18 mmol.L-1 of sulfate can be estimated as 7.2 mmol.L-1, which was lower than the measured acetate concentration (13.8 mmol.L-1). Following such observations, it is herein suggested that roughly 50% of the acetate produced was due to glycerol oxidation by SRB (particularly Desulfovibrio spp.) during sulfate reduction, while the other 50% can be related to glycerol fermentation by Clostridium ssp. Such an outcome suggests that glycerol was not as easily degradable as lactate because of the conditions in the FBR. Indeed, the maximum specific growth rate of SRB on a glycerol-based medium was reported as 0.056 h-1 (Dinkel et al., 2010), which is one order of magnitude lower than that reported for SRB growth on lactate (Zellner et al., 1994).
(
)
2
3 8 3 4 2 3 2
2 3 3
2
C H O 1 .25 SO 0.5 C H O
1
.5 H CO 0.5 HCO 1 .25 HS
0.75OH 0.25H O 424.5 kJ
− −
− −
−
+ →
+ + +
+ + −
(3)
which can be explained by the stoichometry of Equa-tions (1) and (3). Such values are even smaller than those produced (2660 mg.L-1 C2H3O2-) when ethanol (utilized in industrial scale sulfate-reducing plants) was applied as a carbon and electron source (Nagpal
et al., 2000). The sulfide produced can be separated from acetate by either precipitation with transition metals (Fe, Cu, Ni) (Cao et al., 2009) or stripping by an inert gas (N2 or CO2), as proposed by Marre et al. (2004), or even by oxidizing to elemental sulfur (by Fe3+ or NO3-), as already utilized in industrial proc-esses (Johnson et al., 2006). After H2S removal, acetate can be degraded either aerobically or anaero-bically, depending on the process configurations and feed water quality. Overall, as a by-product of the emerging biodiesel industry, crude glycerol may be foreseen as a cost-effective alternative to lactate and ethanol for sulfate reduction. Future work will focus on the application of crude glycerol for sulfate removal.
CONCLUSIONS
Mixing conditions play a key role during sulfi-dogenesis. Lactate fermentation by Clostridium spp. was an important metabolic pathway in a bench-scale UASB reactor treating 2.0 g.L-1.d-1 sulfate, without biomass recirculation (poor mixing condi-tions). An increase in the upflow velocity from 0.125 m.h-1 to 1.75 m.h-1 due to recirculation improved the biomass distribution in the reactor and thus the sulfate removal rate to 1.6 gSO42-.L-1.d-1 (89% re-moval), but it decreased the propionate production rate to 0.88 g.L-1.d-1. Therefore, improved mixing conditions in the UASB reactor enhanced both sub-strate degradation and sulfate reduction, as opposed to substrate fermentation. In the fluidized bed reac-tor, good mass transfer conditions enabled the pre-dominance of sulfate-reducing activity by incomplete-oxidizing SRB. When sulfate was not limiting (COD. sulfate-1 mass ratios higher than 2), the sulfate removal rate varied between 4.7 g.L-1.d-1 and 5.1 g.L-1.d-1, which corresponds to sulfate removal efficiencies higher than 95%. The FBR was able to utilize pure glycerol as a carbon and electron source, producing sulfate reduction rates (0.172±0.010 gSO42-.gSSV-1.d-1) similar to those observed with lactate (0.191±0.016 gSO42-.gSSV-1.d-1). As a by-product of the biodiesel industry, glycerol can be a cost-effective option for sulfate reduction, leading to lower acetate concentra-tions (1700 mg.L-1) when compared to lactate oxida-tion (2500 mg.L-1).
ACKNOWLEDGEMENTS
The financial support from the funding agencies FINEP, FAPEMIG, CNPq, and CAPES, as well as Vale, is gratefully appreciated. The scholarships to S. M. Bertolino, S. F. Aquino, and V. A. Leão are espe-cially acknowledged.
REFERENCES
Álvarez, J. A., Otero, L. and Lema, J. M., A method-ology for optimising feed composition for anaero-bic co-digestion of agro-industrial wastes. Biore-source Technology 101, 1153 (2010).
APHA, Standard Methods for the Examination of Water and Wastewater. 21st Ed., (2005).
Barton, L. L., Sulfate-Reducing Bacteria. Biotecho-nology Handbooks, Vol. 8, Plenum Press, New York (1995).
Beaulieu, S., Zagury, G. J., Deschênes, L. and Samson, R., Bioactivation and bioaugmentation of a pas-sive reactor for acid mine drainage treatment. Sixth International Conference on Environmental Issues and Management of Waste in Energy and Mineral Production, Calgary, Canada (2000). Bertolino, S. M., Rodrigues, I. C. B., Guerra-Sá, R.,
Aquino, S. F. and Leão, V. A., Implications of vola-tile fatty acid profile on the metabolic pathway during continuous sulfate reduction. Journal of Environmental Management 103, 15 (2012). Bhattacharya, S. K., Uberoi, V. and Dronamraju, M.
M., Interaction between acetate fed sulfate reducers and methanogens. Water Research 30, 2239 (1996). Biebl, H. and Spröer, C., Taxonomy of the glycerol fermenting clostridia and description of Clostrid-ium diolis sp. nov. Systematic and Applied Mi-crobiology 25, 491 (2002).
Cao, J., Zhang, G., Mao, Z., Fang, Z. and Yang, C., Precipitation of valuable metals from bioleaching solution by biogenic sulfides. Minerals Engineer-ing 22, 289 (2009).
Celis-García, L. B., Razo-Flores, E. and Monroy, O., Performance of a down-flow fluidized bed reactor under sulfate reduction conditions using volatile fatty acids as electron donors. Biotechnology and Bioengineering 97, 771 (2007).
70 S. M. Bertolino, L. A. M. Silva, S. F. Aquino and V. A. Leão
Dinkel, V., Frechen, F., Dinkel, A., Smirnov, Y. and Kalyuzhnyi, S., Kinetics of anaerobic biodegrada-tion of glycerol by sulfate-reducing bacteria.
Applied Biochemistry and Microbiology 46, 712 (2010).
Drożdżyńska, A., Leja, K. and Czaczyk, K., Biotech-nological production of 1,3-propanediol from crude glycerol. Journal of Biotechnology, Com-putational Biology and Bionanotechnology 92, 92 (2011).
Fountoulakis, M. S. and Manios, T., Enhanced meth-ane and hydrogen production from municipal solid waste and agro-industrial by-products co-digested with crude glycerol. Bioresource Technology 100, 3043 (2009).
Harada, H., Uemura, S. and Momonoi, K., Interac-tion between sulfate-reducing bacteria and meth-ane-producing bacteria in UASB reactors fed with low strength wastes containing different levels of sulfate. Water Research 28, 355 (1994).
INAP, Treatment of sulphate in mine effluentes. In-ternational Network for Acid Prevention (2003). Jacobs, P. and Pulles, W., Best practice guidelines
for water resources protection in the South African mining industry. Department of Water Affairs and Forestry: Auckland Park, South Africa (2007). Johnson, D. B., Sen, A. M., Kimura, S., Rowe, O. F.
and Hallberg, K. B., Novel biosulfidogenic sys-tem for selective recovery of metals from acidic leach liquors and waste streams. Mineral Process-ing and Extractive Metallurgy (Trans. Inst. Min. Metall. Section C) 115, 19 (2006).
Kaksonen, A. H., Franzmann, P. and Puhakka, J. A., Performance and ethanol oxidation kinetics of a sulfate-reducing fluidized-bed reactor treating acidic metal-containing wastewater. Biodegrada-tion 14, 207 (2003).
Kaksonen, A. H., Plumb, J. J., Franzmann, P. D. and Puhakka, J. A., Simple organic electron donors support diverse sulfate-reducing communities in fluidized-bed reactors treating acidic metal- and sulfate-containing wastewater. FEMS Microbiol-ogy EcolMicrobiol-ogy 47, 279 (2004).
Kato, M. T., Field, J. A., Versteeg, P. and Lettinga, G., Feasibility of expanded granular sludge bed reactors for the anaerobic treatment of low-strength soluble wastewaters. Biotechnology and Bioengineering 44, 469 (1994).
Kolesárová, N., Hutňan, M., Bodík, I. and Špalková, V., Utilization of biodiesel by-products for biogas production. Journal of Biomedicine and Biotech-nology 2011, 1 (2011).
Leja, K., Czaczyk, K. and Myszka, K., Bio-technological synthesis of 1,3-propanediol using
Clostridium ssp. African Journal of Biotechnol-ogy 10, 11093 (2011).
Liamleam, W. and Annachhatre, A. P., Electron donors for biological sulfate reduction. Biotech-nology Advances 25, 452 (2007).
Liu, Y., Xu, H.-L., Yang, S.-F. and Tay, J.-H., Mecha-nisms and models for anaerobic granulation in upflow anaerobic sludge blanket reactor. Water Research 37, 661 (2003).
Lopez, O., Sanguinetti, D., Bratty, M. and Kratochvil, D., Green technologies for sulphate and metal re-moval in mining and metallurgical effluents. Enviromine Conference. Santiago, Chile (2009). Maree, J. P., Beer, M., Strydom, W. F., Christie, A.
D. M. and Waanders, F. B., Neutralizing coal mine effluent with limestone to decrease metals and sulphate concentrations. Mine Water and the Environment 23, 81 (2004).
Mohan, S. V., Prasad, K. K., Rao, N. C., Bhaskar, Y. V., Babu, V. L., Rajagopal, D. and Sarma, P. N., Biological treatment of low-biodegradable com-posite chemical wastewater using upflow anaero-bic sludge blanket (UASB) reactor. Journal of Scientific and Industrial Research 64, 771 (2005). Nagpal, S., Chuichulcherm, S., Peeva, L. and Livingston,
A., Microbial sulfate reduction in a liquid–solid fluidized bed reactor. Biotechnology and Bioen-gineering 70, 370 (2000).
Nielsen, P. H., Biofilm dynamics and kinetics during high-rate sulfate reduction under anaerobic conditions. Applied and Environmental Micro-biology 53, 27 (1987).
Omil, F., Lens, P., Hulshoff Pol, L. W. and Lettinga, G., Effect of upward velocity and sulphide con-centration on volatile fatty acid degradation in a sulphidogenic granular sludge. Process Biochem-istry 31, 699 (1996).
Omil, F., Lens, P., Visser, A., Hulshoff Pol, L. W. and Lettinga, G., Long-term competition between sulfate reducing and methanogenic bacteria in UASB reactors treating volatile fatty acids. Bio-technology and Bioengineering 57, 676 (1998). Oyekola, O. O., van Hille, R. P. and Harrison, S. T.
L., Study of anaerobic lactate metabolism under biosulfidogenic conditions. Water Research 43, 3345 (2009).
Qatibi, A. I., Fermentation du lactate, du glycerol et des diols par les bactéris sulfato-réductrices du genere Desulfovibrio. Docteur Thesis. Université de Provence (1990). (In French).
Ren, N. Q., Chua, H., Chan, S. Y., Tsang, Y. F. and Sin, N., Effects of COD/SO42- ratios on an acido-genic sulfate-reducing reactor. Industrial & Engi-neering Chemistry Research 46, 1661 (2007). Rodrigues, I. C. B., Métodos moleculares aplicados a
biotecnologias relacionadas ao ciclo do enxofre. Thesis. Universidade Federal de Ouro Preto (2012). (In Portuguese).
Sahinkaya, E., Özkaya, B., Kaksonen, A. H. and Puhakka, J. A., Sulfidogenic fluidized-bed treat-ment of metal-containing wastewater at low and high temperatures. Biotechnology and Bioengi-neering 96, 1064 (2007).
Schmidt, J. E. and Ahring, B. K., Granular sludge formation in upflow anaerobic sludge blanket (UASB) reactors. Biotechnology and Bioengi-neering 49, 229 (1996).
Shayegan, J., Ghavipanjeh, F. and Mirjafari, P., The effect of influent COD and upward flow velocity on the behaviour of sulphate-reducing bacteria.
Process Biochemistry 40, 2305 (2005).
Sheoran, A. S., Sheoran, V. and Choudhary, R. P., Bioremediation of acid-rock drainage by sulphate-reducing prokaryotes: A review. Minerals Engi-neering 23, 1073 (2010).
Speece, R. E., Anaerobic biotechnology for in-dustrial wastewater treatment. Environmental Sci-ence & Technology 17, 416A (1983).
Velasco, A., Ramírez, M., Volke-Sepúlveda, T., González-Sánchez, A. and Revah, S., Evaluation of feed COD/sulfate ratio as a control criterion for the biological hydrogen sulfide production and lead precipitation. Journal of Hazardous Materials 151, 407 (2008).
WHO, Guidelines for drinking-water quality. Genebra (2011).
Yang, Y., Tsukahara, K. and Sawayama, S., Bio-degradation and methane production from glyc-erol-containing synthetic wastes with fixed-bed bioreactor under mesophilic and thermophilic anaerobic conditions. Process Biochemistry 43, 362 (2008).
Zellner, G., Neudörfer, F. and Diekmann, H., Degra-dation of lactate by an anaerobic mixed culture in a fluidized-bed reactor. Water Research 28, 1337 (1994).