ISSN 0104-6632 Printed in Brazil
Vol. 19, No. 02, pp. 229 - 241, April - June 2002
of Chemical
Engineering
EXPERIMENTAL RESULTS FOR THE
EXTRACTION OF ESSENTIAL OIL FROM
Lippia sidoides
CHAM. USING PRESSURIZED
CARBON DIOXIDE
EMBD.Sousa
1, O.Chiavone-Filho
1, M.T.Moreno
1, D.N.Silva
1,
M.O.M.Marques
2and M.A.A.Meireles
3*1Universidade Federal do Rio Grande do Norte, UFRN, Departamento de Engenharia Química,
DEQ/CT, Campus Universitário, Lagoa Nova, 59072-970, Natal-RN, Brazil. E-mail: [email protected]
2
Centro de Genética, Biologia Molecular e Fitoquímica, IAC, Cx.P. 28, 13001-970 Campinas - São Paulo, Brazil.
3
Universidade Estadual de Campinas, UNICAMP, Faculdade de Engenharia de Alimentos, FEA, LASEFI, 13083-970, Campinas - SP, Brazil.
E-Mail:[email protected]
(Received: July 23, 2001 ; Accepted: March 15, 2002)
Abstract - The odoriferous species Lippia sidoides Cham. is abundant in the Brazilian Northeast. Its essential oil possesses antiseptic activity due to the presence of thymol. In this work, thermodynamic and kinetic data were experimentally determined for the CO2 + L. sidoides system. Solubility was determined using the dynamic method at pressures of 66.7 and 78.5 bar and temperatures of 283.15, 288.15, 293.15, 295.15, and 298.15 K. SFE kinetic data were obtained at 288.15 K and 66.7 bar. The composition of the multicomponent solute mixture was determined by GC-MS and compared to the composition of both the volatile oil obtained by steam distillation and the oleoresin obtained using ethanol. The SFE process yield was higher than the yield of either the steam distillation or the ethanol extraction. The solubilities were correlated using the Peng-Robinson equation of state with one binary interaction parameter for the attractive term, considering the essential oil as a pseudo-component. Sovová’s model quantitatively described the overall extraction curve.
Keywords: SFE, extraction, high pressure, essential oil, carbon dioxide, Lippia sidoides.
INTRODUCTION
The world energy crisis and the interest in pure natural products contribute to the feasibility of the process of extraction of natural products using pressurized carbon dioxide (CO2) either near the
critical point or at supercritical conditions. This technique has also been diffused industrially, especially in the fields of foods, perfumes and medicines (McHugh and Krukonis, 1986). Extraction using pressurized fluids (SFE) generally does not
require removal of the solvent either in the product or in the residual solid (Brunner, 1994).
Brazil, the popular name of L. sidoides is “Alecrim Pimenta.”
In this work, experimental results for SFE extraction of L. sidoides essential oil using near critical CO2 are presented. The thermodynamic and
kinetic aspects of the SFE process were studied using an SFE unit containing a fixed bed cell at temperatures of 283.15, 288.15, 293.15, 295.15, and 298.15 K and pressures of 66.7 and 78.5 bar. Solubility data for the pseudo-ternary system, CO2 +
essential oil (multi-component mixture) + cellulosic structure, was measured using the dynamic method (McHugh and Krukonis, 1986).
MATERIALS AND METHODS
Raw Material Characterization and Preparation
The L. sidoides was from Mossoró (State of Rio Grande do Norte, Brazil). The leaves were dried naturally in the shade. After harvesting, the raw material was cleaned, conditioned in plastic bags under vacuum, and stored in a domestic freezer (Consul, model 280, Brazil). The humidity of the leaves was determined using the xylol distillation method (Jacobs, 1958) as recommended for odoriferous plants. For each experimental run the frozen raw material was triturated in a domestic food processor (ARNO, model PRO, Brazil) for 15 seconds. Afterwards, the triturated solid was sifted using a shaker with sieves of the Tyler series (Produtest, no. 3614) for 15 minutes. The particle size distribution adopted for the extraction experiments was a mixture composed of 50% particles of –28/ +35 mesh, 25% of –35/ +48 mesh, and 25% of –20/ +28 mesh in mass percentage.
Characterization of the Particles and of the Fixed Bed
The true density of the triturated leaves was determined by helium pycnometry at the Chemical Facilities of the Chemistry Institute - IQ/Unicamp. The apparent bed density was calculated using the mass of solid loaded into the fixed bed cell and the cell’s volume. The porosity of the bed plus the particles was calculated using the true and the apparent densities.
SFE Experimental Equipment and Procedure
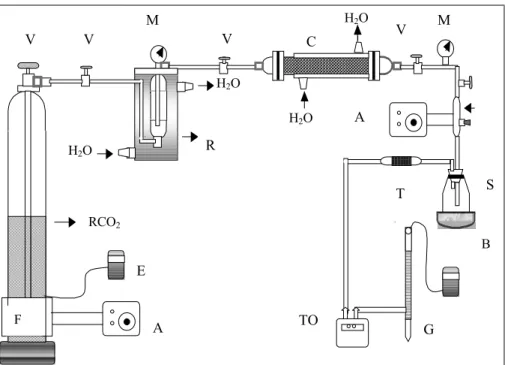
The device used for the SFE experiments is shown in Figure 1. For each load about 120 g of L. sidoides were used to form the fixed bed. The material was weighed and placed inside of the equilibrium cell with the aid of a funnel and
compressed with the help of a stem in order to achieve a complete and uniform accommodation of the bed.
Initially stabilization of the system was achieved by regulating it to operate at the desired temperature and pressure. Once these conditions were attained, the experimental run was begun by opening the valve placed before the equilibrium cell after having opened the downstream valves. Timing was begun at the appearance of the first drop of oil in the collector flask placed just after the micrometering valve. The flow rate of CO2, both in the totalizer and in the
bubblemeter, was recorded at a one-minute interval. Samples were collected at predetermined time intervals. The collector flasks were closed and stored in the freezer for subsequent analysis. The assays were performed at pressures of 66.7 and 78.5 bar and temperatures of 283.15, 288.15, 293.15, 295.15, and 298.15K. The solvent flow rate varied from 0.62×10⁻⁵ to 3.16×10⁻⁵ kg/s.
Steam Distillation and Ethanol Extraction
The essential oil from L. sidoides was obtained by steam distillation using the following procedure: 60 g of triturated L. sidoides particles (average diameter of 0.334×10⁻³ m) were placed inside a Mariote tube and connected to a homemade boiler. After the vapor phase flowed through the condenser, the essential oil and the water mixture were separated. The yield was calculated as the ratio between the mass of oil and the mass of feed.
G
V V V
S R
M M
V
E
F
A
A
TO
T C
B RCO2
H2O
H2O
H2O
H2O
Figure 1: SFE unit: RCO2: CO2 reservoir containing a siphon and HAVING A capacity of 25 kg; C = jacketed equilibrium cell or extractor made of stainless steel with
length of 0.60 m, diameter of 0.0216m and wall thickness of 0.028 m; M = manometer Bourdon-type (RECORD, 004-99, 0 – 100 bar, Brazil); H20 = water bath (TECNAL, model TE 184);
R = jacketed cylinder to maintain the solvent as a subcooled liquid with capacity of 0.5x10-m3; T = capillary glass tube filled with porapak-Q (Supelco, 80/100 mesh, 75CC, lot 113, USA); S = glass flask, capacity of 5 mL;
B = glass recipient with ice cubes and water;
A = voltage regulator (VARIAC, STP - Sociedade Técnica Paulista, model -ATV-215 M, Brazil);
E = digital thermometer (LUTRON, model TM-905); F = heating tape (FISATON, model 5, Brazil);
V = needle-type valves (HOKE, model 3712G2Y, USA); VM = micrometric valve (HOKE, model 1335G2Y, USA);
G = glass bubblemeter; TO = flow totalizer (LAO, model G1, Brazil).
Characterization of the Extracts from L. Sidoides
(a) Chemical Composition of the Extracts
The chemical composition of the L. sidoides extracts was determined using a gas chromatographer coupled to a mass spectrometer system (GC-MS, Shimadzu, model QP 5000, Japan) equipped with a capillary column DB-5 (30m × 0.25 mm × 0.25µm). The carrier gas was helium (99.99% purity, White Martins Gases Industriais, 1.0 mL/min.), injector: 240 oC, detector: 230 oC. The temperature programming was from 60oC to 240oC at 3oC/min, from 240 oC to 280 oC at 10 oC/min, and remained at 280 oC for 5min. The split ratio was
1/20. The sample injected was 1.0 µL of extract diluted in ethyl acetate (0.005g of extract diluted in 1.0 mL ethyl acetate, P. A., chromatographic grade, EM Science, lot 3903991, USA). Identification of the substances was based on i) comparison of substance mass spectrums with GC/MS system data bank (Nist 62 Library), ii) comparison of mass spectrums with data from the literature (McLafferty and Stauffer, 1989), and iii) the retention index (Adams, 1995).
(b) Density of the Extracts
model DMA 602, Austria) at atmospheric pressure and temperatures of 283.15, 288.15, 293.15, 298.15, 303.15, and 308.15 K.
Calculation Procedures
Using the experimental data, the overall extraction curves were fitted to a spline using two straight lines. The first line was identified with the constant extraction rate period (CER). The rate of mass transfer for the CER period (MCER) as well as
the time corresponding to the interception of the two lines (tCER) was computed from the spline. The spline
was fitted using multiple-regression analysis (STATISTICA 5.0). MS Excel 97 was used to determine the interception of the two lines. The mass ratio of solute in the supercritical phase at the equilibrium cell outlet (YCER) was obtained by
dividing MCER by the mean solvent flow rate for the
CER period.
RESULTS AND DISCUSSION
Solubility
The humidity of the L. sidoides was 9.9% (wet basis). The solid density was 1444 kg/m3, the apparent density was 546 kg/m3, and the mean particle diameter was 0.375×10⁻³ m, resulting in a total porosity (bed + particles) of 0.62.
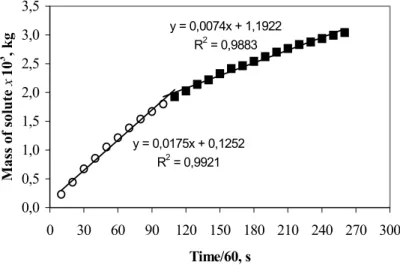
Typical overall extraction curves were obtained under all experimental conditions. These curves are characterized by three distinguishble regions or periods: (i) the constant extraction rate period (CER), where the solid particles can be viewed as being superficially covered by the solute; (ii) the falling or decreasing rate period (FER), where the solids have flaws in the superficial solute layer; and (iii) the diffusion controlled rate period (DCR) of an almost null rate of mass transfer, where the solute at the solid surface is exhausted, and the rate is slow due to the low diffusivity of the solute in solids. In the CER period the solute is extracted essentially by convection. In the second period the solute is extracted by both convection and diffusion. This is a transition period, caused by the exhaustion of the continuous layer of solute on the surface of the particles. Thus, mass transfer is due to both convection and diffusion. In the third period the diffusion of the solute and of the mixture of solute + solvent in the solid prevails. Figure 2 shows the comparison of the overall extraction curve obtained
at 298.15 K, 66.7 bar and 1.50×10⁻⁵ kg/s with the spline fitted using two straight lines. The very last portion of the overall extraction curve, the last three experimental points (measuring time longer than 240 minutes), shows the asymptotic behavior expected for the DCR period. Nonetheless, the transition period starts after about 90 minutes, as shown in Figure 2. In the spline fitting, the key information is the slope of the first line, which was well defined by the calculation procedure employed, and, in addition, the spline quantitatively described the experimental data. Therefore, the effects of temperature, pressure and solvent flow rate on the overall extraction curves can be assessed using the spline parameters.
The solubility in liquid CO2 of the essential oil
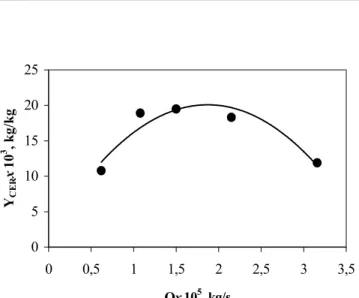
present in L. sidoides was measured by the dynamic method, in which the solvent is saturated by the solute as it flows through the bed of solids at a predetermined constant flow rate. This methodology requires that a set of experiments be done prior to the solubility measurement in order to establish the solvent flow rate at which the solvent leaves the measuring cell under the saturation condition. This is required because at very low solvent flow rates the effects of axial dispersion will interfere with measurement of solubility. At high solvent flow rates, the contact time between the solvent and the solute will be shorter than the time necessary to saturate the solvent, and thus the mass ratio of solute at the fixed bed outlet will be smaller than the saturation value. The solvent flow rate at which saturation occurs is denoted by Q*. In addition, the overall extraction curve should be denoted by the overall saturation curve. In the present work, the search for Q* was performed at a pressure of 66.7 bar and a temperature of 288.15 K. The range of CO2
flow rates used varied from 0.62×10⁻⁵ to 3.16×10⁻⁵ kg/s. Table 1 reports the results obtained and Figure 3 shows the effect of the flow rate on the mass ratio of solute in the supercritical phase at the measuring cell outlet. For experiments accomplished at extremely low solvent flow rates, the effects of axial dispersion were important, resulting in a smaller value of YCER. At high solvent flow rates, smaller
values of YCER were obtained due to shorter
residence times. Figure 3 shows that solvent flow rates in the vicinity of 1.50×10⁻⁵ kg/s can be used to measure solubility, using the dynamic method for the L. sidoides + CO2 system. Nonetheless, the effects of
thermophysical properties of the solute/solvent mixture depend on the range of temperature and pressure used. In this work, the variation in the thermophysical properties of the solute and the solvent was relatively small due to the narrow interval of both temperature and pressure. Based on this, the solubility for the L. sidoides + CO2 system
was measured at solvent flow rates in the vicinity of 1.50×10⁻⁵ kg/s.
Table 2 shows the measured solubility. In the table the amount of solute collected up to the end of the CER period (YieldCER) along with the total
amount of solute collected for the entire measuring time (YieldTOTAL) is also shown. A comparison of
these values with the solubility measured shows that during the entire measuring time the cellulosic structure always contain an amount of solute exceeding that required to saturate the solvent. This is a condition, which is required for use of the dynamic method in contrast to the situation found in other solid fluid processes, such as ethanol extraction, also performed in this work. Due to the strong interaction between the cellulosic structure and the solvent in low-pressure solvent extraction processes, a proportion of approximately 1:10 of solid to solvent is usually necessary. Thus, the solute + solvent mixture will always form a diluted solution, and the extraction rate will be controlled by the mass transfer restrictions. Conversely, SFE rates are controlled by both thermodynamic and mass transfer restrictions.
The effect of temperature on solubility is complex, due to the combination of two variables,
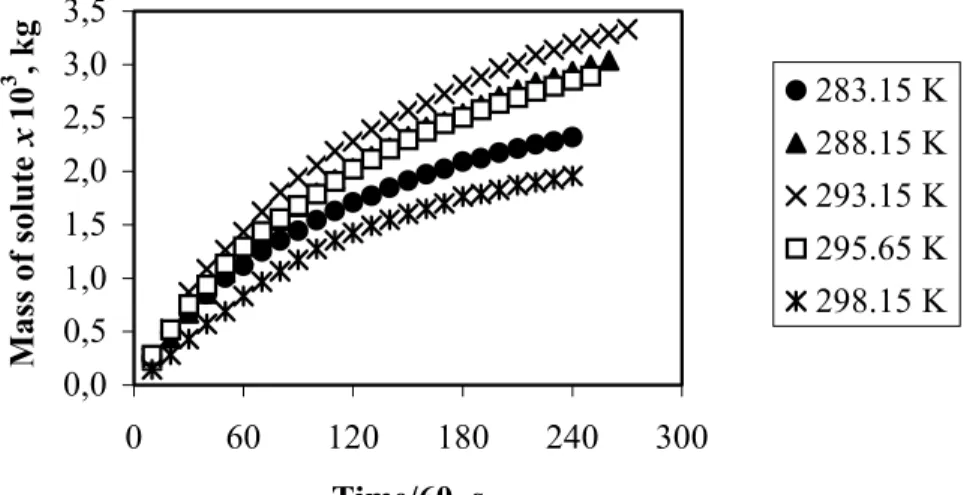
density and vapor pressure. The vapor pressure of the solute increases with temperature, causing an elevation in solubility. However, the density of the solvent decreases, thus causing a decrease in solubility. The dominant effect will depend on the magnitude of each effect on the others for each system. Higher solubility values were obtained at 66.7 bar in the range of 288.15 to 293.15 K. Therefore, the increase in the solubility for this range of temperatures should mainly be the consequence of the increase in the vapor pressure of the solute, which must have overcome the effect of lowering the solvent density. For essential oils the vapor pressure is low; however, small changes in temperature can cause significant changes in solubility. For example, a five-degrees increase in the temperature (from 288.15 K to 293.15 K) at 66.7 bar caused an increase in solubility of 14%. However, the same increase in temperature, but from 293.15 K to 298.15 K, resulted in a reduction in solubility of 42%. Therefore, in the first case the dominant effect was solute vapor pressure, while in the second it was density. The effects of both temperature and pressure on solubility can be better appreciated in Figures 4 and 5. The overall saturation curves at 66.7 bar and various temperatures (Figure 4) reflect, as expected, the behavior of solubility, since the slope of each overall saturation curve is directly proportional to solubility (See Section 2.6). Figure 5 graphically represents the effect of pressure on solubility for temperatures of 288.15 K and 293.15 K. The behavior is consistent with the literature on solid-fluid equilibria (Kurnik and Reid, 1981).
y = 0,0175x + 0,1252
R2 = 0,9921
y = 0,0074x + 1,1922
R2 = 0,9883
0,0 0,5 1,0 1,5 2,0 2,5 3,0 3,5
0 30 60 90 120 150 180 210 240 270 300
Time/60, s
M
as
s of s
ol
u
te
x
10
3 , k
g
Figure 2: A comparison of experimental data (!, ") with the spline fitted ()
Table 1: Spline parameters for the assays performed at 66.7 bar and 288.15 K, used to choose the adequate flow rate.
Q×105 tCER/60 MCER×10
8
YCER×10
3 Yield
CER YieldTOTAL
kg/s s kg/s kg/kg % %
0.62 159 6.67 10.8 0.71 1.47
1.08 93 2.05 18.9 1.03 1.73
1.50 106 2.92 19.5 1.64 3.11
2.15 75 3.05 18.3 1.45 2.24
3.16 60 3.77 11.9 1.44 1.96
0 5 10 15 20 25
0 0,5 1 1,5 2 2,5 3 3,5
Qx105, kg/s
YC
ER
x
10
3 , k
g/
k
g
Figure 3: The effect of solvent flow rate on the mass ratio of solute in the fluid phase at the bed outlet at T=288.15 K and P=66.7 bar.
Table 2: Solubility measured by the dynamic method for the pseudo-ternary system
T P Q*×10-5 Y*×10-3 YieldCER YieldTOTAL
K bar kg/s kg/kg % %
283.15 66.7 1.60 13.4 1.34 2.19
288.15 66.7 1.50 19.5 1.64 3.11
288.15 78.5 1.60 17.8 1.63 3.03
293.15 66.7 1.53 22.7 1.76 3.21
293.15 78.5 1.60 20.1 1.45 2.75
295.65 66.7 1.53 19.0 1.55 3.29
0,0 0,5 1,0 1,5 2,0 2,5 3,0 3,5
0 60 120 180 240 300
Time/60, s
M
as
s of s
ol
u
te
x
10
3 , k
g
283.15 K 288.15 K 293.15 K
295.65 K 298.15 K
Figure 4: The influence of temperature on the overall saturation curves at 66.7 bar.
15 20 25
65 70 75 80
Pressure (bar)
Y
*
x
10
3 , k
g/
k
g
288.15 K
293.15 K
Figure 5: The dependence of solubility on pressure in the L. sidoides + CO2 system.
Compositions of the Essential Oil and Oleoresin
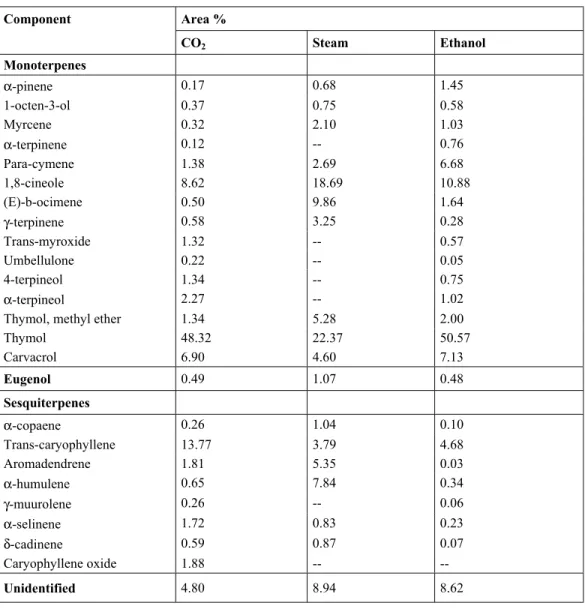
The total yields obtained in the SFE process ranged from 2.12 to 3.29% (Table 2), while the ethanol extraction resulted in a comparably lower yield (2.0%). The steam distillation process unexpectedly had a higher yield (2.4%) than the ethanol extraction process, but a lower one than that usually reported for the SFE process (Povh et al., 2001). Table 3 shows the composition of the total SFE extract obtained at 66.7 bar and 288.15 K. The compositions for the volatile oil and oleoresin are also shown in the table. In the three types of extract, monoterpenic substances such as thymol 1,8- cineole and carvacrol predominated. These last two substances are widely used by the pharmaceutical industries: 1,8-cineole, also known as eucalyptol, is used to impart flavor to various medicines, while carvacrol is employed as an anti-infection and
anthelmintic agent (Windholz, 1996).
Although thymol is the major substance present in all the extracts, the relative proportion of this compound is considerably lower in the steam distillations extract than in the other two. Conversely, the total amount of monoterpenes was approximately equal in the CO2 (73.77%) and steam
distillation (70.94%) extracts and was considerably higher in the ethanolic extract (85.39%). For the sesquiterpene class, the relative proportions of these compounds were similar for the CO2 (20.94%) and
the steam distillation (19.72%) extracts and significatively lower for the ethanol extract (5.51%). The most abundant sesquiterpene was trans-caryophyllene for the steam and CO2 processes while
Table 3: Components identified in the L. sidoides extracts.
Component Area %
CO2 Steam Ethanol
Monoterpenes
α-pinene 0.17 0.68 1.45
1-octen-3-ol 0.37 0.75 0.58
Myrcene 0.32 2.10 1.03
α-terpinene 0.12 -- 0.76
Para-cymene 1.38 2.69 6.68
1,8-cineole 8.62 18.69 10.88
(E)-b-ocimene 0.50 9.86 1.64
γ-terpinene 0.58 3.25 0.28
Trans-myroxide 1.32 -- 0.57
Umbellulone 0.22 -- 0.05
4-terpineol 1.34 -- 0.75
α-terpineol 2.27 -- 1.02
Thymol, methyl ether 1.34 5.28 2.00
Thymol 48.32 22.37 50.57
Carvacrol 6.90 4.60 7.13
Eugenol 0.49 1.07 0.48
Sesquiterpenes
α-copaene 0.26 1.04 0.10
Trans-caryophyllene 13.77 3.79 4.68
Aromadendrene 1.81 5.35 0.03
α-humulene 0.65 7.84 0.34
γ-muurolene 0.26 -- 0.06
α-selinene 1.72 0.83 0.23
δ-cadinene 0.59 0.87 0.07
Caryophyllene oxide 1.88 --
--Unidentified 4.80 8.94 8.62
Thermodynamic Modeling of the Solubility
As described in the previous section, the essential oil of L. sidoides is a multicomponent mixture formed by substances from various chemical classes. The thermophysical properties of the majority of these substances are not available. Nonetheless, for design purposes knowledge of solubility as a function of the operating conditions is required, so we should develop models to describe the behavior of solubility as a function of temperature and pressure. Since, in general, the SFE system will be designed using overall extraction curves – and consequently using the properties of the extract mixture – for the thermodynamic modeling of solubility, the oil was assumed a pseudopure component or pseudocomponent. The required thermophysical properties of the solute were evaluated using the composition shown in Table 3.
There, the composition is reported as the relative proportion or the area percent of the substances detected by the CGMS system. Despite the fact that the response factor of the various compounds may be different, as a first approximation the area percent was taken as the mass fraction of the compounds in the mixture. The required properties of each substance were either obtained from available experimental data (Daubert and Danner, 1995) or calculated using group contribution methods (Reid et al., 1987). Afterwards, Kay’s rule (1936) was used, in terms of molar fraction, for the characterization of each property (M) of the pseudocomponent oil:
∑
=
i ioil
y
M
M
(1)For the normal boiling point (Tb), critical
volume (Vc), the Joback’s group contribution method
(Reid et al., 1987) was used. The vapor pressures were calculated using Wagner's equation as modified by Vetere (1991). The acentric factor for each component was calculated using the following equation (Edmister and Lee, 1983):
b C atm
b C C
T T
P
3
log
1
7 1 T T
P
ω =
−
−
(2)The thermophysical properties of α-pinene, α -terpinene, para-cimene, and γ-terpinene are from DIPPR (Daubert & Danner, 1995). For the other substances, the selection of the group contribution method was based on ability of the method to reproduce the experimental data for other substances found in the literature (Daubert and Danner, 1995). Table 4 shows the critical and physical properties of the compounds present in the L. sidoides essential oil and its pseudocharacterization using Kay’s rule.
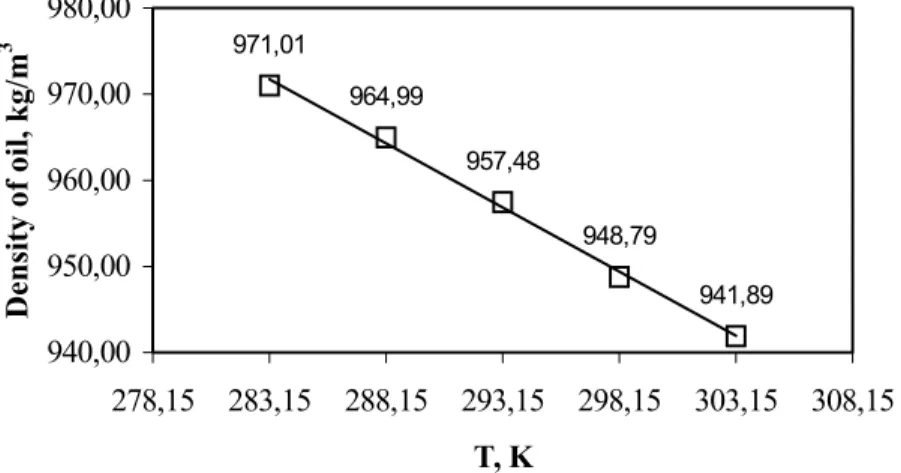
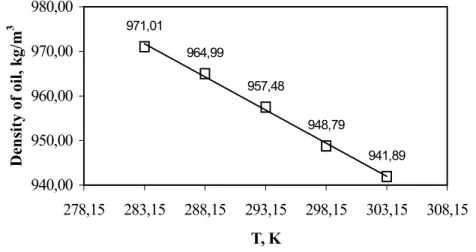
The molar volume of the essential oil was estimated using the experimental density data on the SFE extract (Figure 6) and the average molecular mass. The measured densities varied linearly with temperature for the range of conditions studied.
At constant temperature and pressure, the equilibrium equation for the essential oil (1) and CO2
(2) system is given by the equality of the fugacities in the solid substratum and fluid phases.
(
)
S F
i i i i
ˆ ˆ
f T, P, x =f (T, P, y ) (i = 1,2) (3)
Superscripts S and F refer to the solid substratum and the fluid (liquid, gaseous or supercritical phases)
and xi and yi, correspond to the molar fraction in
these phases, respectively. Considering that the solid substratum phase consists of an inert matrix (cellulosic structure) where the solute (pure essential oil designated by index 1) is dissolved, we have x1 = 1 and
(
)
sat sat
1 1
sat 1
1 F
1
V P P
P exp
RT y
ˆ P
−
=
Φ (4)
Equation (4) expresses the solubility of the oil in the fluid phase. Since it is well known that the interaction between the solute and the inert matrix or cellulosic structure cannot be neglected, the use of Equation (4) implies acceptance that this effect will be lumped together in the binary interaction parameter used to calculate the fugacity coefficient.
In order to calculate the fugacity coefficient, the Peng and Robinson (1976) equation of state was applied, using one binary adjusted parameter for the attractive term, with the following mixing rules:
(
)
i j ij ij ii jj ij
a=
∑∑
y y a for i≠ j a = a a 1 k− (5)i i
b=
∑
y b (6)Figure 7 shows a comparison of experimental and calculated solubility values. The calculations were done using Sandler’s routines (1999). The experimental data was satisfactorily represented by the model, resulting in an average deviation of less than 10%, using estimated interaction parameter (k12)
for oil-CO2 equal to 0.244. This indicates that for
designing purposes the procedure just described for the modeling of solubility will prove to be useful.
971,01
964,99
957,48
948,79
941,89
940,00 950,00 960,00 970,00 980,00
278,15 283,15 288,15 293,15 298,15 303,15 308,15
T, K
D
en
si
ty of oi
l, k
g/
m
3
Figure 6: A comparison of the experimental density (#) of L. sidoides essential oil,
Table 4: Themophysical properties of the compounds present in the essential oil of L. sidoides.
Substance MW
(g/mol)
Mole
Fractiona Tbb
(K)
Tcb
(K)
Pcb
(bar)
Vcb
(cm3/mol) ω
c
α-pinened 136 0.0021 429.29 644.00 27.24 454.00 0.2210
1-octen-3-ol 128 0.0048 454.32 640.71 31.85 424.50 0.5642
Myrcene 136 0.0039 425.48 609.58 24.22 539.5 0.3653
α-terpinened 136 0.0015 448.15 649.00 27.63 489.00 0.3721
Para-cymened 134 0.0173 450.28 652.00 28.00 497.00 0.3738
1,8-cineole 154 0.0939 469.91 689.12 29.60 509.50 0.3465
(E)-b-ocimene 136 0.0062 432.96 622.27 24.46 538.50 0.3553
γ-terpinened 136 0.0072 456.15 661.00 27.63 489.00 0.3761
Trans-myroxide 152 0.0146 458.18 657.47 26.41 532.50 0.3952
Umbellulone 150 0.0025 513.44 736.91 30.56 494.50 0.4567
4-terpineol 154 0.0146 527.33 754.31 33.22 472.50 0.5091
α-terpineol 156 0.0244 515.49 738.83 30.09 482.50 0.4568
Thymol, methyl ether 164 0.0137 509.70 716.96 25.46 555.50 0.4757
Thymol 150 0.5403 540.04 764.51 34.40 447.50 0.5784
Carvacrol 150 0.0771 540.04 764.51 34.40 447.50 0.5783
Eugenol 164 0.0050 559.58 781.18 35.10 452.50 0.6661
α-copaeno 204 0.0021 608.85 822.07 19.60 844.50 0.5744
Trans-caryophyllene 204 0.1132 576.30 802.06 20.27 716.50 0.4235
Aromadendrene 204 0.0149 556.75 772.11 19.70 709.50 0.4279
α-humulene 204 0.0053 591.18 827.88 20.57 724.50 0.3995
γ-muurolene 204 0.0021 571.35 785.53 19.19 720.50 0.4603
α-selinene 204 0.0141 541.57 769.59 20.60 666.50 0.3317
δ-cadinene 204 0.0049 585.98 802.43 19.53 723.50 0.4908
Caryophyllene oxide 220 0.0143 616.00 850.16 22.38 775.50 0.5154
L. sidoides Oile 159.66 533.24 755.71 30.90 505.72 0.5145
a Composition estimated using the GC-MS data (Table 3); b Critical constants estimated by the Joback group contribution method (Reid et
al., 1987); c Acentric factor estimated by the Edmister and Lee expression (1983); d Experimental values retrieved from the AIChE DIPPR
data bank (Daubert and Danner, 1995); e Pseudocharacterization using Kay’s rule (see equation (2)).
971,01
964,99
957,48
948,79
941,89
940,00 950,00 960,00 970,00 980,00
278,15 283,15 288,15 293,15 298,15 303,15 308,15
T, K
D
en
si
ty of oi
l, k
g/
m
3
Figure 6: A comparison of the experimental density (#) of L. sidoides essential oil,
0,003 0,004 0,005 0,006 0,007
280 285 290 295 300
Temperature, K
O
il
mol
e fr
ac
ti
on
Figure 7: A comparison of the experimental (•) with the estimated () solubility using one binary parameter for the attractive term (k12=0.244).
Modeling of the Extraction Curve
To demonstrate the usefulness of the solubility values measured in this work, the overall extraction curve obtained at 66.7 bar, 288.15 K, and 3.16×10⁵ kg/s was fitted to Sovová´s model. Various models have been proposed in the literature to describe the extraction behavior of oils in supercritical and near critical fluids (Tezel and Hortaçsu., 2000, Esquivel et al., 1999 and Reis-Vasco et al., 2000). However, Lack’s extended model discussed by Sovová (1994), Sovová’s model, offers the advantage of providing a simple analytical solution to describe the mass balance and give a good physical description of the process. Sovová’s model assumes pseudo- steady state, plug flow, and that temperature, pressure, and solvent velocity are kept constant throughout the
extraction. In addition, the bed is considered homogeneous with respect to the solute and particle size distributions. The overall extraction curves are represented by the following equations (Pasquel et al., 2000):
For the CER period, t < tCER
2
extr CO
m
=
Y [1 exp( Z)]Q
∗−
−
.t
(7)For the FER period, tCER≤ t < tFER
[
]
2extr CER W CO
m
=
Y t
∗−
t
.exp(z
−
Z) Q
(8)For the diffusion-controlled period, t ≥ tFER
(
)
−
−
+
−
=
∗ ∗O k CER
CO O
O extr
X
X
t
t
N
Q
.
W
exp
1
Y
WX
exp
1
ln
W
Y
X
N
m
2(9)
where mext is the mass of extract (kg), N is the mass of inert solid (kg), Y* is the solubility of the extract in the
solvent (kg/kg), Xk is the solute mass ratio for the unruptured cells in the solid phase, Xp is the solute mass ratio
for the easily accessible solute also in the solid phase, and X0 is the initial and solute mass ratio in the solid
phase. Z = (N.kYa.ρCO2)/(QCO2.(1-ε).ρs), where kYa is the fluid-phase mass transfer coefficient (s-1),. ρCO2 is the
solvent density (kg/m3), QCO2 is the solvent flow rate (kg/s), ε is the bed + particles porosity, and ρs is the inert
solid density (kg/m3). W = (N.kXa)/(QCO2.(1-ε)), where kXa is the solid-phase mass transfer coefficient (s-1).
0 2 4 6 8 10 12 14 16 18 20
0 60 120 180 240 300
Extraction time/60, s
100 * mas
s oi
l /
mas
s s
amp
le
Figure 8: A comparison of the experimental (!) with the calculated ()
overall extraction curve at 288.15 K, 66.7 bar, and 3.16×10⁻⁵ kg/s.
CONCLUSIONS
The use of liquid carbon dioxide at near critical conditions proved to be adequate to extract the essential oil from L. sidoides leaves. For the experimental setup used, the solvent flow rate which proved adequate for the solubility measurements was in the vicinity of 1.50×10⁻⁵ kg/s. The SFE process produced higher yields (3.3%) than both steam distillation (2.4%) and ethanol extraction (2.0%), but the chemical profiles of the extracts were all similar. The thermodynamic method used to estimate solubility satisfactorily described the system. Similarly, the extended Lack model, as presented by Sovová (1994), quantitatively described the overall extraction curve.
ACKNOWLEDGMENTS
We would like to thank CNPq, FAPAM, and FAPESP (1999/01962-1) for the financial support.
NOMENCLATURE
C subscript for critical property CER constant extraction rate D density (kg/m3)
F fugacity
J(X,Y) interfacial mass transfer rate
KXA mass transfer coefficient in the solid phase
(s-1)
KYA mass transfer coefficient in the fluid phase
(s-1)
mext mass of extract (kg)
N mass of inert solid (kg) P pressure (bar)
QCO2 solvent flow rate (kg/s)
Q* solvent flow rate under saturation condition (kg/s)
R2 correlation coefficient
Sat superscript to indicate saturation property T temperature (K)
tCER time of the CER period (min)
tFER time of the period of decreasing rate of
extraction (min)
V molar volume (m3/mol)
XK ratio between the mass of solute inside the
cell and mass of inert solid
XO ratio between the initial mass of solute and
mass of inert solid
Y* solubility (kg oil/ kg CO2)
y1 mole fraction of the oil in the fluid phase
YCER oil concentration at the tcer (kg oil/ kg CO2) F
1
ˆ
Φ
fugacity coefficient for the oil in the fluid mixtureε porosity
ω acentric factor
∆ variation
ρf density of the fluid phase (kg/m3)
REFERENCES
Adams, R.P., Identification of Essential Oil Components by Gas Chromatography/Mass Spectroscopy (1st ed., p.468). Allured Publishing Corporation, Illinois (1995).
Brunner, G., Gas Extraction: An Introduction to Fundamentals of Supercritical Fluids and the Application to Separation Processes (1st ed.). Springer, New York (1994).
Daubert, T.E. and Danner, R.P., DIPPR Data Compilation Version 13.0. New York (1995). Edmister, W.C. and Lee, B.I., Applied Hydrocarbon
Thermodynamics, vol. 1. Gulf Publishing Company Book Division, Houston (1983). Esquivel, M.M., Bernardo-Gil, M.G. and King,
M.B., Mathematical Models for Supercritical Extraction of Olive Husk Oil. Journal of Supercritical Fluids 16, 43-58 (1999).
Jacobs, M., The Chemical Analysis of Foods and Food Products, 3rd ed., pp. 22-23. Van Nostrand Reinhold Co., New York (1958).
Kay, W.B., Density of Hydrocarbon Gases and Vapors. Ind. Eng. Chem., 28, 9, 1014-1019 (1936).
Kurnik, R.T. and Reid, R.C., Solubility Extrema in Solid-Fluid Equilibria. AIChE Journal, 27, 861-863 (1981).
Lemos, T.L.G., Matos, F.J.A., Alencar, J.W., Craveiro, A.A., Clark, A.M. and McChesney, J.D., Antimicrobial Activity of Essential Oils of Brazilian Plants. Phytotherapy Research, 4(2), 82-83 (1990).
Matos, J.A., Farmácia Viva. Edições UFC (Universidade Federal do Ceará), Fortaleza, Brazil (1998).
Matos, J.A., Plantas Medicinais, vol. II. Edições UFC (Universidade Federal do Ceará), Fortaleza, Brazil (1989).
McHugh, M.A. and Krukonis, V.J., Supercritical Fluid Extraction. Butterworths, New York (1986).
McLaferty, F.W. and Stauffer, D.B., The Wiley/NBS Registry of Mass Spectral Data, Vol. 1. John Wiley and Sons, New York (1989).
Pasquel, A., Meireles, M.A.A., Marques, M.O.M. and Petenate, A.J., Extraction of Stevia Glycosides with CO2 + Water, CO2 + Ethanol,
and CO2 + Water + Ethanol. Brazilian Journal of
Chemical Engineering, 17(3), 271-282 (2000). Peng, D.Y. and Robinson, D.B., A New
Two-Constant Equation of State. Ind. Eng. Chem. Fundam., 15, 59-64 (1976).
Povh, N.P., Obtenção do óleo essencial de camomila Matricaria recutita [L.] Rauschert por diferentes métodos: Destilação por arraste a vapor, Extração com solventes orgânicos e extração com CO2
supercrítico, Doctoral diss., FEA – Universidade Estadual de Campinas (UNICAMP), Campinas, SP, Brazil (2000).
Povh, N.P., Marques, M.O.M., Meireles, M.A.A., Supercritical CO2 Extraction of Essential Oil and
Oleoresin from Chamomile (Chamomilla recutita [L.] Rauschert), Journal of Supercritical Fluids, 21(3), 245-256 (2001).
Reid, R.C., Prausnitz, J.M. and Pouling, B.E., The Properties of Gases and Liquids. McGraw-Hill, New York (1987).
Reis-Vasco, E.M.C., Coelho, J.A.P., Palavra, A.M.F., Marrone, C. and Reverchon, E., Mathematical Modeling and Simulation of Pennyroyal Essential Oil Supercritical Extraction. Chemical Engineering Science 15, 2917-2922 (2000).
Sandler, S.I., Chemical and Engineering Thermodynamics, 3rd ed., John Wiley & Sons, New York (1999).
Sant’ana, H.B., Desenvolvimento de uma metodologia para determinação da solubilidade de oleoresinas essenciais em CO2 pressurizado.
Master’s thesis, Faculdade de Engenharia de Alimentos, Universidade Estadual de Campinas (UNICAMP), Campinas, SP, Brazil (1996). Sovová, H., Rate of the Vegetable Oil Extraction
with Supercritical CO2 - Modeling of Extraction
Curves. Chemical Engineering Science, 49(3), 409-414 (1994).
Tezel, A. and Hortaçsu, A., Multi-component Models for Seed and Essential Oil Extractions. Journal of supercritical fluids, 19, 3-17 (2000). Vetere, A., Predicting the Vapor Pressures of Pure
Compounds by Using the Wagner Equation. Fluid Phase Equilibria, 62, 1-10 (1991).