Research Article
Phenotypic Diversity and Genetic Variation within a Collection of Onion
(
Allium cepa
L.) Germplasm from Peninsular India
Neelam Sunil1*, Vinod Kumar2, Medagam Thirupathi Reddy3, Venkateshwaran Kamala4, 1
Winter Nursery Centre, Directorate of Maize Research, Rajendranagar, Hyderabad-500 030, Andhra Pradesh, India 2
International Crop Research Institute for Semi-Arid Tropics, Patancheru, Hyderabad-502324 3
Vegetable Research Station, Dr. Y.S.R. Horticultural University, Rajendranagar, Hyderabad-500 030, Andhra Pradesh, India
4National Bureau of Plant Genetic Resources Regional Station, Rajendranagar, Hyderabad-500 030, Andhra Pradesh, India * Email: [email protected]
(Received: 23 June 2014; Accepted: 13 Aug 2014)
Abstract
Twenty three diverse germplasm lines collected from varying agro-ecological regions of Peninsular India during 2007-08 were characterized and evaluated along with three controls viz. Nasik Red, Light Red and White Marglobe, in an augmented block design during kharif 2009-10, at NBPGR Regional Station, Rajendranagar, Hyderabad. The accessions exhibited good variation for qualitative traits like early seedling vigour, leaf cross section, leaf arrangement, stem shape, bulb shape, bulb skin color, bulb size, bulb hearting and bulb flesh colour and quantitative traits like plant height, number of leaves per plant, leaf length, leaf girth, number of scales per bulb, total soluble solids (TSS) (°Brix), bulb weight and bulb yield per plant. Correlation study revealed that high significant positive correlation was recorded between number of scales per bulb and bulb weight (r=0.71) and significant negative correlation was observed between leaf length and leaf girth (r= -0.88), leaf length and bolting (-0.63) among others. Principal component analysis (PCA) revealed that the first four principal components explained 99.76% of the total variation among the 23 accessions and three controls. PCA I accounted for 97.04% of variation, had maximum influence on bulb weight followed by plant height. The PCA II traits were leaf length and plant height which accounted for 1.97 % of the variance. The PCA III and PCA IV have contributed for 0.39 and 0.39% of total variance. The cluster analysis revealed that dendrogram formed four distinct clusters and cluster III was found to be the largest including controls. The promising accessions for bulb weight were IC 571959, IC 564056, IC 571927, IC 571919 and IC 564059, which may be effectively tapped in sound breeding and conservation program.
Key words
Onion, cluster analysis, germplasm, diversity
Introduction
Onion (Allium cepa L.) is one of the most ancient vegetables known to mankind and cultivated throughout the world for its cuisinal and medicinal value. In India, historical and cultural significance of this crop has been well documented in ancient scripture, Garuda Purana (Shastri, 1995). Depending on the variety, an onion can be spicy, tangy and pungent or mild and sweet. Both bulb and green onions are rich in minerals, protein and ascorbic acid (Sangeeta Kumari and Singh, 2012). Onion originated from central Asia, and Near East is the secondary center (McCollum, 1976). It is believed to have been domesticated from
indigenous wild species in Vavilov’s Central
Asiatic Center, comprising Pakistan, Afghanistan, and the Central Asian republics of the former Soviet Union (Jones and Daviszzzz, 1944). It is a large genus containing five hundred or more species (Abubakar and Ado, 2014). However, molecular analysis data have favoured a new phylogenetic classification of genus Allium
consisting of 15 monophyletic subgenera and provided evidences for inclusion of a central Himalayan and closely related genus Milula in
genus Allium (Stearn 1960; Rabinowitch and Currah 2002; Friesen et al. 2006). About 35-40 species occur in temperate and Alpine regions of Himalaya (Hooker 1892; Stearn 1947; Kachroo et al. 1977; Polunin and Stainton 1984; Karthikeyan
et al., 1989) in India. Onion is a diploid (2n = 2x = 16) plant with natural out crossing rates in the field ranging between 70 and 100% (Van Der Meer and Van Bennekom 1968, 1972) and is reported to show strong inbreeding depression (Jones and Davis 1944). Due to its close proximity to centre of origin and domestication as well as distribution of more species in India, diversity is expected among the onion germplasm from Indian subcontinent.
1995). Assessing the genetic variability in a population and evaluation is pre-requisite for selecting the parents for sound crossing programme. Breeding aims change rapidly, hence evaluation needs to be adaptive. However, there is erosion of genetic diversity of local landraces due to intensive agriculture, uniform cultivars and other market driven factors. Exotic hybrids have made big inroads and farmers grow them for local as well as export market. It has often been seen that hybrid cultivation leads to displacement of local landraces and open pollinated varieties. Onion breeders in India are relying upon variability existing in local land races and varietal development through mass selection. Continuous breeding efforts have led to the release of 45 open pollinated varieties and two F1 hybrids but the productivity has still not met the expectations. However, existing potential diversity of onion has not been realized as a result there are only two public bred hybrids in the Indian market. The productivity of onion is very low as most Indian farmers do their own seed production which leads to non-uniformity in bulbs (Anil et al., 2011). As onion production play a significant role in the economy as other annual crops, more attention should be accorded to the selection of high yielding cultivars for bulb production.
In view of the above, there is need to increase the onion production which can meet the fast expanding domestic and export markets. Exploitation of new onion genetic resources having gene for higher productivity and adaption to diverse agro climatic conditions would assume great significance. Onion being a cross-pollinated crop always provides scope for selection as variability is continuously created.
Material and Methods
Two onion-specific exploration surveys covering different agro-ecological regions of Andhra Pradesh and Orissa states of India were undertaken during 2007-08. Following random sampling strategy, 23 germplasm lines of onion were collected. The collected accessions were evaluated along with three controls namely Nasik Red (N-53), Light Red and White Marglobe in an augmented block design during kharif, 2009-10 at NBPGR Regional Station, Rajendranagar, Hyderabad. The farm is situated at an altitude of 546.2 m above mean sea level. Geographically, it lies at latitude of 17.19 0 N and longitude of 79.230 E. The monthly mean maximum temperature during the crop growth period ranged from 27.8oC to 30.3oC with an average of 29.2oC, while the monthly mean minimum temperature ranged from 13.2oC to 22.6oC with an average of 20.0oC. Relative humidity in forenoon and afternoon fluctuated between 86.0 to 93.0 percent and 44.0-77.0 percent, respectively. Rainfall ranged from
18.2 to 278.9 mm with an average of 146.6 mm was received during the crop period. The monthly mean sunshine hours varied from 2.5 to 7.2 with an average of 4.91 hours per day. At all stages of the crop growth, weather was congenial for growth and development of onion crop during kharif, season. Each accession was raised in a single row plot of 3 m length per block. A row-to-row and plant-to-plant spacing of 30 x 15 cm was maintained, accommodating 20 plants per accession. Observations were recorded on five randomly selected plants for all the traits except bolting percentage and bulb yield per plant which were recorded on whole plot basis. The mean data on various biometric traits were subjected to analysis of variance of augmented block design as per the standard statistical procedure suggested by Federer
(1956). Pearson’s correlation coefficients were
worked out among nine growth and yield attitudes using mean values to identify the yield components using Excel program in MS office. In addition, direct and indirect effect of various independent quantitative traits on dependent bulb yield was also worked out. Multivariate cluster analysis was done using SAS Enterprise guide. Characterization of 14 qualitative traits was carried out as per the minimal descriptors of onion (Srivastava et al, 2001).
Results and Discussion
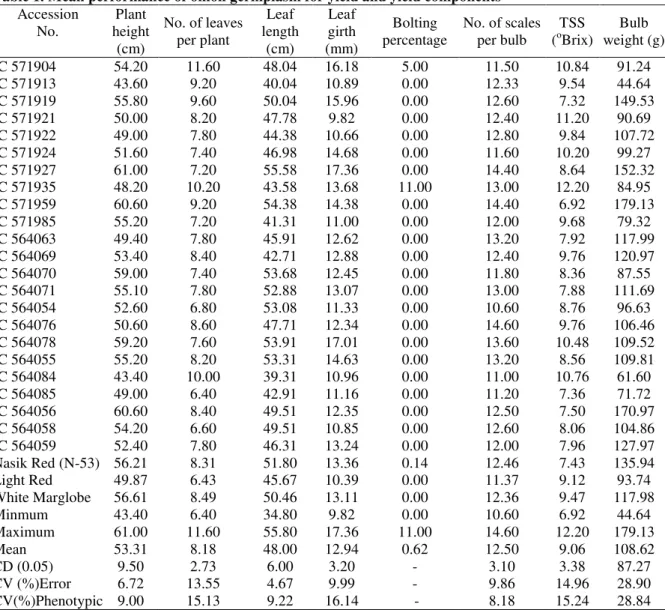
The mean performance of the accessions for various agro-economic traits such as plant height, number of leaves per plant, leaf length (cm), leaf girth (cm), number of scales per bulb, TSS (Brix), bulb weight (g) and bulb yield per plant (g) has been presented in Table 1. The plant height ranged between 43 cm (IC571913) to 61 cm (IC571927) with mean plant height of 53.31 cm, which recorded significant difference (P <0.05) and phenotypic coefficient variation of 9 %. Five accessions IC571927, IC571959, IC564056, IC564078 and IC 564070 recorded exceedingly higher plant height in comparison to controls. Significant difference (P < 0.05) was also recorded in number of leaves per plant, which ranged from 6.40 (IC564085) to 11.60 (IC571904) with phenotypic coefficient variation of 15.13. Six accessions IC571904, IC571935, IC564084, IC571919, IC571913, IC571959 and IC564076 recorded more leaves per plant than controls. The leaf length, which also recorded significant difference (p<0.05), ranged between 39.31cm (IC 564084) and 55.80 cm (IC 571927). The mean leaf length was 48.00 cm. Leaf girth recorded higher phenotypic coefficient of variation at 16.14 %. Only two accessions recorded bolting percentage
recorded significant difference (P<0.05). There were ten accessions with high TSS values than controls namely IC571935, IC571921, IC571904, IC 571913, IC571922, IC571924, IC564069, IC564078 and IC564084. The mean bulb weight recorded highest phenotypic coefficient of variation of 28.84%. There was a significant variation and difference (P<0.05) in average bulb weight (bulb yield per plant). Among controls checks, Nasik Red recorded highest bulb weight (g) per plant (135.94) and accessions which recorded high bulb weight than the controls were IC571919, IC571927, IC 571959 and IC564056. Among the qualitative traits (data table not provided), accessions IC571919, IC571921, IC571927 and IC564056 exhibited very good vigour. No variation was observed in leaf color, leaf habit, leaf arrangement, plant habit at maturity and bulb location. Seventeen accessions possessed semi-circular leaf cross section remaining accessions had prostrate shape. Majority of the accessions had rounded stem shape and only two accessions IC 571904 and IC571927 possessed flat stem shape including checks. High variability was observed for bulb shape. The bulb skin color also varied from white to dark violet color. Accessions IC 571904, IC 571913, IC 571921, IC 571922, IC 571924, IC 571927 and IC 571935 had white colored skin. There were three bulb sizes namely large ( IC571985, IC564063, IC564069, IC564070, IC564071, IC564054, IC564076, IC564078, IC564055, IC564058 and IC564059), medium (IC571904, IC571921, IC571922, IC571924, IC 571927 and IC571935) and rest recorded small bulb size. Two accessions IC571904 and IC571935 recorded bulb hearting as double bulbs were noticed. Pinkish white color flesh was recorded in IC564071. Twelve accessions IC571919, IC571959, IC 564063, IC564069, IC564070, IC564054, IC564076, IC564078, IC564055, IC564084, IC 564085 and IC 564058 had reddish color flesh and remaining accessions had white color flesh.
The onion germplasm accessions exhibited good genetic variability for both qualitative and quantitative traits. The results revealed that the germplasm under study had highest genetic diversity for bulb weight among quantitative traits and bulb shape among qualitative traits. However, other traits leaf length, plant height, leaf girth, TSS, number of leaves per plant and number of scales per bulb have exhibited moderate to low degree of diversity in comparison to yield (bulb weight per plant). Such a large variation for bulb weight per plant from small set of 23 diverse accessions may be attributed to distinct and diverse genetic base of the germplasm under study (Kamala et al, 2011). Among the qualitative traits, bulb shape exhibited high variability as 12 different bulb shapes (thick flat, flat globe, globe, high globe, spindle,
as dehydration so as to minimize onion loss due to poor storage by farmers and marketers (Ibrahim et al., 2013)
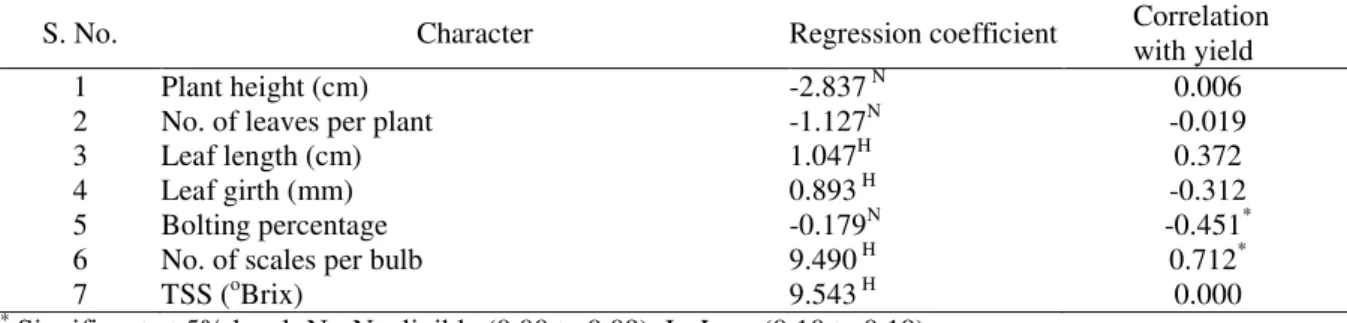
Correlation coefficient analysis of eight quantitative traits (Table 2) revealed strong association among growth and yield parameters of onion. Leaf length had positive significant correlation against number of scales per bulb (r=0.54), while it recorded negative significant correlation with leaf length (r= -0.88), bolting percentage (r= -0.63) and TSS (r= -0.40). Leaf girth had positively significant correlation for bolting percentage (r= 0.47) and negatively significant correlation with number of scales per bulb (r= -0.45). The bolting percentage had significant correlation with TSS (r=0.44), while it had significantly negative correlation with number of scales per bulb (r= -0.65) and bulb weight (r= - 0.45). Among all the traits under study, the number scales per bulb had high significant correlation with bulb weight per plant (r=0.71), while it was negatively correlated against TSS (r= -0.44). Of the seven independent quantitative traits studied for their direct effects on bulb weight per plant, the traits TSS (9.54) and number of scales per bulb (9.49) had positively high direct effect on bulb weight per plant followed by leaf length (1.04) and leaf girth (0.89). However, the traits plant height (-2.83), number of leaves per plant (-1.12) and bolting percentage (-0.17) had high negative direct effect on bulb weight per plant. From the result of the correlation coefficient analysis, it is evident that the character bolting percentage had strong negative correlation with bulb weight and number of scales per bulb had positive association with bulb weight suggesting that bulb weight could be improved by making selection on the basis of the afore said character, which is considered as major yield attribute in onion. The contribution of components of yield is through component compensation mechanism (Adams, 1967). The path coefficient study indicated that leaf length, leaf girth, number of scales per bulb and TSS (Hosamani et al., 2010) had positively high direct effect on bulb weight. However, Hyder et al. (2007) and Singh et al (2010) reported that plant height, bulb length, bulb diameter, days to harvest were the important traits contributing to bulb yield in onion. Significant genotypic correlation with bolting percentage and bulb yield implies that increase in bolters affect total yield (Ibrahim et al., 2013). There was indirect effect on bulb yield of each trait. High negative direct effect was exerted by plant height and number of leaves on bulb yield but was favourably influenced through leaf length, leaf girth, number of scales per bulb and TSS. Whereas, bolting percentage had low negative direct effect among all the traits studied.
striking variability among the onion germplasm may be attributed to genus Allium as diverse one (Abubakar and Ado, 2014). The biplot analysis revealed that accessions IC571904 and IC571935 found to be different and separate from remaining accessions with the traits TSS and number of leaves having contributed to their diversity and separation.
The dendrogram (Fig 2) enabled a relatively good comparison of different onion germplasm and resulted in formation four distinct clusters. The cluster I included two accessions IC571904 and IC571935 and cluster II also had two accessions
viz., IC571913 and IC564084.Cluster III was represented by sixteen accessions viz., IC 571921, IC 571922, IC 564076, IC 571924, IC 564063, IC 564059, IC 564069, IC 571985, Light Red, IC 564070, IC 564071, IC 564055, Nasik Red, White marglobe, IC 564058 and IC 564054.The cluster IV consisted of five accessions -IC 571919, IC 564056, IC 571959, IC 571927 and IC 564078. The mean bulb weights for cluster I, cluster II, cluster III and cluster IV were 88.09, 53.12, 106.78 and 152.29 g, respectively. The Hierarchical Cluster analysis deals number of different algorithms and methods for grouping samples of similar kind in to respective categories. It is an exploratory data analysis tool which aims at sorting different samples in to groups in a way that degree of association between two samples is maximal if they belong to the same group and minimal otherwise (Rusjan et al., 2008). The cluster analysis studies explain grouping of accessions into different clusters. The distribution of accessions in to different clusters was not based on similar geographical collection, which is similar to the findings of Kamala et al. (2011), thus ruling out geographical origin as a factor for and genetic divergence (Mallikarjun, et al., 2010). The cluster-I consisted of only two accessions IC571904 and IC571935, former with highest number of leaves per plant and the latter with highest bolting percentage and TSS. Such accessions tend to produce more economic dry matter per unit area (Ananthan and Balakrishnamoorthy, 2007).The accessions in cluster II viz. IC571913 and IC564084 were collected from Karimnagar district in Telangana region (Andhra Pradesh) representing dry inland climate with hot summer and cool winter and temperate climate (Koraput in Orissa) respectively. The cluster III has fourteen accessions and three controls which were the popular varieties in different states under varying agro-ecological conditions. The accessions from Cluster III and IV represents highly diverse climatic conditions varying from dry hot to sub humid as well as coastal to temperate climates. This suggests that the accessions from Cluster III and IV are suitable for utilization in breeding to evolve hybrids or varieties
adapted to diverse climate. Cluster IV included IC571919, IC564056, IC571959 and IC 571927 and IC564078 with lowest number of leaves per plant, leaf girth and number of scales per bulb respectively. The highest cluster mean was recorded by cluster IV followed by cluster III, cluster I and cluster II. Crossing programme involving genetically diverse lines has been effective for the development of novel hybrids with high heterosis in the desired direction (Mallikarjun
et al., 2010). As cluster IV has highest value for bulb weight (g), an important yield attributing trait as well represents highly diverse eco-geographical conditions, therefore hybridization of cluster IV with cluster-III would be beneficial with the advantage that cluster III has leading check varieties performing excellent in onion growing states of India under diverse season as well as climatic conditions.
There is need to identify trait specific diversity rich pockets and regions having gaps for bulb shape and bulb weight to undertake thorough exploration to collect highly divergent lines for yield and yield contributing traits as well as lines expressing resistance to biotic and abiotic stresses. The qualitative and quantitative data presented in the present study would be useful for plant breeders and gene bank curators, as the traits exhibited significant variability. Even though only twenty three lines were studied these may be effectively utilized in onion improvement and conservation efforts.
References
Abubakar, L. and Ado, S.G. 2014. Variability Pattern for Resistance to Purple Blotch (Alternaria porri ) Disease of Onions (Allium cepa L.) in North Western Nigeria. Nigerian J. Basic Appl. Sci.,21(2): 109-115.
Adams, M.W. 1967. Plant architecture and yield breeding, Iowa state J.Res., 56: 225-254. Ananthan, M. and Balakrishnamoorthy, G. 2007. Genetic
variability and correlation studies in onion (Allium cepa var. cepa L.) for economic dry matter yield. Agri. Sci. Digest,27(3): 190-193. Anil Khar, Lawande, K.E. and Negi, K.S. 2011.
Microsatellite marker based analysis of genetic diversity in short day tropical Indian onion and cross amplification in related Allium spp. Genet. Res. Crop Evol.,58(5):741–752 El-Aweel, M.A.T, Ghobashi, A.A. and El-Kafory, A.K
.2000. Yield potential and storability of some onion cultivars (Allium cepa, L.) in the Sultanate of Oman. J. Agric. Sci., 31: 89–100 Federer, W.T.1956. Augumented designs. Hawaian
Planters Record,40: 191-207.
Hooker, J.D. 1892. The Flora of British India. 23-A, Connaught Place, Dehra Dun, India 6: 337-345.
Hosamani, R.M. Patil, B.C and Ajjappalavara, P.S. 2010. Genetic variability and character association studies in onion (Allium cepa L.) Karnataka J. Agric. Sci.,23(2):302-305.
Hyder, H. Sharker, N.Ahmed, M.B. Hannan, M.M. Razvy, M.A., Hossain, M. Hoque, A. and Karim, R. 2007. Genetic variability and interrelationship in onion (Allium cepa L.). Middle-East J. Sci. Res., 2(3-4): 132-134. Ibrahim, B. G. Simon, S.Y. Bashir, L.U and Kadams,
A.M .2013. Inheritance studies of some quantitative traits in onion (Allium cepa L.). Int. J. Biosci.,3(4): 135-141
Jones, H. and Davis, G. 1944. Inbreeding and heterosis and their relation to the development of new varieties of onions. USDA Tech. Bull., No. 874. Kachroo, B.L. Sapru, B.L. Dhar, U. .1977. Flora of Ladak – an ecological and taxonomic appraisal. Bishen Singh and Mahindra Pal Singh, Dehra Dun.
Kamala, V. Amar Jeet Gupta, Sivaraj, N. Pandravada, S.R. Sunil, N. Varaprasad, K.S and Karthikeyan, S. Jain, S.K. Nayar, M.P. Sanjappa, M. 1989. Florae indicae enumeration monocotyledonae. Botanical Survey of India, Howrah, Calcutta, West Bengal, India, 435 pp Lawande, K.E. 2001. NRCOG Perspective Plan Vision–
2025. National Research Centre for Onion and Garlic. Rajgurunagar, Pune (Maharashtra), 45p.
Lawande, K.E. 2011. Diversity Analysis of Onion Germplasm Collections from Northern Telangana Region of Andhra Pradesh. Indian J. Plant Genet. Resour., 24(2): 163–171 Mallikarjun, D. Allolli, T.B, Hulihalli, U.K, Athani, S.I
.2010.Genetic diversity studies in kharif onion (Allium cepa var. cepa L.). Karnataka J. Agric. Sci.,23(5) : 811-812.
McCollum, G.D. 1976. Onion and allies, Allium (Liliaceae). In: Evolution of crop plants Simmonds, N.W. (Ed). Longman. London. pp. 186–190.
Melke, A. and Ravishankar, H. 2006. Variability and association among bulb yield and yield-related traits in onion (Allium cepa L.). Trop. Agric. (Trinidad),83(4): 112-119.
Monpara, B.A. Chhatrola, M.D. Golani, I.J. and Vaddoria, M.A. 2005. Evaluation of Onion Germplasm, Variability and trait relationship studies. National J. Plant Improv.,7(7) : 11-14. Polunin, O. Stainton, A. 1984. Flowers of the Himalaya.
Oxford University Press, New Delhi, India p.413–416.
Pramoda, H. P. and Gangaprasad, S. 2007. Biometrical basis of handling segregation population for improving productivity in onion (Allium cepa L.). J. Asian Hort., 3(4): 278-280.
Purseglove, J.W. 1972. Tropical crops: Monocotyledones. Longman. London. pp1- 245.
Rabinowitch, H.D. Currah, L. 2002. Allium crop science: recent advances. CABI Publishing, Wallingford, UK.
Rahman, M.A., Saha, S.R., Salam, M.A., Masum, A.S.M.H. and Chowdhury, S.S. 2002. Correlation and Path Coefficient Analysis in Onion (Allium cepa L.). Online J. Bio. Sci.,
2(8): 533-534.
Ren, J. McFerson, J. Kresovich, R.L.S and Lamboy, W.F. 1995. Identities and Relationships among Chinese Vegetable Brassicas as Determined by Random Amplified Polymorphic DNA Markers.J. Am. Soc. Hort. Sci., 120(3): 548-555.
Rouamba, A. Robert, T. Sarr, A. Ricroch, A. 1995. Multivariate analyses for evaluation of agronomic potentiality of onion landraces from West Africa. Genome,39:1128–1132.
Rusjan, D. Korosec-Koruza, Z. Veberic, R.2008. Primary and secondary metabolites related to the quality potential of table crape varieties (Vitis vinifera L.). European J. Hort. Sci., 73 124– 130.
Sangeeta, K. and Singh, S.P .2012. Bulb yield and nutrient uptake by onion as affected by weed control. Indian J. Horti.,69(4): 594-597 Shastri, J.L. 1995.Garuda Purana. In: Ancient Indian
tradition and mythology, JL Shastri, GP Bhatt, GV Tagare (Eds.), vol 12. Motilal Banarsidass Publishers, Delhi, p 30
Singh, D. 1997. Onion improvement in India. Acta Horticulturae (ISHS), 433: 75–81.
Singh, R.K. Dubey, B.K. Bhonde, S.R. and Gupta R.P .2010.Variability studies for some Quantitative characters in white onion (Allium Cepa L) Advance lines. Veg. Sci.,37(1) : 105-107 Smith, C. 2003. Genetic Analysis of Quercetin in Onion
(Allium cepa L.) ‘Laddy Raider’. Texas J.
Agri. Nat. Res., 16: 24 –28.
Srivastava, U. Mahajan, R.K.Gangopadhyay, K.K. Mahendra, S. and Dhillon, B.S.. 2001. Minimal Descriptors of AgriHorticultural Crops. Part II: Vegetable Crops. National Bureau of Plant Genetic Resources, Pus a Campus, New Delhi, pp. 262.
Stearn, W.T. 1947. The Alliums of British India (rev. JD Hookers list of 1892). Herbertia, 12:73–84 Stearn, W.T. 1960. Allium and Milula in the central and
eastern Himalaya. Bull Br. Mus. Nat. Hist (Bot), B2:159–191.
Van Der Meer, Q.P. and Van Bennekom, J.L. 1968. Research on pollen distribution in onion seed fields. Euphytica,17: 216–219.
Van Der Meer, Q.P. and Van Bennekom, J.L. 1972. Influence of the environment on the percentage of self-fertilisation in onions and some consequences for breeding. Euphytica, 21: 450- 453.
Table 1. Mean performance of onion germplasm for yield and yield components Accession
No.
Plant height
(cm)
No. of leaves per plant
Leaf length
(cm)
Leaf girth (mm)
Bolting percentage
No. of scales per bulb
TSS (oBrix)
Bulb weight (g)
IC 571904 54.20 11.60 48.04 16.18 5.00 11.50 10.84 91.24
IC 571913 43.60 9.20 40.04 10.89 0.00 12.33 9.54 44.64
IC 571919 55.80 9.60 50.04 15.96 0.00 12.60 7.32 149.53
IC 571921 50.00 8.20 47.78 9.82 0.00 12.40 11.20 90.69
IC 571922 49.00 7.80 44.38 10.66 0.00 12.80 9.84 107.72
IC 571924 51.60 7.40 46.98 14.68 0.00 11.60 10.20 99.27
IC 571927 61.00 7.20 55.58 17.36 0.00 14.40 8.64 152.32
IC 571935 48.20 10.20 43.58 13.68 11.00 13.00 12.20 84.95
IC 571959 60.60 9.20 54.38 14.38 0.00 14.40 6.92 179.13
IC 571985 55.20 7.20 41.31 11.00 0.00 12.00 9.68 79.32
IC 564063 49.40 7.80 45.91 12.62 0.00 13.20 7.92 117.99
IC 564069 53.40 8.40 42.71 12.88 0.00 12.40 9.76 120.97
IC 564070 59.00 7.40 53.68 12.45 0.00 11.80 8.36 87.55
IC 564071 55.10 7.80 52.88 13.07 0.00 13.00 7.88 111.69
IC 564054 52.60 6.80 53.08 11.33 0.00 10.60 8.76 96.63
IC 564076 50.60 8.60 47.71 12.34 0.00 14.60 9.76 106.46
IC 564078 59.20 7.60 53.91 17.01 0.00 13.60 10.48 109.52
IC 564055 55.20 8.20 53.31 14.63 0.00 13.20 8.56 109.81
IC 564084 43.40 10.00 39.31 10.96 0.00 11.00 10.76 61.60
IC 564085 49.00 6.40 42.91 11.16 0.00 11.20 7.36 71.72
IC 564056 60.60 8.40 49.51 12.35 0.00 12.50 7.50 170.97
IC 564058 54.20 6.60 49.51 10.85 0.00 12.60 8.06 104.86
IC 564059 52.40 7.80 46.31 13.24 0.00 12.00 7.96 127.97
Nasik Red (N-53) 56.21 8.31 51.80 13.36 0.14 12.46 7.43 135.94
Light Red 49.87 6.43 45.67 10.39 0.00 11.37 9.12 93.74
White Marglobe 56.61 8.49 50.46 13.11 0.00 12.36 9.47 117.98
Minmum 43.40 6.40 34.80 9.82 0.00 10.60 6.92 44.64
Maximum 61.00 11.60 55.80 17.36 11.00 14.60 12.20 179.13
Mean 53.31 8.18 48.00 12.94 0.62 12.50 9.06 108.62
CD (0.05) 9.50 2.73 6.00 3.20 - 3.10 3.38 87.27
CV (%)Error 6.72 13.55 4.67 9.99 - 9.86 14.96 28.90
CV(%)Phenotypic 9.00 15.13 9.22 16.14 - 8.18 15.24 28.84
Table 2. Association among growth and yield attributes of onion
Variable
Plant height
(cm)
No. of leaves per
plant
Leaf length
(cm)
Leaf girth (mm)
Bolting percentage
No. of scales per
bulb
TSS (oBrix)
Bulb weight
(g)
Plant height (cm) 1.000 -0.188 0.201 -0.308 -0.145 0.323 -0.099 0.006
No. of leaves per
plant 1.000 0.219 -0.219 -0.209 0.000 -0.108 -0.019
Leaf length (cm) 1.000 -0.886* -0.638* 0.548* -0.405* 0.372
Leaf girth (mm) 1.000 0.472* -0.457* 0.176 -0.312
Bolting percentage 1.000 -0.658* 0.444* -0.451*
No. of scales per
bulb 1.000 -0.448
*
0.712*
TSS (oBrix) 1.000 0.000
Bulb weight (g) 1.000
Table 3. Direct effects of various quantitative traits on bulb weight of onion
S. No. Character Regression coefficient Correlation
with yield
1 Plant height (cm) -2.837 N 0.006
2 No. of leaves per plant -1.127N -0.019
3 Leaf length (cm) 1.047H 0.372
4 Leaf girth (mm) 0.893 H -0.312
5 Bolting percentage -0.179N -0.451*
6 No. of scales per bulb 9.490 H 0.712*
7 TSS (oBrix) 9.543 H 0.000
*
Significant at 5% level; N= Negligible (0.00 to 0.09); L=Low (0.10 to 0.19); M= Moderate (0.20 to 0.29); H= High (≥0
Table 4. Principal component analysis (PCA) performed on eight traits for onion germplasm lines
Agro-economic trait Eigen vectors
PC1 PC2 PC3 PC4
Plant height (cm) 0.11454 0.60163 -0.72298 -0.29060
No. of leaves per plant 0.00002 -0.06478 -0.11164 0.46137
Leaf length (cm) 0.09357 0.76130 0.62117 0.10007
Leaf girth (mm) 0.03256 0.17825 -0.24373 0.74220
No. of scales per bulb 0.01724 0.01536 0.03367 0.15808
TSS (oBrix) -0.02448 -0.01572 -0.13264 0.34175