Obesity: Analysis of Expression and Polymorphisms
Neeraj K. Sharma, Kurt A. Langberg, Ashis K. Mondal, Swapan K. Das*
Section on Endocrinology and Metabolism, Department of Internal Medicine, Wake Forest School of Medicine, Winston-Salem, North Carolina, United States of America
Abstract
Recent studies have identified links between phospholipid composition and altered cellular functions in animal models of obesity, but the involvement of phospholipid biosynthesis genes in human obesity are not well understood. We analyzed the transcript of four phospholipid biosynthesis genes in adipose and muscle from 170 subjects. We examined publicly available genome-wide association data from the GIANT and MAGIC cohorts to investigate the association of SNPs in these genes with obesity and glucose homeostasis traits, respectively. Trait-associated SNPs were genotyped to evaluate their roles in regulating expression in adipose. In adipose tissue, expression of PEMT, PCYT1A, and PTDSS2 were positively correlated and PCYT2 was negatively correlated with percent fat mass and body mass index (BMI). Among the polymorphisms in these genes, SNP rs4646404 inPEMTshowed the strongest association (p = 3.07E-06) with waist-to-hip ratio (WHR) adjusted for BMI. The WHR-associated intronic SNP rs4646343 in the PEMT gene showed the strongest association with its expression in adipose. Allele ‘‘C’’ of this SNP was associated with higher WHR (p = 2.47E-05) and with higher expression (p = 4.10E-04). Our study shows that the expression ofPEMT gene is high in obese insulin-resistant subjects. Introniccis-regulatory polymorphisms may increase the genetic risk of obesity by modulatingPEMTexpression.
Citation:Sharma NK, Langberg KA, Mondal AK, Das SK (2013) Phospholipid Biosynthesis Genes and Susceptibility to Obesity: Analysis of Expression and Polymorphisms. PLoS ONE 8(5): e65303. doi:10.1371/journal.pone.0065303
Editor:Struan Frederick Airth Grant, The Children’s Hospital of Philadelphia, United States of America ReceivedMarch 12, 2013;AcceptedApril 25, 2013;PublishedMay 28, 2013
Copyright:ß2013 Sharma et al. This is an open-access article distributed under the terms of the Creative Commons Attribution License, which permits unrestricted use, distribution, and reproduction in any medium, provided the original author and source are credited.
Funding:This work was supported by grant R01 DK039311 from the National Institutes of Health/NIDDK. Clinical studies were supported by the General Clinical Research Center grant M01RR14288 from National Center for Research Resources, National Institutes of Health to the University of Arkansas for Medical Sciences. The funders had no role in study design, data collection and analysis, decision to publish, or preparation of the manuscript.
Competing Interests:The authors have declared that no competing interests exist. * E-mail: [email protected]
Introduction
Endoplasmic reticulum (ER) is the major site of protein and lipid biosynthesis in cells [1]. A recent proteomic analysis revealed a shift in ER function from protein to lipid synthesis and metabolism in obese mice compared to lean animals. Further analysis revealed an increase in the phosphatidylcholine/phos-phatidylethanolamine (PC/PE) ratio due to a shift in de novo
lipogenesis in the obese ER lipidome [2]. This derangement in the composition of phospholipids was caused by transcriptional modulation of genes involved in phospholipid biosynthesis and remodeling [2]. An increased PC/PE ratio in the hepatic ER membrane perturbed ER calcium retention and homeostasis (by modulating sarco-endoplasmic reticulum calcium ATPAse – SERCA activity) leading to compromised protein folding and ER stress [2]. We and others have shown that activation of chronic ER stress in adipose and liver plays an important role in the development of obesity and related metabolic sequelae in human subjects [3–5]. However, the molecular and genetic regulatory mechanisms that lead to activation of chronic ER stress in obesity are not well understood.
Interestingly, mRNA and protein levels of phosphatidyletha-nolamine N-methyltransferase (PEMT), an enzyme that catalyzes conversion of PE to PC, are markedly increased (,20 fold) in
3T3-L1 cells upon differentiation to adipocytes [6]. Thus,PEMTmay play an important role in biogenesis of adipocyte lipid droplets and thereby modulate fat mass in vivo. Compared to wild-type mice,
PEMT-deficient mice (Pemt -/-) are resistant to diet-induced
hypertrophy of adipocytes in white adipose tissue and are also protected against high fat diet-induced obesity and insulin resistance [7]. The ethanolamine-phosphate cytidylyltransferase 2 (PCYT2) gene is involved in synthesis of PE from diacylglycerol. Interestingly, mice deficient inPCYT2 (Pcyt2+/2) are obese and insulin resistant [8]. However, the role of these phospholipid biosynthesis and remodeling genes in human obesity is not well understood.
Given these considerations, we hypothesized that adipose and muscle tissue expression of genes in the ER phospholipid biosynthesis pathway will be associated with obesity and insulin resistance in humans, andcis- regulatory polymorphisms (eSNPs) may increase susceptibility to obesity and insulin resistance by modulating expression of these genes. To test our hypothesis, we analyzed expression of four major genes (PCYT1A,PCYT2,PEMT, andPTDSS2) involved in ER membrane phospholipid biosynthe-sis/remodeling in adipose and muscle from 170 individuals with a broad range of insulin sensitivity (SI) and body mass index (BMI)
Materials and Methods
Study subjects
Gene expression and effects of genotype on gene expression were studied in adipose and muscle tissue from 170 Caucasian or African American subjects recruited by advertisement. Subjects were in good general health, between 19–60 years of age, and had a body mass index (BMI) between 19 and 45 kg/m2. Detailed characteristics of the subjects in this study are described elsewhere [9]. All study participants provided written, informed consent under protocols originally approved by University of Arkansas for Medical Sciences (UAMS). Our current study was approved by Wake Forest School of Medicine Institutional Review Board (Protocol IRB00011083). Characteristics of the cohort are summarized inTable 1.
Clinical Methods
Genomic DNA was isolated from blood samples using a Puregene DNA extraction kit (Qiagen Inc., Valencia, CA). Needle biopsies of abdominal subcutaneous adipose tissue and vastus lateralis muscle of all subjects were obtained under fasting conditions, and insulin sensitivity of non-diabetic subjects were evaluated by an insulin modified frequently sampled intravenous glucose tolerance test (FSIVGT). Body fat was determined by dual X-ray absorptiometry (DXA) scans (Hologic QDR-4500). Biopsy samples were quick frozen in liquid nitrogen and stored at280uC for further use. The adipocyte fraction (AF) was separated from the stromal-vascular fraction (SVF) after collagenase digestion of freshly collected adipose biopsy samples, as described earlier [5]. Fresh tissue for AF and SVF separation was available only for a subset of 40 randomly selected non-diabetic subjects.
Laboratory measurements
Insulin was measured by the UAMS Clinical Research Center core laboratory using an immuno-chemiluminometric assay (Invitron Limited, Monmouth, UK formerly Molecular Light Technology, Wales, UK). Assays with,10% CV were used for the analysis. Plasma glucose was measured by using a glucose oxidase method at LabCorp, Inc. (Burlington, NC).
RNA extraction
Total RNA was isolated from whole adipose and adipocyte fractions using the RNAeasy Lipid Tissue Mini kit (Qiagen). Total RNA from the SVF of adipose was isolated using an RNAqueous
kit (Ambion, Inc., Austin, TX). RNA from muscle biopsies was isolated using an Ultrasoec RNA kit (Biotecx Laboratories, Inc., Houston, TX). The quantity and quality of the isolated total RNA samples were determined by ultraviolet spectrophotometry (Nanodrop, Thermo Scientific, Pittsburgh, PA) and electrophoresis (Experion nucleic acid analyzer, BioRad Laboratories, Inc., Hercules, CA), respectively.
Gene expression
A recent study by Fu et al in animal models identified an increase in the cellular PC/PE ratio as a mechanism proximal to the ER stress induction in obesity [2]. Transcription modulation of four genes involved in phospholipid biosynthesis and remodeling was the key factor for this increase in PC/PE ratio (Figure S1). Choline-phosphate cytidylyltransferase A (PCYT1A) and ethanol-amine-phosphate cytidylyltransferase 2 (PCYT2) genes are in-volved in synthesis of PC and PE, respectively, from diacylglycerol. Phosphatidylethanolamine N-methyltransferase (PEMT) catalyzes the conversion of PE to PC by a sequential methylation reaction [10], while phosphatidylserine synthase 2 (PTDSS2) converts PE to phosphatidylserine (PS). Thus, we analyzed expression of these genes in tissues relevant to obesity and related metabolic phenotypes.
Total RNA (1mg) was reverse transcribed using a Qiagen QuantiTect reverse transcription kit (Qiagen) following the manufacturer’s protocol, which includes a DNase digestion step to remove genomic DNA contamination. Transcripts were measured by quantitative real-time PCR using Power SYBR green chemistry (Applied Biosystems, Inc., Foster City, CA) and normalized either to the expression of human ribosomal protein, large P0 (RPLP0 or 36B4) gene (for adipose and AF), or to 18S ribosomal RNA (for muscle and SVF), similar to our published studies [11]. The standard curves were generated for absolute quantification using pooled cDNA from the samples assayed. Transcript-specific oligonucleotide primers for real-time PCR were designed to capture most known splice variants and amplicons spanned an intron (seetable S1for details). We have successfully generated expression data in adipose tissue of 155 subjects and in muscle of 160 subjects from our cohort.
Association of single nucleotide polymorphisms (SNPs) in phospholipid remodeling genes with obesity and glucose homeostasis traits
To investigate whether the SNPs in genes in phospholipid remodeling were associated with obesity and glucose homeostasis traits, we examined publicly accessible data from large genome-wide association (GWA) studies in Caucasian subjects. We used meta-analyses of association data for BMI and WHR adjusted for BMI from the GIANT (http://www.broadinstitute.org/ collaboration/giant/) consortium [12,13]. In GIANT, summary statistics (including p-values and direction of effect for alleles) for BMI were available from a meta-analysis of up to 123,866 nondiabetic Caucasian participants for the genes of interest, while summary statistics for WHR adjusted for BMI phenotype were available for up to 77,169 nondiabetic Caucasian individuals. Data for glucose homeostasis traits were taken from the MAGIC dataset (http://www.magicinvestigators.org) [14,15]. In MAGIC, fasting glucose and insulin resistance [homeostatic model assessment-insulin resistance (HOMA-IR)] data sets were generated by performing a meta-analysis of up to 21 genome-wide association studies in up to 46,186 nondiabetic Caucasian participants (summary statistics including effect allele, effect size and p-values were available). Two-hour glucose data sets were generated by a Table 1.Characteristics of study population.
N Mean±SD
Gender (M/F) 170 (74/96)
N (T2D/Non-diabetic) 170 (13/157)
Ethnicity (C/AA) 170 (123/47)
Age (yrs) 170 41.0610.4
WHR 167 0.9060.15
BMI (kg/m2) 170 29.565.8
PFAT 169 32.369.8
SI(61024.min21[mU/ml]21) * 136 3.762.2
*, Metabolic traits from FSIVGT evaluation of non-diabetic individuals. SI, insulin sensitivity index, Units are taken from MINMOD program. C, Caucasian; AA, African American; WHR, waist-to-hip ratio; BMI, body mass index; PFAT, percent of fat mass (measured by DEXA).
meta-analysis of nine genome-wide association studies in 15,234 nondiabetic Caucasian individuals.
We first examined the GIANT and MAGIC data for associations of SNPs within 62 kb of four genes that modulate phospholipids in subcutaneous adipose tissue. The GIANT and MAGIC datasets included summary statistics for 115–119 SNPs for these regions. Data for 115 SNPs were available for WHR and 2hr glucose traits; for other traits, data for 119 SNPs were available. We considered a p-value of #0.0004 as significant (considering multiple testing corrections for 119 SNPs in our study). We further expanded our search to6500 kb to identify any associations within the putativecis-regulatory region of these genes.
SNP selection and genotyping in expression cohort Resent studies have shown that complex trait-associated SNPs are enriched for regulatory SNPs (eSNPs) [16]. Thus, to gain more mechanistic insight, our next goal was to find out if trait-associated SNPs within these genes increases genetic predisposition to metabolic traits by modulating their expression. We found no significant associations ofPCYT1A,PCYT2, orPTDSS2SNPs with metabolic phenotypes in the GIANT and MAGIC data sets (at the p#0.0004 level). However, nine SNPs in PEMT showed significant associations (see Results). Thus, genotype vs. expression association was tested only for these SNPs in PEMT. Linkage disequilibrium between SNPs was evaluated by HaploView software [17] using genotyping data of CEU subjects from the HapMap project (http://hapmap.ncbi.nlm.nih.gov/). Three SNPs were selected to tag (r2.0.8) nine SNPs within 62 Kb of the
PEMTgene that were associated with WHR (adjusted for BMI). A coding non-synonymous SNP (rs7946) that showed a marginal association with WHR was also genotyped.
Genomic DNA isolated from total blood samples of individuals from our expression cohort was used for genotyping. Four SNPs were genotyped by Pyrosequencing (PSQ96, Qiagen Inc.; formerly Biotage, Sweden) using a modification of the manufac-turer’s protocol including a biotinylated universal primer. Details of genotyping assays are given intable S2.
Statistical analysis
We used the MINMOD Millennium program to analyze FSIVGT data to determine insulin sensitivity (SI) of non-diabetic
subjects [18]. Gene expression data and all skewed variables were normalized through logarithm transformation and used in all analyses. Partial correlation measures of obesity traits (BMI, WHR, and percent of fat mass) and insulin sensitivity (SI) with
gene expression were calculated after controlling for age, gender, and self-identified ethnicity [5]. Since BMI and SI are strongly
correlated, additional adjustments for BMI were also included to evaluate correlations between gene expression and SI.
Pre-computed p-values from the GIANT and MAGIC meta-analyses were used and queried using a Microsoft Access database to evaluate the association between SNPs in the four phospholipid remodeling genes and obesity and glucose homeostasis traits, respectively. Genotypic effects on gene expression were analyzed by one-way analysis of variance (ANOVA). Associations between genotype and gene expression were further evaluated by univariate analysis of variance using a general linear model (GLM) procedure, which includes age as a covariate and genotype, gender, and self-identified ethnicity as fixed factors [19]. All statistical analyses were implemented in SPSS v.13.0 (SPSS Inc., Chicago, IL). For gene expression analysis, we considered p,0.05 to be significant without correcting for multiple statistical tests,
based on our stronga priori hypothesis and the high correlation among tested traits.
Results
Expression of phospholipid remodeling genes in adipose tissue is correlated with adiposity
Expression of PCYT1A (r = 0.36, p = 1.0961025), PEMT
(r = 0.46, p = 9.5761029) and PTDSS2(r = 0.29, p = 4.7261024)
in adipose showed significant positive correlations, whilePCYT2
(r =20.30, p = 4.1561024) was negatively correlated with percent
of fat mass (PFAT) and BMI in 142 non-diabetic subjects (Table 2). These results remained consistent even after using our entire sample, which included both diabetic and non-diabetic subjects (N = 155, data not shown). Further examination in adipose tissue fractions from a subset of 40 non-diabetic subjects indicated that the correlation of PEMT with adiposity was conferred by adipocytes (r = 0.38, p = 0.02) but not by cells in the stromal vascular fraction (Table 2). We also noted that the average expression of PEMT in adipocyte fractions was higher (,2.5 Ct, t-test p = 1.1561029) than in stromal vascular fractions
of adipose tissue.
Table 2.Correlation of metabolic traits with expression of phospholipid biosynthesis genes in different tissues of non-diabetic subjects.
Tissue Gene BMI WHR PFAT SI SI*
Adipose N 142 138 142 131 131
PCYT2 r 20.34 20.18 20.30 0.34 0.25
p 3.60E-05 0.039 4.15E-04 7.15E-05 0.005
PCYT1A r 0.26 0.24 0.36 20.05 0.08
p 0.002 0.004 1.09E-05 0.571 0.383
PEMT r 0.43 0.37 0.46 20.33 20.19
p 1.12E-07 8.83E-06 9.57E-091.37E-04 0.029
PTDSS2 r 0.21 0.24 0.29 0.04 0.15
p 0.014 0.006 4.72E-04 0.675 0.094
Muscle N 147 143 147 127 127
PCYT2 r 20.12 20.11 20.12 0.28 0.26
p 0.16 0.18 0.15 0.002 0.005
PCYT1A r 20.03 0.04 0.04 0.15 0.14
p 0.75 0.63 0.67 0.10 0.12
PEMT r 20.01 20.04 20.02 0.16 0.17 p 0.92 0.67 0.80 0.07 0.06
PTDSS2 r 0.01 0.00 0.01 0.12 0.13
p 0.93 0.997 0.88 0.18 0.14
SVF N 40 39 40 37 37
PEMT r 20.13 0.26 0.05 20.03 20.11
p 0.44 0.13 0.76 0.88 0.54
Adipocyte N 39 38 39 36 36
PEMT r 0.37 0.57 0.38 20.34 20.19
p 0.024 3.68E-04 0.022 0.051 0.30
The FSIVGT-derived index of whole body insulin sensitivity (SI) was negatively correlated with expression of PEMT
(r =20.33, p = 1.3761024) and positively correlated withPCYT2
(r = 0.34, p = 7.1561025) in adipose. However, correlations of
PEMT and PCYT2 expression with SI were only marginally
significant after adjustment for BMI (Table 2). PCYT1A and
PTDSS2expression in adipose showed no significant correlations with SI.
Phospholipid remodeling genes in skeletal muscle tissue Average expression of PEMT was lower (,3.5Ct, t-test
p = 4.06610283) in skeletal muscle compared to subcutaneous adipose, and the other three genes tested in muscle showed similar levels of expression compared to adipose. Expression of these genes in muscle showed no significant correlation with expression in adipose tissue from the same subjects. Expression of these phospholipid remodeling genes in muscle was not correlated with obesity measures (Table 2). However,PCYT2expression in muscle was marginally correlated (r = 0.26, p = 0.005) with SI.
PEMT gene polymorphisms are associated with adiposity Interrogation of the meta-analysis data from the GIANT consortium identified 115 SNPs within 62 kb of the PTDSS2,
PEMT, and PCYT1A genes. None of these SNPs showed significant association at a genome-wide significance threshold (p,5.061028). However, at our overall significance threshold (p #0.0004), 9 SNPs inPEMTshowed significant associations with WHR adjusted for BMI (Figure S2). Further expansion of this search identified a locus in chromosome 17 significantly associated with WHR (adjusted for BMI). SNP rs4646404, located in an intron ofPEMT, showed the strongest association (p = 3.0761026, ‘‘G’’ allele associated with increased WHR in 77,158 Caucasian subjects) within6500 Kb of the gene (Figure S3). None of the SNPs within 62 Kb of these genes showed any evidence for association with BMI in the GIANT meta-analysis dataset at the p#0.00004 threshold. A similar search in meta-analysis data from the MAGIC consortium also identified no SNPs significantly associated with glucose homeostasis traits (including fasting plasma glucose and HOMA-IR in meta-analysis of 46,186 non-diabetic Caucasian subjects and 2 hr glucose tolerance in 15,234 subjects). No SNP association data were available for the 62 kb region around thePCYT2gene. However, no SNP reached significance in an expanded search within6500 kb region of this gene.
Adiposity-associated variants in the PEMT gene arecis -eSNPs
We further investigated if the WHR-associated SNPs (within
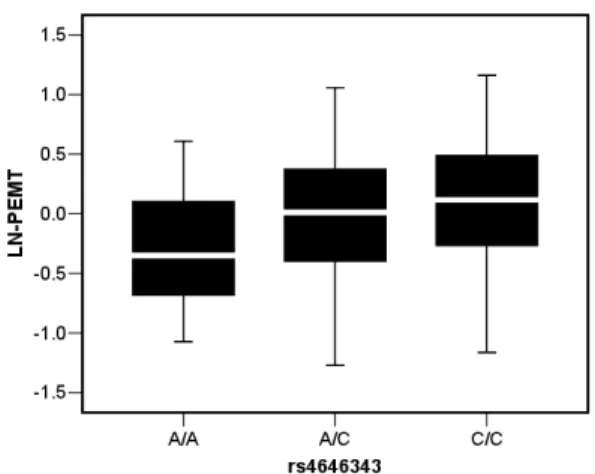
62 kb of PEMT gene) arecis-regulators in adipose tissue. In our cohort (N = 154), intronic SNP rs4646343 showed the strongest genotypic association (p = 9.1661024
) with expression of PEMT transcript (Table 3 and Figure 1). This association also remained significant (p = 4.1061024) in a non-diabetic Caucasian
subset (N = 101) of our cohort. The SNP rs4646404 that showed the strongest association with WHR in the GIANT dataset was marginally associated (p = 0.024–0.09) with PEMTexpression in adipose. We noticed that for all of these SNPs, alleles linked to increased WHR were associated with increased expression of PEMT.
Discussion
Studies by our laboratory and others have shown the induction of chronic ER stress in adipose tissue of obese subjects [3–5]. In concordance with recent animal studies [2], our study in human
subjects now shows the transcriptional upregulation of genes involved in PC biosynthesis (includingPEMT) and downregulation of thePCYT2 gene, involved in PE biosynthesis, in the adipose tissue of obese subjects. Although we have not measured tissue phospholipid levels, the transcriptional profile of four genes indicates a possible increase in PC/PE ratio in adipose and may be a mechanism behind the perturbation of ER homeostasis and induction of ER stress. In our study, induction ofPEMTin obesity was limited to adipocytes, and was not seen in muscle or cells in the SVF of adipose. Thus, similar to rodent models [6,7,20], induction of PEMT may also be mechanistically involved in stabilization of lipid droplets and hypertrophy of adipocytes in obese human subjects.
We attempted to elucidate the function of four phospholipid biosynthesis genes in obesity and related traits by combining phenotype, gene expression in tissues important for obesity, and genotype data in a metabolically well-characterized cohort. Integration of publicly available genome-wide association (GWA) findings with our study significantly expedited our search to identify functional polymorphisms that increase susceptibility to obesity by modulating expression at the transcript level. However, a notable limitation of our study is that we used only adipose and muscle samples. As noted previously, phospholipid remodeling in hepatic ER was the focus of a rodent model study [2]. Expression of PC/PE remodeling genes, including PEMT, is higher in liver [20] than in adipose and may be more predictive of obesity.
Although dietary and lifestyle risk factors play important roles, the contribution of genetic susceptibility to obesity is well established. Recent GWA studies have identified several suscep-tibility loci for obesity [12,13], but few loci have been linked to a molecular mechanism. The GIANT consortium identified 16 associated (p,1.461026) loci using a fixed effect meta-analysis of WHR from 77,167 subjects from 32 studies, employing study-specific linear regression adjusted for BMI and age, stratified by gender, and using an additive genetic model [12]. No SNPs in cellular phospholipid metabolism loci were reported by that study. The multiple testing corrections utilized in genome-wide statistical analysis allows detection of only the strongest effects and penalize weaker associations that may be biologically meaningful [21,22]. Figure 1. Genotypic association of SNP rs4646343 with PEMT expression in subcutaneous adipose. The box plot shows transcript level expression of PEMT for different genotypes (AA, n = 26; AC, n = 59 and CC, n = 69). PEMT expression is shown after 36B4 normalization and ln transformation. The box represents the interquartile range, which contains 50% of the values. The whiskers are lines that extend the box to the highest and lowest values, excluding outliers. A line across the box indicates the median.
In a focused search for genetic association of polymorphisms in phospholipid modulating genes, we identified an association of the
PEMTpolymorphism with WHR adjusted for BMI in the GIANT consortium dataset. The strongest association p-value (p = 3.076026) for WHR within6500 Kb of thePEMT gene is below the threshold and thus was not reported by GIANT consortium. Prioritizing genes that are causally involved with susceptibility to obesity may thus be helpful in identifying additional genetic susceptibility loci from GWA studies.
BMI is the most commonly used index to characterize obesity, but is known to be of limited accuracy in estimating adiposity [23]. In our study,PEMTexpression in adipose was a more significant predictor of percent of fat mass compared to BMI. Polymorphisms inPEMTare not associated with BMI, but were associated with WHR adjusted for BMI, indicating this gene’s role in body fat distribution rather than overall adiposity. These polymorphisms were also associated with transcript-level expression ofPEMTin adipose tissue. Analysis of publicly available adipose tissueeQTL data also confirmed this association (Figure S4). Intriguingly, the same allele of the intronic SNP rs4646343 is associated with higher expression of PEMT in adipose and higher WHR. Thus, our study suggests an important role forcis-regulatory SNPs in modulating
PEMT expression, which in turn may increase genetic suscepti-bility to obesity by altering phospholipid composition and inducing ER stress in adipocytes.
Supporting Information
Figure S1 Phosphatidylcholine (PC) and Phosphatidyl-ethanolamine (PE) biosynthesis and remodeling. (modi-fied from Fu Set al., 2011, Nature, 473:528–531).
(PDF)
Figure S2 Linkage Disequilibrium among SNPs in
PEMT gene. Top graph also indicates association of PEMT SNPs with WHR (adjusted for BMI) in Caucasian subjects from the GIANT consortium.
(PDF)
Figure S3 SNPs in PEMT gene region (±500 Kb) are associated with waist-to-hip ratio (WHR) adjusted for
BMI. Data represents a meta-analysis of 77158 Caucasian subjects from the GIANT consortium.
(PDF)
Figure S4 Association of PEMT expression with local SNP genotype in MuTHER consortium-TwinUK data set. A) Expression of PEMT (Illumina expression probe ILMN_1745806) in adipose is associated with local regulatory SNPs and association peaks within the intron of PEMT. Association of 540 SNPs within 6500 Kb of PEMT gene is shown (Data downloaded from Genevar database; Grundberg E et al, Nature genetics 2012; 44:1084-9). B) WHR associated intronic SNP rs4646343 is an adipose tissue specificcis-regulator forPEMT
and not for any other gene within 6500 Kb. A, adipose; L, transformed lymphocyte; S, skin fibroblast.
(PDF)
Table S1 Primer sequences for quantitative real time PCR (qRT-PCR) assays.
(PDF)
Table S2 Primer sequences for genotyping by pyrose-quencing.
(PDF)
Acknowledgments
The authors are grateful to GIANT, MAGIC, MuTHER and HapMap Project investigators for generously making their genetic association, expression, and genotyping data publicly available. We thank the late Steven C. Elbein, MD for recruitment and metabolic characterization of the study subjects analyzed in this study. We also thank Karen Klein (Office of Research, Wake Forest University Health Sciences) for critical reading and editing of our manuscript.
Author Contributions
Conceived and designed the experiments: SKD. Performed the experi-ments: NKS KAL AKM. Analyzed the data: SKD NKS. Contributed reagents/materials/analysis tools: NKS SKD AKM KAL. Wrote the paper: SKD NKS KAL.
Table 3.WHR-associated SNPs inPEMTmodulate its transcript level expression in subcutaneous adipose tissue.
All
(N = 154) Caucasian non diabetics (N = 101)
SNP
Location
(hg19) Annotation Allele1*
WHR* P-value
Genotype
count Allele1* P Padj Genotype count P Padj
s7946 7409560 missense G 0.016 AA/AG/GG G 0.151 0.16 AA/AG/GG 0.023 0.080
V 175 M 64/74/16 53/45/3
s4646404 17420199 intron G 3.07E-06 GG/AG/AA G 0.053 0.09 GG/AG/AA 0.024 0.068
97/44/12 54/35/11
s897453 17425631 missense C 6.00E-05 CC/TC/TT C 0.016 0.008 CC/TC/TT 0.010 0.009
V 58 I 77/55/21 39/42/20
s4646343 17492077 intron C 2.47E-05 CC/AC/AA C 0.004 9.16E-04 CC/AC/AA 6.21E-04 4.10E-04
69/59/26 37/42/22
*, Allele 1, Trait increasing allele; P, ANOVA P-value for transcript expression level; P adj, statistical significance of genotypic association from univariate analysis of variance using a general linear model (GLM) procedure that included age as covariates and genotype, gender, ethnicity as fixed factors; WHR P-value, P-value for WHR adjusted for BMI as in GIANT data.
References
1. Walter P, Ron D (2011) The unfolded protein response: from stress pathway to homeostatic regulation. Science 334: 1081–1086.
2. Fu S, Yang L, Li P, Hofmann O, Dicker L, et al. (2011) Aberrant lipid metabolism disrupts calcium homeostasis causing liver endoplasmic reticulum stress in obesity. Nature 473: 528–531.
3. Boden G, Duan X, Homko C, Molina EJ, Song W, et al. (2008) Increase in endoplasmic reticulum stress-related proteins and genes in adipose tissue of obese, insulin-resistant individuals. Diabetes 57: 2438–2444.
4. Gregor MF, Yang L, Fabbrini E, Mohammed BS, Eagon JC, et al. (2009) Endoplasmic reticulum stress is reduced in tissues of obese subjects after weight loss. Diabetes 58: 693–700.
5. Sharma NK, Das SK, Mondal AK, Hackney OG, Chu WS, et al. (2008) Endoplasmic reticulum stress markers are associated with obesity in nondiabetic subjects. J Clin Endocrinol Metab 93: 4532–4541.
6. Horl G, Wagner A, Cole LK, Malli R, Reicher H, et al. (2011) Sequential synthesis and methylation of phosphatidylethanolamine promote lipid droplet biosynthesis and stability in tissue culture and in vivo. J Biol Chem 286: 17338– 17350.
7. Jacobs RL, Zhao Y, Koonen DP, Sletten T, Su B, et al. (2010) Impaired de novo choline synthesis explains why phosphatidylethanolamine N-methyltransferase-deficient mice are protected from diet-induced obesity. J Biol Chem 285: 22403– 22413.
8. Singh RK, Fullerton MD, Vine D, Bakovic M (2012) Mechanism of hypertriglyceridemia in CTP:phosphoethanolamine cytidylyltransferase-defi-cient mice. J Lipid Res 53: 1811–1822.
9. Sharma NK, Langberg KA, Mondal AK, Elbein SC, Das SK (2011) Type 2 diabetes (T2D) associated polymorphisms regulate expression of adjacent transcripts in transformed lymphocytes, adipose, and muscle from Caucasian and African-American subjects. J Clin Endocrinol Metab 96: E394–E403. 10. Cole LK, Vance JE, Vance DE (2012) Phosphatidylcholine biosynthesis and
lipoprotein metabolism. Biochim Biophys Acta 1821: 754–761.
11. Das SK, Sharma NK, Hasstedt SJ, Mondal AK, Ma L, et al. (2011) An integrative genomics approach identifies activation of thioredoxin/thioredoxin reductase-1-mediated oxidative stress defense pathway and inhibition of angiogenesis in obese nondiabetic human subjects. J Clin Endocrinol Metab 96: E1308–E1313.
12. Heid IM, Jackson AU, Randall JC, Winkler TW, Qi L, et al. (2010) Meta-analysis identifies 13 new loci associated with waist-hip ratio and reveals sexual dimorphism in the genetic basis of fat distribution. Nat Genet 42: 949–960. 13. Speliotes EK, Willer CJ, Berndt SI, Monda KL, Thorleifsson G, et al. (2010)
Association analyses of 249,796 individuals reveal 18 new loci associated with body mass index. Nat Genet 42: 937–948.
14. Dupuis J, Langenberg C, Prokopenko I, Saxena R, Soranzo N, et al. (2010) New genetic loci implicated in fasting glucose homeostasis and their impact on type 2 diabetes risk. Nat Genet 42: 105–116.
15. Saxena R, Hivert MF, Langenberg C, Tanaka T, Pankow JS, et al. (2010) Genetic variation in GIPR influences the glucose and insulin responses to an oral glucose challenge. Nat Genet 42: 142–148.
16. Nicolae DL, Gamazon E, Zhang W, Duan S, Dolan ME, et al. (2010) Trait-associated SNPs are more likely to be eQTLs: annotation to enhance discovery from GWAS. PLoS Genet 6: e1000888.
17. Barrett JC, Fry B, Maller J, Daly MJ (2005) Haploview: analysis and visualization of LD and haplotype maps. Bioinformatics 21: 263–265. 18. Boston RC, Stefanovski D, Moate PJ, Sumner AE, Watanabe RM, et al. (2003)
MINMOD Millennium: a computer program to calculate glucose effectiveness and insulin sensitivity from the frequently sampled intravenous glucose tolerance test. Diabetes Technol Ther 5: 1003–1015.
19. Elbein SC, Chu WS, Das SK, Yao-Borengasser A, Hasstedt SJ, et al. (2007) Transcription factor 7-like 2 polymorphisms and type 2 diabetes, glucose homeostasis traits and gene expression in US participants of European and African descent. Diabetologia 50: 1621–1630.
20. Vance DE (2013) Physiological roles of phosphatidylethanolamine N-methyl-transferase. Biochim Biophys Acta 1831: 626–632.
21. Naukkarinen J, Surakka I, Pietilainen KH, Rissanen A, Salomaa V, et al. (2010) Use of genome-wide expression data to mine the ‘‘Gray Zone’’ of GWA studies leads to novel candidate obesity genes. PLoS Genet 6: e1000976.
22. Parikh H, Lyssenko V, Groop LC (2009) Prioritizing genes for follow-up from genome wide association studies using information on gene expression in tissues relevant for type 2 diabetes mellitus. BMC Med Genomics 2:72.