www.atmos-chem-phys.net/9/2319/2009/ © Author(s) 2009. This work is distributed under the Creative Commons Attribution 3.0 License.
Chemistry
and Physics
Modelling of cirrus clouds – Part 2: Competition of different
nucleation mechanisms
P. Spichtinger1and K. M. Gierens2
1Institute for Atmospheric and Climate Science, ETH Zurich, 8092 Zurich, Switzerland
2Deutsches Zentrum f¨ur Luft- und Raumfahrt, Institut f¨ur Physik der Atmosph¨are, Oberpfaffenhofen, Germany
Received: 4 March 2008 – Published in Atmos. Chem. Phys. Discuss.: 20 May 2008 Revised: 4 November 2008 – Accepted: 24 March 2009 – Published: 1 April 2009
Abstract. We study the competition of two different
freez-ing mechanisms (homogeneous and heterogeneous freezfreez-ing) in the same environment for cold cirrus clouds. To this goal we use the recently developed and validated ice micro-physics scheme (Spichtinger and Gierens, 2009a) which dis-tinguishes between ice classes according to their formation process. We investigate cases with purely homogeneous ice formation and compare them with cases where background ice nuclei in varying concentration heterogeneously form ice prior to homogeneous nucleation. We perform additionally a couple of sensitivity studies regarding threshold humidity for heterogeneous freezing, uplift speed, and ambient tem-perature, and we study the influence of random motions in-duced by temperature fluctuations in the clouds. We find three types of cloud evolution, homogeneously dominated, heterogeneously dominated, and a mixed type where neither nucleation process dominates. The latter case is prone to long–lasting in–cloud ice supersaturation of the order 30% and more.
1 Introduction
Cirrus clouds are like other clouds important modulators of the radiation budget of the Earth–atmosphere system. How-ever, the mean impact of cirrus on Earth’s climate is still un-clear, although a net warming seems probable (Chen et al., 2000). A recent study (Fusina et al., 2007) on the radiative impact of thin midlatitude cirrus clouds shows that the tran-sition from a net warming to a net cooling depends crucially on the number density of ice crystals, which in turn depends
Correspondence to:P. Spichtinger ([email protected])
sensitively on cooling rates (Haag and K¨archer, 2004) and the ice crystal formation mechanism.
There are two classes of ice formation mechanisms in the low temperature range (T <−38◦
C), namely heterogeneous nucleation and homogeneous freezing of solution droplets (for a definition of these notions see Vali, 1985; Koop , 2004). While homogeneous freezing requires ice supersaturation in excess of 45% (Koop et al., 2000), many kinds of heteroge-nous ice nuclei allow ice generation at lower supersatura-tion thresholds (see e.g. DeMott et al., 2003; M¨ohler et al., 2006). However, suitable ice nuclei are rare in the upper tro-posphere, so that it is generally believed that homogeneous nucleation is the dominant pathway for formation of cold cir-rus clouds (Sassen and Dodd, 1989; Heymsfield and Sabin, 1989; K¨archer and Str¨om, 2003). While this may be so, sim-ulations indicate that heterogeneous nucleation can influence the formation of cirrus clouds significantly (Sassen and Ben-son, 2000; Khvorostyanov and Curry, 2005; DeMott et al., 1997). Box model studies (Gierens, 2003; Ren and Macken-zie, 2005; Liu and Penner, 2005) even suggest that hetero-geneous nucleation can suppress homohetero-geneous nucleation if enough heterogeneous ice nuclei are available, depending on environmental conditions, and if the vertical velocity is suf-ficiently small. Of course, the box model results might be extreme in a sense, because sedimentation is not represented and both nucleation mechanisms are assumed to occur in the same air parcel. This might be different in an extended cir-rus cloud, which is the reason that we intend to study the competition of the two ice formation mechanisms in a cloud resolving model.
simulations of idealistic cases, which nevertheless are repre-sentative for mid latitude cirrus cloud formation. A similar study by Khvorostyanov et al. (2006) was focussed on thin tropical cirrus clouds.
The article is structured as follows: In Sect. 2 we briefly describe our model, for more details we refer to Part 1a. In Sect. 3 we present the general setup for our simulations. Re-sults of reference cases and sensitivity studies are presented and discussed in Sect. 4. Finally, conclusions are drawn in Sect. 5.
2 Model description
We now briefly describe the model used in this study, for details we refer to Part 1a and the quoted references. We use the anelastic non–hydrostatic model EULAG (see e.g. Smolarkiewicz and Margolin, 1997); the dry anelastic equa-tions solved in the model are presented in Smolarkiewicz et al. (2001); Grabowski and Smolarkiewicz (2002) and Part 1a. For coupling the dry equations with the ice micro-physics, i.e. the moist thermodynamics, we use the concept of the density potential temperature see e.g. Emanuel (1994); Grabowski and Smolarkiewicz (2002) and Part 1a. This leads to new equations (Eqs. 5 and 6 in Part 1a) which are solved by the model.
We use a two-moment bulk microphysics scheme, i.e. number and mass concentrations are prognostic variables. Crystal masses (and sizes) are assumed to obey lognormal distributions with temporally varying mean mass and width. Crystal shapes are droxtals (aspect ratio 1) up to a diame-ter of 7.42µm and columns with size dependent aspect ra-tio for larger sizes. An arbitrary number of ice classes can be treated by the scheme. Each ice class is assigned to an aerosol type that nucleates the ice class, hence ice classes are distinguished by their formation mechanism (e.g. het-erogeneously vs. homogeneously formed ice). The aerosol types are described by their number and mass concentration as well.
The following processes for cold cirrus clouds are pa-rameterized in our ice microphysics: nucleation (homoge-neous/heterogeneous), diffusional growth/evaporation, and sedimentation. We have not included aggregation of ice crys-tals yet, which is a process of minor importance in cold cir-rus clouds (T <−38◦C) where small ice crystals with low terminal velocities predominate (Kajikawa and Heymsfield, 1989). For the parameterisation of homogeneous freezing of aqueous solution droplets we assume sulphuric acid solu-tion droplets as the background aerosol with lognormally dis-tributed mass of the acid (the water content is computed with the Koehler equation). Freezing rates are calculated using the water activity based, temperature dependent parametrization of Koop et al. (2000). Heterogeneous nucleation needs the presence of solid particle surfaces on which the ice germs can form. There are a number of different mechanisms, but for
our purpose these details are unimportant, since our question is: what happens to homogeneous nucleation and the cloud evolution when a number of ice crystals is already formed by any mechanism at a lower relative humidity threshold. For this purpose we can apply a very simple parameterisation: We assume that there is a special aerosol type that nucle-ates into ice at a certain relative humidity RHihet, that is, at
RHihetall particles of that aerosol type become ice crystals
of the corresponding class. Eventually, upon evaporation of these crystals the aerosol particles are released back to the at-mosphere. In principle we can prescribe any form of hetero-geneous nucleation behaviour. But any other than a simple threshold would introduce more degrees of freedom which would render the interpretation of the results more compli-cated. Therefore, for the present paper we do not intend to in-vestigate more complex heterogeneous nucleation behaviour. For parameterising the diffusional growth or evaporation of single ice crystals we use a modified Koenig ansatz (Koenig, 1971) with corrections for small crystals and venti-lation. We assume a mass deposition coefficient of 0.5 for all crystal classes. The new approximation depending on ice crystal mass, temperature and pressure only, allows us to determine the growth rate very accurately without solv-ing the growth equation. This approach is applied to the bulk variable, i.e. the ice water content. For the evaporation of ice crystals, both the ice mass concentration and number concentration decrease in relative proportion as described in Part 1a. To simulate sedimentation we use mass and num-ber weighted terminal velocities, respectively, with parame-terisations for single crystals from Heymsfield and Iaquinta (2000).
3 Setup
We use the following setup for our simulations: The whole 2-D model domain (0≤x≤6.3 km, 4≤z≤13 km) is lifted up adiabatically with a constant updraught velocitywwhich is equivalent to a constant cooling rate dT /dt for the back-ground temperature profile Te. For the reference case we
use w=0.06 m s−1, for sensitivity studies we set this
vari-able tow=0.04,0.08 m s−1. We use a horizontal resolution
of1x=100 m with a horizontal extension of 6.3 km, cyclic boundary conditions in x–direction, a vertical resolution of 1z=10 m and a dynamical timestep of1t=1 s. According
to our findings in Part 1a this time step is sufficient because of the small vertical velocities. The total simulation time is ts=300 min for all simulations which is at the lower end of
the synoptic range. The maximum vertical uplift of a layer in our simulation would be 1z=5·3600 s·0.08 m s−1=1440 m
which is a reasonable value comparable to the typical up-lift, e.g. in a warm conveyor belt (see e.g. Spichtinger et al., 2005).
6000 6500 7000 7500 8000 8500 9000 9500 10000 10500 11000 11500 12000
150 200 250 300 350 400 450 500
altitude (m)
pressure (hPa) initial p
ISSR
6000 6500 7000 7500 8000 8500 9000 9500 10000 10500 11000 11500 12000
200 210 220 230 240 250
altitude (m)
temperature (K) initial T
ISSR
6000 6500 7000 7500 8000 8500 9000 9500 10000 10500 11000 11500 12000
305 310 315 320 325
altitude (m)
potential temperature (K) initial theta
ISSR
6000 6500 7000 7500 8000 8500 9000 9500 10000 10500 11000 11500 12000
0 20 40 60 80 100 120
altitude (m)
relative humidity wrt ice (%) initial RHi
ISSR
Fig. 1.Initial vertical profiles for the reference case of pressure, temperature, potential temperature and relative humidity with respect to ice (from left to right).
homogeneous nucleation (class 1) and one formed by het-erogeneous nucleation (class 2). The background aerosol of class 1, sulphuric acid solution, is assumed to have a lognormal size distribution (size of the pure acid when it would form a sphere) with a geometrical standard deviation ofσr=1.4, a geometric mean radius ofra=25 nm and a
num-ber concentration ofna,1=Na,1ρ=300 cm−3. For all
simula-tions in this study we use this setup for the aerosol of class 1. The background aerosol of class 2 varies by number con-centration and by its threshold supersaturation for ice initi-ation since these are the ingredients of our sensitivity stud-ies. Since all aerosol particles form ice at one and the same RHi, their size distribution is not specified for these simu-lations. New ice crystals are assumed to have initial mass of m=10−15kg, which is equivalent to an initial diameter
of L=D=1.2µm. We vary the IN number concentrations in the rangena,2=0/2/5/8/10/20/50 L−1. The relative
hu-midity threshold is set to RHihet=130% in the reference
case; sensitivity studies will be performed with thresholds 110≤RHihet≤140%.
In Fig. 1 the initial vertical profiles of the meteorological variables for the reference simulation are shown.
The vertical profiles of potential temperature have been determined by Clark and Farley (1984) such that a con-stant Brunt–Vaisala frequency ofN=0.0094 s−1 results for
the whole model domain; this results into an almost lin-ear temperature profile. The initial vertical profiles of pres-sure, temperature and potential temperature are the same for all simulations. In the upper part of the model domain we prescribe an ice supersaturated region (ISSR, Gierens et al., 1999) with RHi=105% and a vertical depth of 1z=1 km. This depth is on the lower end of typical vertical exten-sions for cirrus clouds (see e.g. Mace et al., 2006) but is still in the typical range for an extratropical cirrus cloud and an ice supersaturated layer (Spichtinger et al., 2003). For the reference cases the layer is located between 9.5 km and 10.5 km, while for sensitivity studies we also consider
a higher (10.5≤zISSR≤11.5 km), hence colder, and a lower,
hence warmer, layer (8.5≤zISSR≤9.5 km).
4 Discussion of results
We first describe the results of the reference cases, which have constant vertical updraught of w=0.06 m s−1 without
fluctuations (making the simulation quasi 1-D). The ISSR initially covers the vertical range 9500≤z≤10 500 m. The background aerosol concentration (heterogeneous IN) is var-ied in the range na,2=0/2/5/8/10/20/50 L−1. Then we
study several sensitivities, e.g. using ISSRs at different al-titudes or temperatures (Sect. 4.4), using different updraught velocities (Sect. 4.3), using different thresholds for heteroge-neous nucleation (Sect. 4.2) and finally using full 2-D simu-lations with temperature (and velocity) fluctuations superim-posed (Sect. 4.5).
4.1 Reference experiments
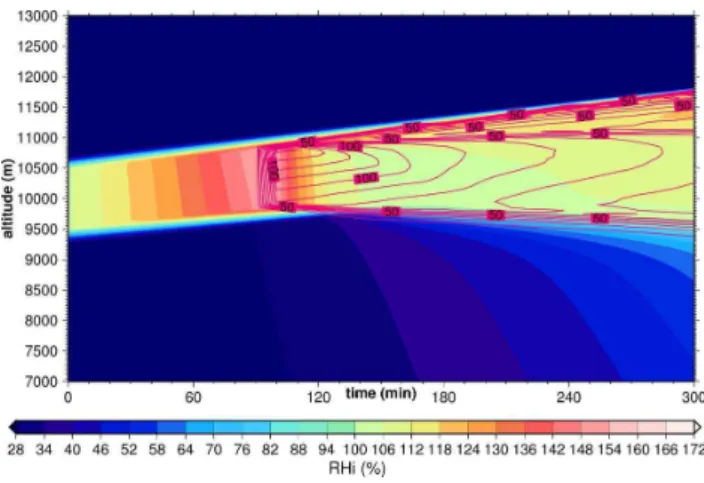
Figure 2 shows the evolution of a cirrus cloud when it is un-affected by heterogeneous ice nuclei, that is, when only ho-mogeneous nucleation occurs.
The cloud appears almost simultaneously throughout the depth of the ISSR atts∼100 min. Due to the growth of the ice crystals excess vapour within the cloud is consumed quickly, and the supersaturation gets reduced close to saturation at about ts=130 min. Sedimentation together with the
Fig. 2.Time evolution of the relative humidity wrt ice and ice
crys-tal number densities (purple isolines, in 10L−1steps) in the
refer-ence cirrus withw=0.06 m s−1and only homogeneous nucleation.
When heterogeneous ice nuclei are present in the ISSR, cloud evolution changes significantly. Now, the first crys-tals form by heterogeneous nucleation atts∼60 min. These ice crystals find a highly supersaturated environment with much less competition for the excess vapour than ice crys-tals formed homogeneously, because of the low number con-centration of IN. Thus they rapidly grow and start to fall which causes a vertical concentration gradient of ice in the ISSR, i.e. more ice at ISSR base than at its top. Thus the rate at which excess vapour is consumed due to ice growth decreases with altitude in the ISSR and the originally rectan-gular humidity profile gets more and more tilted with values increasing with altitude before homogeneous nucleation sets in. The tilting is additionally supported by the temperature dependent growth of ice crystals. The change of the RHi profile is the stronger the more IN are present (see Fig. 3) and it affects the homogeneous nucleation event and the later cloud evolution. While homogeneous nucleation takes place over the whole depth of the ISSR when no IN are present, the inclusion of more and more IN confines the region where ho-mogeneous nucleation can occur more and more to the cloud top.
Figure 4 shows the evolution of the cloud with varying numbers of IN; it can be compared to Fig. 2 which shows the case without IN. An IN number concentration ofna,2=5 L−1
does not yet affect much the structure of the cirrus; the het-erogeneously formed ice crystals are not sufficient to halt the increase of supersaturation within the cloud. Hence homo-geneous nucleation still occurs throughout the supersaturated layer, but with a delay of about 30 min between cloud top and base, as explained above. Enough ice crystals form homoge-neously to reduce the relative humidity almost to saturation. The steady state relative humidity wrt ice inside the cloud at ts=180 min is slightly higher (∼110%) in this case than in
the case without heterogeneous ice nuclei (∼105%), because slightly less ice crystals are produced (homogeneously) in
9500 10000 10500 11000
80 90 100 110 120 130 140 150 160
altitude (m)
relative humidity wrt ice (%) ref. case Na,2=0 L-1
Na,2=2 L-1 Na,2=5 L-1 Na,2=10 L-1 Na,2=20 L-1 Na,2=50 L-1
Fig. 3. Modification of the RHi profile due to different ice nuclei
concentrations at simulation timet=90 min (just before
homoge-neous nucleation starts).
this case than in the case without IN. The slight reduction of the number of homogeneously formed crystals is a con-sequence of the reduced rate at which supersaturation in-creases at the nucleation threshold. This implies a smaller overshooting of RHi over the threshold, hence less ice crys-tals. (Although the notion overshooting implies the whole RHi(t )during the period when RHi>RHihom, the main
ef-fect on the number of ice crystals produced is that the peak supersaturation is reduced when the overshooting is weaker). By further increasing the IN concentration to 10 L−1,
more ice crystals are formed heterogeneously which con-sume more vapour than in the preceeding case. Accord-ingly, the rate at which supersaturation increases further in the cloud is lower than before, such that the overshooting over the homogeneous threshold is flattened, and homoge-neous nucleation produces less crystals. Because the con-centration of heterogeneously formed crystals increases with depth in the cloud due to sedimentation, the increase of su-persaturation in the lower half of the cloud is inhibited so much that the threshold for homogeneous freezing is not reached anymore. Hence homogeneous nucleation is con-fined to the upper half of the cloud. Although the concentra-tion of heterogeneous ice crystals is high enough to inhibit homogeneous nucleation in the lower part of the cloud, it is not sufficient to deplete the excess vapour down to satura-tion at the cloud bottom, also because these crystals quickly fall out of the supersaturated layer. In contrast, homogeneous nucleation in the upper cloud part still produces a sufficient number of crystals that effectively use up the excess vapour. Hence the cloud obtains a two–layer structure with high ice number density and RHi close to saturation in the upper layer and low ice number density but persistent supersaturation in the lower layer. The persistent supersaturation is only de-pleted later (after, say, 4 h) when enough homogeneously formed ice crystals have fallen into the lower layer where they take up the excess vapour.
Progressing to 20 IN L−1, we see that the heterogeneously
lower cloud layer while persistent supersaturation is main-tained over almost the remaining cloud depth. Only at the uppermost cloud top homogeneous nucleation is possible but too few crystals are produced to effectively reduce the super-saturation. On further increasing the IN concentration the bottom layer of the cloud where the heterogeneous ice crys-tals deplete the excess vapour down to saturation becomes thicker, but there is still a layer of persistent supersaturation at the top of the cloud which gets deeper over time as the heterogeneously formed ice crystals sediment down while the ongoing updraught leads to further cooling. In summary, there are three different regimes:
1. Only few heterogeneous IN (up to about 10 L−1):
Ho-mogeneous nucleation occurs over the whole depth of the cloud, i.e. nucleation and depositional growth deter-mines the structure of the cirrus cloud.
2. Medium number of IN (about 10 L−1):
Heteroge-neously formed ice crystals begin to significantly af-fect the cirrus cloud. Homogeneous nucleation is con-fined to a more and more shallow layer at cloud top, yet still a sufficient number of ice crystals are formed there that effectively reduce supersaturation in the up-per cloud part. In the lower cloud part, heterogeneously formed crystals inhibit homogeneous nucleation while they are not yet sufficient in number to reduce the persaturation. A zone with long lasting or persistent su-persaturation is thus present in the lower cloud part. 3. Large number of IN (20 L−1 and more): The cloud is
completely dominated by heterogeneously formed ice, which is sufficient in number to relax the supersatura-tion in the lower part of the cloud down to saturasupersatura-tion. When cooling goes on for hours, supersaturation can build up again in the upper part of the cloud after enough ice crystals have fallen down due to gravity. This may still later lead to relatively undisturbed homogeneous nucleation.
The transition between predominantly homogeneous and heterogeneous ice formation occurs at about 10 IN L−1; the
same value is predicted by the analytical formula Eq. (21) of Gierens (2003), when 216 K and 260 hPa are used as mean temperature and pressure in the cloud after 1 h of uplift. It can be seen that high supersaturation inside cirrus clouds (not considering the one at cloud top) can be maintained over a long period when IN are present and when steady cooling goes on over several hours. The supersaturation zone is in the lower part of the cloud when low to medium number con-centration of IN is present, while it shifts to the upper part of
the cloud when the IN concentration is high. Fig. 4. Time evolution of the relative humidity wrt ice and
ice crystal number densities (heterogeneously nucleated crystals:
black isolines, in 1 L−1 steps, homogeneously nucleated
crys-tals: purple isolines in 10 L−1 steps) in the reference cirrus
withw=0.06 m s−1and varying heterogeneous IN concentrations
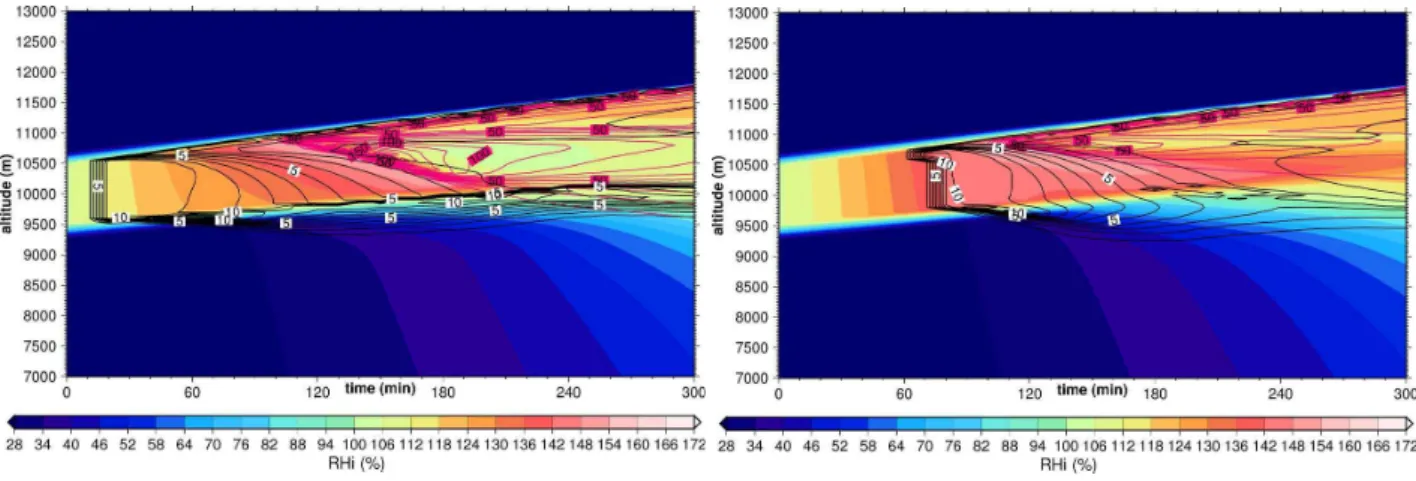
Fig. 5.Time evolution of the relative humidity wrt ice and ice crystal number densities (heterogeneously nucleated crystals: black isolines, in
1 L−1steps, homogeneously nucleated crystals: purple isolines in 10 L−1steps) in the reference cirrus withw=0.06 m s−1, heterogeneous
nucleation threshold RHihet=110% (left), RHihet=140% (right).
4.2 Variation of heterogeneous nucleation threshold
Now we test how the threshold humidity for heterogeneous nucleation affects the simulated cloud evolution. We use RHihet=110% and RHihet=140%, respectively, instead of
RHihet=130% of the reference case. Equation (21) of
Gierens (2003) gives only minor variation for the critical IN concentrations in this range, so we still find 10 L−1from that
formula for both thresholds (again with 216 K and 260 hPa). From this we might expect that variation of the nucleation threshold has not a great effect on cloud evolution for IN concentrations both sufficiently below and above the critical concentration. Indeed, we find that by and large the cloud evolution is similar for the considered nucleation thresholds in cases with 5 and 20 (and more) IN L−1. Large differences
appear in the case with 10 IN L−1, which is the critical
con-centration that the formula predicts.
When heterogeneous nucleation occurs at a low threshold humidity there is a long time for the ice crystals to grow and fall before homogeneous nucleation commences first in upper levels of the ISSR and eventually in the lower lev-els as well if the conditions allow it, as we will see. The rate of (i.e. change per unit time) increase of the supersatura-tion (dSi/dt) becomes larger as soon as the heterogeneously formed crystals fall out of the layer. Hence the overshooting over the homogeneous nucleation threshold gets higher and more crystals are formed homogeneously when the heteroge-neous nucleation event is long time ago. The homogeheteroge-neously formed ice crystal concentrations at cloud top are similar for all simulations (RHihet=110/130/140%) with maxima in the
range 200−250L−1, although a slight increase with
decreas-ing nucleation threshold is observed. However, the maxi-mum concentrations in the middle of the cloud differ. In the case with RHihet=110% we find maximum homogeneous
ice concentrations of at least 180 L−1, while this is about
150 L−1in the reference case. With an even higher
hetero-geneous threshold of RHihet=140% we find only maxima of
100 L−1of homogeneously formed ice crystals. The depth
of the in–cloud nucleation zone decreases strongly with in-creasing values of RHihet, which can be seen in Fig. 5.
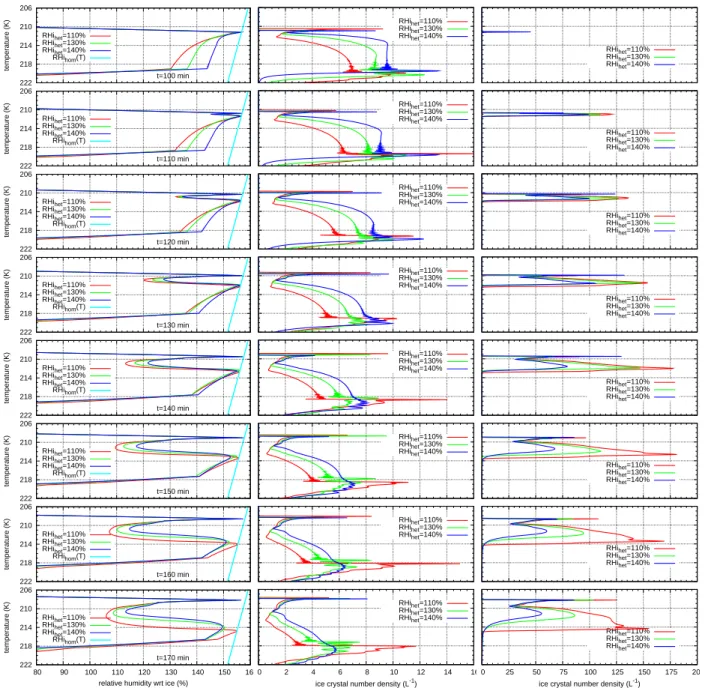
Figure 6 shows for the 10 L−1case the effect of IN with
various nucleation thresholds on the RHi–profile at simula-tion times fromts=100 min, i.e. just before homogeneous
nucleation starts at the ISSR top, tots=170 min. The
206
210
214
218
222
80 90 100 110 120 130 140 150 160
temperature (K)
t=100 min RHihet=110%
RHihet=130%
RHihet=140%
RHihom(T)
0 2 4 6 8 10 12 14 16 RHihet=110%
RHihet=130%
RHihet=140%
0 25 50 75 100 125 150 175 200 RHihet=110%
RHihet=130%
RHihet=140%
206
210
214
218
222
80 90 100 110 120 130 140 150 160
temperature (K)
t=110 min RHihet=110%
RHihet=130%
RHihet=140%
RHihom(T)
0 2 4 6 8 10 12 14 16 RHihet=110%
RHihet=130%
RHihet=140%
0 25 50 75 100 125 150 175 200 RHihet=110%
RHihet=130%
RHihet=140%
206
210
214
218
222
80 90 100 110 120 130 140 150 160
temperature (K)
t=120 min RHihet=110%
RHihet=130%
RHihet=140%
RHihom(T)
0 2 4 6 8 10 12 14 16 RHihet=110%
RHihet=130%
RHihet=140%
0 25 50 75 100 125 150 175 200 RHihet=110%
RHihet=130%
RHihet=140%
206
210
214
218
222
80 90 100 110 120 130 140 150 160
temperature (K)
t=130 min RHihet=110%
RHihet=130%
RHihet=140%
RHihom(T)
0 2 4 6 8 10 12 14 16 RHihet=110%
RHihet=130%
RHihet=140%
0 25 50 75 100 125 150 175 200 RHihet=110%
RHihet=130%
RHihet=140%
206
210
214
218
222
80 90 100 110 120 130 140 150 160
temperature (K)
t=140 min RHihet=110%
RHihet=130%
RHihet=140%
RHihom(T)
0 2 4 6 8 10 12 14 16 RHihet=110%
RHihet=130%
RHihet=140%
0 25 50 75 100 125 150 175 200 RHihet=110%
RHihet=130%
RHihet=140%
206
210
214
218
222
80 90 100 110 120 130 140 150 160
temperature (K)
t=150 min RHihet=110%
RHihet=130%
RHihet=140%
RHihom(T)
0 2 4 6 8 10 12 14 16 RHihet=110%
RHihet=130%
RHihet=140%
0 25 50 75 100 125 150 175 200 RHihet=110%
RHihet=130%
RHihet=140%
206
210
214
218
222
80 90 100 110 120 130 140 150 160
temperature (K)
t=160 min RHihet=110%
RHihet=130%
RHihet=140%
RHihom(T)
0 2 4 6 8 10 12 14 16 RHihet=110%
RHihet=130%
RHihet=140%
0 25 50 75 100 125 150 175 200 RHihet=110%
RHihet=130%
RHihet=140%
206
210
214
218
222
80 90 100 110 120 130 140 150 160
temperature (K)
relative humidity wrt ice (%) t=170 min RHihet=110%
RHihet=130%
RHihet=140%
RHihom(T)
0 2 4 6 8 10 12 14 16 ice crystal number density (L-1)
RHihet=110%
RHihet=130%
RHihet=140%
0 25 50 75 100 125 150 175 200 ice crystal number density (L-1)
RHihet=110%
RHihet=130%
RHihet=140%
Fig. 6. Vertical profiles of relative humidity wrt ice (in %, left), heterogeneously formed ice crystal number density (in L−1,
mid-dle) and homogeneously nucleated ice crystal number density (in L−1, right), respectively, versus temperature for simulation times
ts=100,110,120,130,140,150,160,170 min (from top to bottom). The light blue line in the left hand panels is the temperature dependent
threshold for homogeneous nucleation of solution droplets of size 0.25µm, expressed asRH ihom=100%(2.583−T /207.83 K).
ISSR and persistent supersaturation (below the homogeneous threshold) can be maintained there. Since homogeneous nu-cleation occurs over the full ISSR depth in the case with RHihet=110%, supersaturation becomes reduced throughout the ISSR (except the top level) in that case, but not the others.
4.3 Variation of the uplift speed
w=0.04 m s−1andw=0.08 m s−1, respectively, both typical
synoptic values. As we have seen in Part 1a, even variation in this restricted range affects the structure of the simulated cirrus clouds considerably. Over this range,w3/2changes by a factor of 2.8. The critical IN concentrations are 4.5 and 13 L−1, respectively.
Theoretical considerations (e.g. Gierens, 2003) show that the influence of heterogeneously formed ice crystals on the further evolution of a cirrus cloud decreases with increasing uplift strength. When the uplift is strong enough, homoge-neous nucleation will occur for sure, and produce much more ice crystals than heterogeneous nucleation has produced be-fore. The stronger the uplift, the more crystals are pro-duced homogeneously while the number of heterogeneously formed crystals does not depend on uplift strength. Hence the further evolution of the cloud in all respects is less and less affected by the presence of a smaller and smaller por-tion of heterogeneously formed crystals with increasing up-lift strength. This is indeed what we find here.
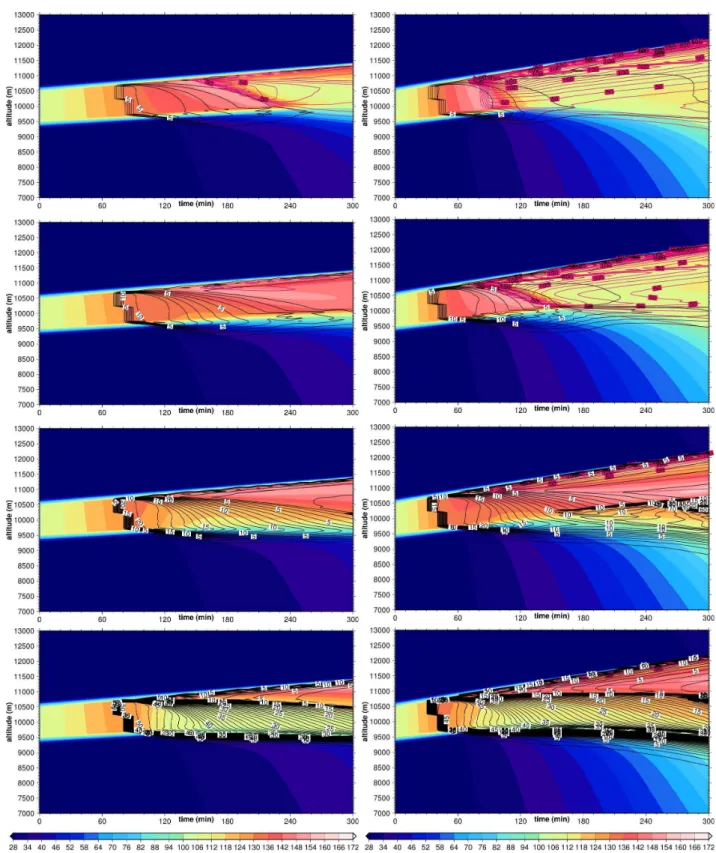
Comparing the time evolution for low and high vertical windspeed (Fig. 7 left and right, respectively) with the time evolution in the reference case (Figs. 2 and 4) shows that the case with highestwand lowest IN concentration experi-ences a similar homogeneous nucleation event like the pure homogeneous case. For instance, homogeneous nucleation takes place almost simultaneously over the whole depth of the ISSR, in spite of the presence of the heterogeneously formed ice crystals. The cooling rate is sufficiently high to overcome the depletion of the excess vapour by the growth of the heterogeneous ice. For the case withw=0.04 m s−1
and the low IN concentration of 5 L−1the formula of Gierens
(2003) predicts inhibition of homogeneous nucleation which, however, happens over the complete depth of the cloud. The reason is that the slow uplift allows the heterogeneous crys-tals to fall out of the cloud before the humidity reaches the homogeneous nucleation threshold. Sedimentation is, how-ever, not included in the derivation of the formula of Gierens (2003).
At w=0.08 m s−1, 10 IN L−1 are still not sufficient to
hinder homogeneous nucleation to occur over the whole depth of the cloud. The cloud quickly reaches ice satura-tion after the homogeneous nucleasatura-tion event. However, at w=0.04 m s−1the same concentration of IN shuts down
ho-mogeneous nucleation almost completely (apart from the up-permost layer). As before, the concentration of heteroge-neously formed crystals is insufficient to reduce the super-saturation, hence we get here a situation where almost the whole cloud depth remains highly supersaturated for the 5 h simulation time. After about 4 h the region is essentially free of crystals because they are already fallen out. With higher IN concentrations and slow uplift, the heterogenously formed ice crystals start to consume the supersaturation and the two–layer structure re–appears with low supersaturation in the lower cloud part and high supersaturation in the upper part, as in the corresponding reference cases.
20 IN L−1 are required in the stronger uplift case with
w=0.08 m s−1, to shut down homogeneous nucleation over
most of the cloud depth. However, supersaturation is not ef-fectively removed by the heterogeneously formed crystals, because of the higher cooling rate. Only in the case with 50 IN L−1 we get an approximately ice–saturated layer at
cloud bottom. The upper half is still in a highly supersat-urated state after 5 h simulation time.
The resume of this section is that we still have three regimes of IN concentrations, one where homogeneous nu-cleation is hardly affected, one where it is almost completely inhibited, and an intermediate one where slight parameter changes can dramatically change the evolution of the cloud structure. As expected, the critical IN concentration in-creases with uplift speed.
4.4 Impact of temperature
So far we described simulations with an initial temperature in the ice supersaturated layer of 215≤T≤222 K. As homo-geneous nucleation rates, depositional growth rates, and the effect of IN on the later cloud evolution depend sensitively on temperature, we now perform simulations with colder and warmer ice supersaturated layers, namely 206≤T≤215 K and 222≤T≤230 K, respectively. These temperature varia-tions are realised simply by shifting the ISSR up and down 1 km. For the critical IN concentrations we find 6.5 L−1for
the warm case (assuming 224 K and 300 hPa) and 16 L−1for
the cold case (209 K, 200 hPa). The changes are mostly due to the temperature dependence of homogeneous nucleation rates and deposition growth rates (see Part 1a).
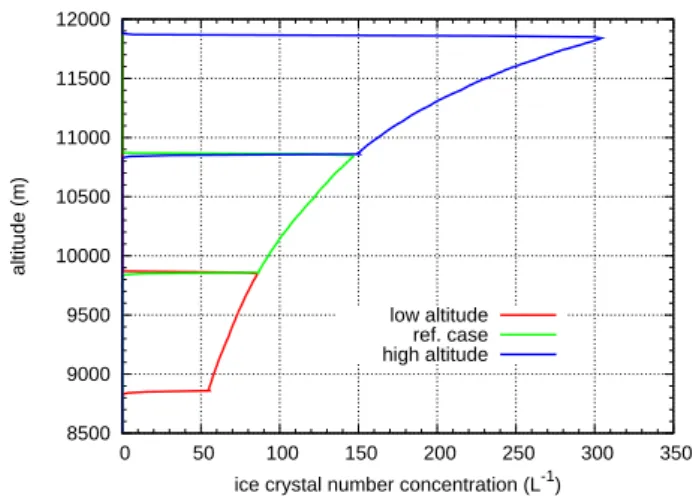
The temperature effect on homogeneous nucleation can be seen in Fig. 8 which shows cases without IN, i.e. the result of purely homogeneous nucleation, just after cloud formation at ts∼100 min. Without IN, homogeneous nucleation occurs in allT–ranges almost simultaneously throughout the ISSR.
In the warm case, 5 IN L−1are not sufficient to inhibit
Fig. 7.Time evolution of the relative humidity wrt ice and ice crystal number densities (heterogeneously nucleated crystals: black isolines,
in 1 L−1steps, homogeneously nucleated crystals: purple isolines in 10 L−1steps) in the reference cirrus withw=0.04 m s−1(left) and
8500 9000 9500 10000 10500 11000 11500 12000
0 50 100 150 200 250 300 350
altitude (m)
ice crystal number concentration (L-1) low altitude
ref. case high altitude
Fig. 8.Ice crystal number densities for cirrus clouds formed at
dif-ferent temperature ranges at simulation timets=100 min. Note that
the curves are plotted for cases of pure homogeneous nucleation.
As 10 IN L−1is already significantly above the critical IN
concentration in the warm case, we find homogeneous nu-cleation confined to the uppermost layer of the ISSR, pro-ducing only few crystals, such that in–cloud supersaturation is not reduced for hours, until the end of the simulation af-ter 5 h. The supersaturated region at that time is almost void of ice. Even higher IN concentrations shut down homoge-neous nucleation nearly completely, and lead to more and more consumption of the excess vapour in the lower parts of the cloud, leaving the 2–layer type cloud as in the simulations before with high IN concentrations. The heterogeneous ice grows faster than in the reference cases, thus its sedimenta-tion fluxes are larger and the lower saturated layer is thinner than in the reference case, while for the upper supersaturated layer it is vice versa.
In the cold case the transition between the predominantly homogeneous and heterogeneous cloud ice formation takes place between the 10 and 20 IN L−1cases, as expected.
Sed-imentation fluxes of the heterogeneous ice are small com-pared to the warm and reference cases, such that in the situa-tion with the highest concentrasitua-tion of IN the lower saturated layer is thicker than in those other cases.
4.5 Effect of temperature fluctuations
We have seen in Part 1b (Spichtinger and Gierens, 2009b) that initial temperature fluctuations forming wind field fluc-tuations (i.e. small eddies) have the effect to reduce mean values of cloud ice and crystal number concentrations and to leave more water in the vapour phase. These results were obtained from simulations with purely homogeneous nucle-ation. When there are fluctuations a few of the model grid boxes obtain a higher than average cooling rate and these are the first grid boxes where homogeneous nucleation oc-curs, producing higher than average crystal numbers due to
the higher cooling rate. Some of the new crystals are soon transported into the neighbouring, still cloud free, grid boxes by the small eddies that result from the fluctuations. These crystals now reduce dSi/dt in their new grid boxes where thus less than average ice crystals are produced eventually. Now the question arises whether and how the presence of IN and their impact on cloud evolution prior to homogeneous nucleation changes the fluctuation effects.
We do not expect an impact of fluctuations on hetero-geneous nucleation because the formulation of this process in our model is not sensitive to them. Once the heteroge-neous threshold is surpassed, every IN freezes independently of the rate at which the relative humidity increases beyond the threshold. This kind of insensitivity should not change much with a more sophisticated parameterisation of hetero-geneous nucleation unless the number concentrations of het-erogeneously formed crystals is large enough that mixing into neighbouring grid boxes has a major effect ondSi/dt there. However, even at our highest IN concentrations we have not seen such an effect.
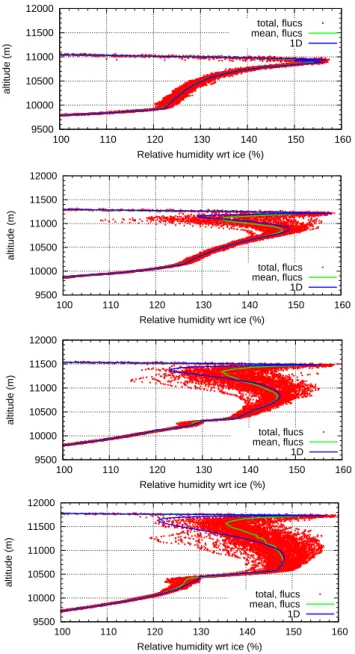
Considering the temporal evolution of clouds formed pre-dominantly by homogeneous nucleation we find that RHi profiles display extreme variability exceeding 30% (in units of RHi) during the relaxation phase that follows the homo-geneous nucleation event. The RHi fluctuations are smaller (≈10%) before nucleation starts, and after the relaxation phase they decrease to the roughly 10% range. The extreme RHi variability during the relaxation phase is a consequence of (a) the high nucleation threshold which marks the upper limit of the fluctuations, (b) the differing starting times for the relaxation process in different grid boxes at the same al-titude, and (c) the differing relaxation rates due to the vari-ation in crystal surface area concentrvari-ation in different grid boxes which in turn result from the different cooling rates. Because of the periodically occuring nucleation bursts at the upper cloud boundary, there are always strong RHi fluctua-tions in this region. Figure 9 shows this time evolution of the relative humidity fluctuations around the starting point of homogeneous nucleation (aroundt∼100 min).
9500 10000 10500 11000 11500 12000
100 110 120 130 140 150 160
altitude (m)
Relative humidity wrt ice (%) total, flucs mean, flucs 1D
9500 10000 10500 11000 11500 12000
100 110 120 130 140 150 160
altitude (m)
Relative humidity wrt ice (%) total, flucs mean, flucs 1D
9500 10000 10500 11000 11500 12000
100 110 120 130 140 150 160
altitude (m)
Relative humidity wrt ice (%) total, flucs mean, flucs 1D
9500 10000 10500 11000 11500 12000
100 110 120 130 140 150 160
altitude (m)
Relative humidity wrt ice (%) total, flucs mean, flucs 1D
Fig. 9. Time evolution for the relative humidity in the simulation with only homogeneous nucleation. From top to bottom:
simula-tion timets=60/90/120/150 min, i.e. around the starting point of
homogeneous nucleation.
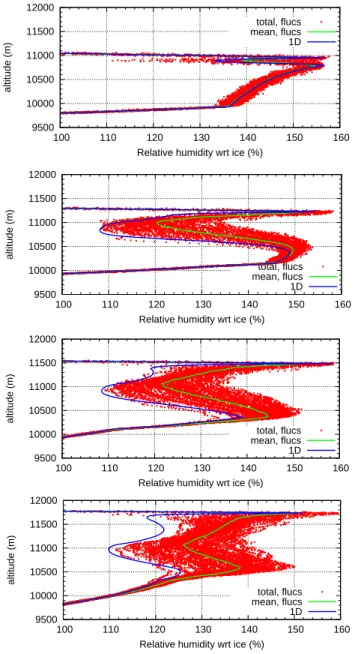
the time evolution of the variability of relative humidity for the case ofna,2=20 L−1is shown; starting from very small
variability atts=120 min an increasing strength of the
varia-tions can be observed when homogeneous nucleation begins to dominate the cloud.
Clouds with approximately the critical concentration of IN initially behave like clouds formed predominantly by homogeneous nucleation. In the upper part of the cloud where homogeneous nucleation occurs first we find the typ-ical strong RHi variability during the relaxation phase. The fluctuations first are relatively weak in the lower part of the
9500 10000 10500 11000 11500 12000
100 110 120 130 140 150 160
altitude (m)
Relative humidity wrt ice (%) total, flucs mean, flucs 1D
9500 10000 10500 11000 11500 12000
100 110 120 130 140 150 160
altitude (m)
Relative humidity wrt ice (%) total, flucs mean, flucs 1D
9500 10000 10500 11000 11500 12000
100 110 120 130 140 150 160
altitude (m)
Relative humidity wrt ice (%) total, flucs mean, flucs 1D
9500 10000 10500 11000 11500 12000
100 110 120 130 140 150 160
altitude (m)
Relative humidity wrt ice (%) total, flucs mean, flucs 1D
Fig. 10. Time evolution for the relative humidity in the
simu-lation withna,2=20 L−1. From top to bottom: simulation time
ts=120/180/240/300 min.
cloud. However, the supersaturation there is large (albeit be-low the homogeneous threshold) and lots of homogeneously formed crystals fall into this layer from above where they start to consume the excess vapour. Since the sedimentation flux density fluctuates itself, the vapour take up varies from grid cell to grid cell, leading eventually to large variability in the RHi profiles. Overall, the fluctuation effect on the RHi profiles is largest in the case with critical IN number concen-tration. In Fig. 11 the time evolution of the relative humid-ity fluctuations for the case ofna,2=10 L−1is shown. The
9500 10000 10500 11000 11500 12000
100 110 120 130 140 150 160
altitude (m)
Relative humidity wrt ice (%) total, flucs mean, flucs 1D
9500 10000 10500 11000 11500 12000
100 110 120 130 140 150 160
altitude (m)
Relative humidity wrt ice (%) total, flucs mean, flucs 1D
9500 10000 10500 11000 11500 12000
100 110 120 130 140 150 160
altitude (m)
Relative humidity wrt ice (%) total, flucs mean, flucs 1D
9500 10000 10500 11000 11500 12000
100 110 120 130 140 150 160
altitude (m)
Relative humidity wrt ice (%) total, flucs mean, flucs 1D
Fig. 11. Time evolution for the relative humidity in the
simu-lation withna,2=10 L−1. From top to bottom: simulation time
ts=120/180/240/300 min.
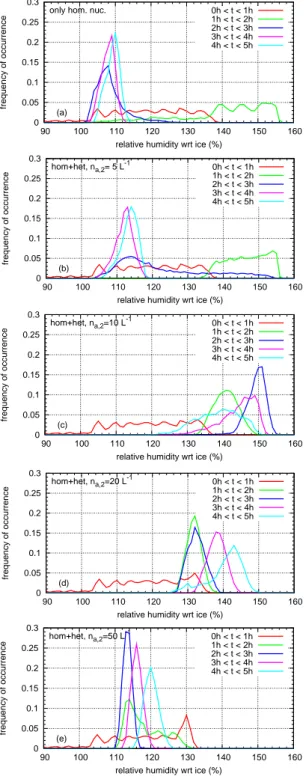
Finally we show statistics of in–cloud supersaturation, a topic that attracted quite some interest during recent years (e.g. Ovarlez et al., 2002; Korolev and Mazin, 2003; Spichtinger et al., 2004; Peter et al., 2006). We evaluate the humidity fields in an altitude range 10 400≤z≤10 600 m (mimicking aircraft probing) for a couple of simulation times (i.e. cloud ages) and for IN concentrations from zero to 50 L−1. The frequency distributions are shown in Fig. 12.
As we can see, a cloud that forms predominantly by either type of nucleation, homogeneous or heterogeneous, sooner or later approaches saturation, that is the humidity
distri-bution centres around a quasi–steady supersaturation value (Korolev and Mazin, 2003) at about 110% RHi. In contrast, clouds where neither nucleation process dominates display long–lasting significant in–cloud supersaturation exceeding 130% RHi, in particular when the critical IN concentration is present. Of course, the persistent supersaturation is the con-sequence of the ongoing uplift and the relatively low ice crys-tal concentration in some regions of the cloud, which in turn is due to the attenuation of homogeneous nucleation caused by the pre–existing heterogeneously formed ice. These re-sults show that long–lasting in–cloud supersaturation can be explained by dynamics and standard microphysics alone; there is no need to resort to exotic phenomena (for instance cubic ice formation atT <200 K (Murray et al., 2005; Mur-ray, 2008a), suppressing homogeneous nucleation via or-ganic compounds (K¨archer and Koop, 2005), glassy states of aqueous solutions that inhibit freezing (Zobrist et al., 2008; Murray, 2008b) ) for an explanation, although they are not excluded and could contribute to the phenomenon, perhaps in a more pronounced way at temperaturesT <200 K.
4.6 Cloud effects on background aerosol distribution
All our simulations were initialised with a uniform homoge-neous background distribution of IN, clearly an idealisation. These IN form ice crystals that in turn grow, fall to cloud base and below into the subsaturated sub–cloud layer and eventually evaporate, thereby giving back the IN to the back-ground atmosphere. Since the IN do not fall, they become enriched in a layer below the cloud. The enrichment factor can be quite large. For instance, when the initial background concentrations wasna,2=20 L−1, the sub–cloud enrichment
leads to values of na,2=70−80 L−1 in the simulations. In
real situations the enrichment would of course also depend on the humidity profile below the cloud which controls the evaporation rate of the ice crystals. The high enrichment fac-tor here stems from the sharp humidity gradient below the ISSR which leads to quick evaporation over a short falling distance.
The assumed ongoing cooling sooner or later leads to high humidity values also in the sub–cloud layer. The previously evaporated ice adds further to the humidity increase, such that eventually the threshold for heterogeneous nucleation is reached and surpassed again. Hence a new cloud of heteroge-neous ice may form just below the original cloud, and even partly within the old cloud, since the falling homogeneous ice crystals may already have reached this layer as well. In Fig. 13 the heterogeneous formation of ice crystals in this sub cloud layer with enriched IN concentrations is shown for two example simulations (top:w=0.06 m s−1, ISSR in low
tem-perature regime; bottom: w=0.08 m s−1, ISSR in reference
0 0.05 0.1 0.15 0.2 0.25 0.3
90 100 110 120 130 140 150 160
frequency of occurrence
relative humidity wrt ice (%) only hom. nuc.
(a)
0h < t < 1h 1h < t < 2h 2h < t < 3h 3h < t < 4h 4h < t < 5h
0 0.05 0.1 0.15 0.2 0.25 0.3
90 100 110 120 130 140 150 160
frequency of occurrence
relative humidity wrt ice (%)
hom+het, na,2= 5 L
-1
(b)
0h < t < 1h 1h < t < 2h 2h < t < 3h 3h < t < 4h 4h < t < 5h
0 0.05 0.1 0.15 0.2 0.25 0.3
90 100 110 120 130 140 150 160
frequency of occurrence
relative humidity wrt ice (%)
hom+het, na,2=10 L
-1
(c)
0h < t < 1h 1h < t < 2h 2h < t < 3h 3h < t < 4h 4h < t < 5h
0 0.05 0.1 0.15 0.2 0.25 0.3
90 100 110 120 130 140 150 160
frequency of occurrence
relative humidity wrt ice (%)
hom+het, na,2=20 L
-1
(d)
0h < t < 1h 1h < t < 2h 2h < t < 3h 3h < t < 4h 4h < t < 5h
0 0.05 0.1 0.15 0.2 0.25 0.3
90 100 110 120 130 140 150 160
frequency of occurrence
relative humidity wrt ice (%)
hom+het, na,2=50 L
-1
(e)
0h < t < 1h 1h < t < 2h 2h < t < 3h 3h < t < 4h 4h < t < 5h
Fig. 12. Frequency distribution of the relative humidity in the
alti-tude range 10 400≤z≤10 600 m collecting data from different time
intervals ([0 h:1 h], [1 h:2 h], [2 h:3 h], [3 h:4 h], [4 h:5 h], colour
code) for the different simulations (na,2=0/5/10/20/50 L−1,
pan-els(a)to(e), from top to bottom) during a synoptic updraught of
w=0.06 m s−1including small scale temperature fluctuations.
11000 11100 11200 11300 11400 11500 11600 11700 11800 11900 12000
0 10 20 30 40 50 60
altitude (m)
ice crystal number density (1/L) ts=270 min ts=280 min ts=290 min ts=300 min
10000 10100 10200 10300 10400 10500 10600 10700 10800 10900 11000
0 10 20 30 40 50 60 70 80
altitude (m)
ice crystal number density (1/L) ts=240 min ts=260 min ts=280 min ts=300 min
Fig. 13. Heterogeneous nucleation events below the cloud layer due to modification of the aerosol concentration by nucleation, sedimen-tation and evaporation of ice crystals are shown in representing het-erogeneously formed ice crystals vs. height. Top panel: Simulation
with constant updraught ofw=0.06 for a initial ISSR in the range
10.5≤z≤11.5 km. Bottom panel: Simulation with constant
up-draught ofw=0.08 for a initial ISSR in the range 9.5≤z≤10.5 km.
In both cases, the initial IN concentration wasna,2=20 L−1.
This shows how cirrus clouds can modify the background aerosol distribution by nucleation, sedimentation and evapo-ration (in this order) and create relatively large aerosol centrations in sub–cloud layers. We see, large aerosol con-centrations are not necessarily a product of correspondingly large source strengths, but may also be the result of cloud processes. In our simulations a layered structure of the back-ground aerosol distribution resulted. Another effect of cloud processing is the alteration of microphysical and chemical IN properties; yet this has not been considered here.
4.7 Size distributions
While the size distribution is a monomodal log–normal in every grid box, the mean crystal sizes vary from grid box to grid box and are different in the two considered ice classes. Hence, over certain regions in a model cloud we can have bi-and even multimodal size distributions, which is in fact what we find.
Short (i.e. minutes) after a nucleation event mean crystal lengths are typically between 1 and 10µm. One hour later we then find regions with mean crystal lenghts of 100µm and more. Maxima of (grid box mean) crystal lengths reach 200 to 300µm.
Ice crystals formed heterogeneously are on average larger than ice crystals formed homogeneously because they form earlier and have less competition for excess vapour. There-fore, in a cloud that was predominantly formed by heteroge-neous freezing we can expect to find larger ice crystals on av-erage than in clouds formed predominantly by homogeneous nucleation. However, because in the latter cloud type there are much more ice crystals than in the former one, it might be that in total there are more large crystals in the latter than in the former cloud type.
5 Conclusions
We have used the recently developed ice microphysics scheme (Part 1a) for investigating the impact of heteroge-neous nucleation on the life cycle of cirrus clouds driven by constant synoptic updraught (w≤0.08 m s−1) over at least
5 h. Heterogeneous and homogeneous nucleation take place within the same environment and can influence each other. Related studies have been performed earlier with box mod-els, but crystal sedimentation, temperature and wind fluctua-tions, usually not implemented in box models, introduce new effects. From our simulations we draw the following conclu-sions:
1. The ratedRH i/dt(ordSi/dt) at the homogeneous nu-cleation threshold RHihomdetermines the number of ice
crystals that are produced in the nucleation event. This conclusion is consistent with several published works (e.g. K¨archer and Lohmann, 2002; Ren and Mackenzie, 2005; K¨archer et al., 2006; Barahona and Nenes, 2008). In a situation without pre–existent ice crystals, it is the cooling ratedT /dt or, indirectly, the uplift ratewthat determines (is proportional to)dRH i/dt.
2. Heterogeneous ice formation at relative humidities RHihet<RHihom leads to pre–existent ice that reduces
dRH i/dt due to its water uptake, hence reduces the number of ice crystals formed homogeneously later. This impeding effect of heterogeneous ice formation in-creases with increasing number of IN, and it is strong in particular when RHihetis little below RHihom. It is weak
when RHihet is low (i.e. when the background aerosol
represents good ice nuclei), because this allows the het-erogeneously formed ice to fall out from the ISSR be-fore the homogeneous threshold is reached. The imped-ing effect is not simply linear in RHihom−RHihet.
3. Sedimentation of the heterogeneously formed ice crys-tals leads to a downward ice concentration gradient in the cloud, which in turn causes an upward gradi-ent of dRH i/dt. Hence the number of ice crystals forming homogeneously experiences an upward gradi-ent as well. Homogeneous nucleation can be switched off in the lower cloud layers when a sufficiently large concentration of heterogeneously formed ice crystals is present. Fluctuations of temperature and random mo-tions in the cloud weaken the latter effect.
4. There are generally three types of cloud structures, depending on the predominant ice formation process, i.e. homogeneous or heterogeneous freezing, and a mixed case. The latter is given when the IN con-centration is roughly the critical number density from Eq. (21) in Gierens (2003) (typically 10 L−1 for the
cases considered here). Mixed cases are prone to long– lasting in–cloud supersaturation, while in either homo-geneously and heterohomo-geneously formed cirrus RHi re-laxes to a quasi–stationary supersaturation of the order 10%. The persistent supersaturation in each case is a consequence of the assumed constant uplift, resulting in constant cooling. We conjecture that mixed type clouds are characterised by similar timescales of cooling, crys-tal growth, and sedimentation.
5. The constant uplift together with crystal sedimentation leads to a thin zone of persistent ice supersaturation at the upper boundary of the ISSR and the cloud which pe-riodically gives rise to a new homogeneous nucleation event.
6. Fluctuations of temperature and random motions in the cloud have the effect of leaving more water in the vapour phase, i.e. they enhance the in–cloud supersat-uration phenomenon. The fluctuations have the biggest influence in the mixed cases where neither homoge-neous nor heterogehomoge-neous ice formation dominates. 7. The cloud processes affect the background spatial
dis-tribution of the IN. In the cases studied here an initially uniform distribution is transformed into a layer nearly void of IN (most of the cloud layer) and a layer just be-neath the cloud where IN are enriched. The ongoing cooling can eventually lead to new heterogeneous ice formation below the original cloud layer.
highly nonlinear nucleation behaviour (on/off), (2) the super-saturation hysteresis involved in ice formation vs. evapora-tion (ice forms at substantial supersaturaevapora-tion but evaporates at subsaturation), and (3) the competition between various ice formation processes that act at different supersaturation thresholds. Whenever this game ends in a draw (i.e. neither nucleation process dominates) there appear zones of long– lasting substantial supersaturation in a cirrus cloud.
Acknowledgements. We thank Piotr K. Smolarkiewicz for sharing
his model and Andreas D¨ornbrack for help in its application. We thank these two and Marcia Baker, Bernd K¨archer, Ulrike Lohmann, Thomas Peter, Olaf Stetzer and Marian de Reus for fruitful discussions. This study contributes to the DFG (German research foundation) project “D¨unner Zirrus” (GI 333/1-1), to the DLR/HGF–project “Particles and Cirrus Clouds” (PAZI-2) and to Activity 5 of the European Integrated Project QUANTIFY. The numerical simulations were performed at the European Centre for Medium–Range Weather Forecasts (special project “Ice supersaturation and cirrus clouds”).
Edited by: A. Nenes
References
Barahona, D. and Nenes, A.: Parameterization of cirrus formation in large scale models: Homogeneous nucleation, J. Geophys. Res., 113, doi:10.1029/2007JD009355, 2008.
Chen, T., Rossow, W. B., and Zhang, Y.: Radiative Effects of Cloud-Type Variations, J. Climate, 13, 264–286, 2000.
Clark, T. and Farley, R.: Severe downslope windstorm calculations in two and three spatial dimensions using anelastic interactive grid nesting: A possible mechanism for gustiness, J. Atmos. Sci., 41, 329–350, 1984.
DeMott, P. J., Rogers, D. C., and Kreidenweis, S. M.: The suscepti-bility of ice formation in upper tropospheric clouds to insolu- ble aerosol components, J. Geophys. Res., 102, 19575–19584, 1997. DeMott, P. D., Cziczo, A., Prenni, D., Murphy, S., Kreidenweis, D., Thomson, R., Borys, D., and Rogers, D. C.: Measurements of the concentration and composition of nuclei for cirrus formation, Proc. Nat. Acad. Sci., 100, 14655–14660, 2003.
Emanuel, K.: Atmospheric convection, Oxford University Press, 580 pp., 1994.
Fusina, F., Spichtinger, P., and Lohmann, U.: The impact of ice supersaturated regions and thin cirrus on radiation in the mid lat-itudes, J. Geophys. Res., D24S14, doi:10.1029/2007JD008449, 2007.
Gierens, K., Schumann, U., Helten, M., Smit, H., and Marenco, A.: A distribution law for relative humidity in the upper troposphere and lower stratosphere derived from three years of MOZAIC measurements, Ann. Geophys., 17, 1218–1226, 1999,
http://www.ann-geophys.net/17/1218/1999/.
Gierens, K.: On the transition between heterogeneous and homoge-neous freezing, Atmos. Chem. Phys., 3, 437–446, 2003, http://www.atmos-chem-phys.net/3/437/2003/.
Grabowski, W. and Smolarkiewicz, P.: A multiscale anelastic model for meteorological research, Mon. Weather Rev., 130, 939–956, 2002.
Haag, W. and K¨archer, B.: The impact of aerosols and gravity waves on cirrus clouds at midlatitudes, J. Geophys. Res., 109, D12202, doi:10.1029/2004JD00457, 2004.
Heymsfield, A. and Iaquinta, J.: Cirrus crystal terminal velocities, J. Atmos. Sci., 57, 916–938, 2000.
Heymsfield, A. J. and Sabin, R. M.: Cirrus crystal nucleation by homogeneous freezing of solution droplets, J. Atmos. Sci., 46, 2252–2264, 1989.
Kajikawa, M. and Heymsfield, A.: Aggregation of ice crystals, J. Atmos. Sci., 46, 3108–3121, 1989.
K¨archer, B. and Lohmann, U.: A Parameterization of cirrus cloud
formation: Homogeneous freezing of supercooled aerosols,
J. Geophys. Res., 107(D2), 4010, doi:10.1029/2001JD000470, 2002.
K¨archer, B. and Str¨om, J.: The roles of dynamical variability and aerosols in cirrus cloud formation, Atmos. Chem. Phys., 3, 823– 838, 2003, http://www.atmos-chem-phys.net/3/823/2003/. K¨archer, B. and Koop, T.: The role of organic aerosols in
homoge-neous ice formation, Atmos. Chem. Phys., 5, 703–714, 2005, http://www.atmos-chem-phys.net/5/703/2005/.
K¨archer, B., Hendricks, J., and Lohmann, U.:
Physi-cally based parameterization of cirrus cloud formation for use in global atmospheric models, J. Geophys. Res. 111, doi:10.1029/2005JD006219, 2006.
Koenig, L.: Numerical modeling of ice deposition, J. Atmos. Sci., 28, 226–237, 1971.
Korolev, A. and Mazin, I.: Supersaturation of Water Vapor in Clouds, J. Atmos. Sci., 60, 2957–2974, 2003.
Koop, T.: Homogeneous ice nucleation in water and aqueous solu-tions, Z. Phys. Chem. 218, 1231–1258, 2004.
Koop, T., Luo, B., Tsias, A., and Peter, T.: Water activity as the de-terminant for homogeneous ice nucleation in aqueous solutions, Nature 406, 611–614, 2000.
Khvorostyanov, V. and Curry, J.: The Theory of Ice Nucleation by Heterogeneous Freezing of Deliquescent Mixed CCN. Part II: Parcel Model Simulation, J. Atmos. Sci., 62, 261–285, 2005. Khvorostyanov, V., Morrison, H., Curry, J. A., Baumgardner, D.,
and Lawson, P.: High supersaturation and modes of ice nucle-ation in thin tropopause cirrus: Simulnucle-ation of the 13 July 2002 Cirrus Regional Study of Tropical Anvils and Cirrus Layers case, J. Geophys. Res., 111, D02201, doi:10.1029/2004JD005235, 2006.
Liu, X. and Penner, J. E.: Ice nucleation parameterization for global models, Meteor. Z., 14, 499–514, 2005.
Mace, G. G., Benson, S., and Vernon, E.: Cirrus Clouds and the Large-Scale Atmospheric State: Relationships Revealed by Six Years of Ground-Based Data, J. Climate, 19, 3257–3278, 2006. M¨ohler, O., Field, P. R., Connolly, P., Benz, S., Saathoff, H.,
Schnaiter, M., Wagner, R., Cotton, R., Kr¨amer, M., Mangold, A., and Heymsfield, A. J.: Efficiency of the deposition mode ice nu-cleation on mineral dust particles, Atmos. Chem. Phys., 6, 3007– 3021, 2006, http://www.atmos-chem-phys.net/6/3007/2006/. Murray, B. J., Knopf, D. A., Bertram, A. K.: The formation of cubic
ice under conditions relevant to Earth’s atmosphere, Nature, 434 202–205, 2005.
Murray, B. J.: Enhanced formation of cubic ice in aqueous organic acid droplets, Environ. Res. Lett., 3, 025008, doi:10.1088/1748-9326/3/2/025008, 2008a.
aqueous organic droplets, Atmos. Chem. Phys., 8, 5423–5433, 2008b, http://www.atmos-chem-phys.net/8/5423/2008/. Ovarlez, J., Gayet, J.-F., Gierens, K., Str¨om, J., Ovarlez, H.,
Auriol, F., Busen, R., and Schumann, U.: Water vapor
measurements inside cirrus clouds in northern and southern hemispheres during INCA, Geophys. Res. Lett., 29(16), 1813, doi:10.1029/2001GL014440, 2002.
Peter T., Marcolli C., Spichtinger, P., Corti, T., Baker, M. B., and Koop, T.: When dry air is too humid, Science, 314(5804), 1399– 1402, 2006.
Ren, C. and Mackenzie, A. R.: Cirrus parametrization and the role of ice nuclei, Q. J. Roy. Meteor. Soc., 131, 1585–1605, 2005. Sassen, K. and Benson, S.: Ice nucleation in cirrus clouds: A model
study of the homogeneous and heterogeneous modes, Geophys. Res. Lett., 27, 521–524, 2000.
Sassen K. and Dodd, G. C.: Haze aprticle nucleation simulations in cirrus clouds, and applications for numerical and lidar studies, J. Atmos. Sci., 46, 3005–3014, 1989.
Smolarkiewicz, P. and Margolin, L.: On forward–in–time differ-encing for fluids: an Eulerian/Semi–Lagrangian non–hydrostatic model for stratified flows, Atmos.–Oceans, 35, 127–152, 1997. Smolarkiewicz, P., Margolin, L., and Wyszogrodzki, A.: A class
of nonhydrostatic global models, J. Atmos. Sci., 58, 349–364, 2001.
Spichtinger, P., Gierens, K., Leiterer, U., and Dier, H.: Ice super-saturation in the tropopause region over Lindenberg, Germany, Meteorol. Z., 12, 143–156, 2003.
Spichtinger, P., Gierens, K., Smit, H. G. J., Ovarlez, J., and Gayet, J.-F.: On the distribution of relative humidity in cirrus clouds, Atmos. Chem. Phys., 4, 639–647, 2004,
http://www.atmos-chem-phys.net/4/639/2004/.
Spichtinger, P., Gierens, K., and Wernli, H.: A case study on the formation and evolution of ice supersaturation in the vicinity of a warm conveyor belt’s outflow region, Atmos. Chem. Phys., 5, 973–987, 2005, http://www.atmos-chem-phys.net/5/973/2005/. Spichtinger, P. and Gierens, K. M.: Modelling of cirrus clouds –
Part 1a: Model description and validation, Atmos. Chem. Phys., 9, 685–706, 2009a,
http://www.atmos-chem-phys.net/9/685/2009/.
Spichtinger, P. and Gierens, K. M.: Modelling of cirrus clouds – Part 1b: Structuring cirrus clouds by dynamics, Atmos. Chem. Phys., 9, 707–719, 2009b,
http://www.atmos-chem-phys.net/9/707/2009/.
Vali, G.: Nucleation terminology, B. Am. Meterol. Soc., 66, 1426– 1427, 1985.