www.atmos-chem-phys.net/15/3703/2015/ doi:10.5194/acp-15-3703-2015
© Author(s) 2015. CC Attribution 3.0 License.
A new temperature- and humidity-dependent surface
site density approach for deposition ice nucleation
I. Steinke1, C. Hoose1,2, O. Möhler1, P. Connolly3, and T. Leisner1,4
1Institute for Meteorology and Climate Research – Atmospheric Aerosol Research,
Karlsruhe Institute of Technology, Karlsruhe, Germany
2Institute for Meteorology and Climate Research – Troposphere Research,
Karlsruhe Institute of Technology, Karlsruhe, Germany
3School of Earth, Atmospheric and Environmental Sciences,
University of Manchester, Manchester, UK
4Institute for Environmental Physics, Ruprecht Karl University Heidelberg,
Heidelberg, Germany
Correspondence to:I. Steinke ([email protected])
Received: 12 May 2014 – Published in Atmos. Chem. Phys. Discuss.: 14 July 2014 Revised: 25 January 2015 – Accepted: 29 January 2015 – Published: 2 April 2015
Abstract. Deposition nucleation experiments with Arizona Test Dust (ATD) as a surrogate for mineral dusts were con-ducted at the AIDA cloud chamber at temperatures between 220 and 250 K. The influence of the aerosol size distribution and the cooling rate on the ice nucleation efficiencies was in-vestigated. Ice nucleation active surface site (INAS) densities were calculated to quantify the ice nucleation efficiency as a function of temperature, humidity and the aerosol surface area concentration. Additionally, a contact angle parameter-ization according to classical nucleation theory was fitted to the experimental data in order to relate the ice nucleation effi-ciencies to contact angle distributions. From this study it can be concluded that the INAS density formulation is a very use-ful tool to describe the temperature- and humidity-dependent ice nucleation efficiency of ATD particles.
Deposition nucleation on ATD particles can be described by a temperature- and relative-humidity-dependent INAS density functionns(T , Sice)with
ns(xtherm)=1.88×10⁵·exp(0.2659·xtherm)[m−2], (1)
where the temperature- and saturation-dependent function
xthermis defined as
xtherm= −(T−273.2)+(Sice−1)×100, (2)
with the saturation ratio with respect to ice Sice>1 and
within a temperature range between 226 and 250 K. For
lower temperatures,xtherm deviates from a linear behavior
with temperature and relative humidity over ice.
Also, two different approaches for describing the time de-pendence of deposition nucleation initiated by ATD particles are proposed. Box model estimates suggest that the time-dependent contribution is only relevant for small cooling rates and low number fractions of ice-active particles.
1 Introduction
Laboratory studies and field campaigns have investigated the role of mineral dusts and single mineral species as ice nuclei in the atmosphere. Mineral dust acts as an ice nu-cleus over a wide range of temperatures and supersatura-tions over ice, with the most active dusts nucleating ice at approximately 260 K (Welti et al., 2009; Eastwood et al., 2009; Hoose and Möhler, 2012; Murray et al., 2012; Yakobi-Hancock et al., 2013). Using numerical modeling to estimate the climate impact of mineral dust through ice formation re-quires relations which connect aerosol properties, thermody-namic variables and resulting ice crystal concentrations. Two different approaches are typically used to find approxima-tions to describe the measured ice formation rates, namely a nucleation rate approach based on classical nucleation the-ory (also called “stochastic” or “time-dependent” approach), or an ice-active surface site approach assuming a determin-istic, time-independent behavior of ice nucleation (“singular hypothesis”). Both approaches are described briefly in the following paragraphs.
The deterministic approach implies that for heterogeneous ice nucleation the stochasticity is masked by the influence of variable aerosol properties (Vali, 2008). The observed ice formation seems to occur instantaneously upon cooling and does not explicitly depend on time. Therefore, the deter-ministic approach describes ice formation as a function of temperature and – for deposition nucleation – relative hu-midity over ice. The proposition of active sites which seem-ingly nucleate ice as soon as certain thermodynamic thresh-olds are reached motivates the ice nucleation active surface site (INAS) density concept (Fletcher, 1969; Connolly et al., 2009; Niemand et al., 2012; Hoose and Möhler, 2012).
The INAS density concept was applied to results from cloud chamber experiments by Connolly et al. (2009) to de-rive INAS densitiesnsfor various mineral dusts. The ice
nu-cleation active surface site density for immersion freezing is described by
1N =Ns·(1−exp(−A·ns(T ))), (3)
where1N is the observed ice crystal concentration at a cer-tain temperature, Ns the initial number of droplets, A the
aerosol surface and T the temperature. Note that, for im-mersion freezing,Aexclusively refers to particles being im-mersed within droplets. Also, this relation (Eq. 3) is only valid for a certain aerosol particle size. Equation 3 has been expanded towards a formulation which can be applied to a polydisperse aerosol population, yielding an approximate form of the ice nucleation active surface site density valid for ice fractions smaller thanfice≈10 % (Niemand et al., 2012)
with
ns≈ nice Aaer
, (4)
whereniceis the observed ice crystal concentration andAaer
the aerosol surface area concentration.
Like the INAS density approach, classical nucleation the-ory formulations have already been employed in several stud-ies investigating heterogeneous ice nucleation, e.g., in the studies by Marcolli et al. (2007). Lüönd et al. (2010), Murray et al. (2011), Wheeler and Bertram (2012), Broadley et al. (2012) and Rigg et al. (2013). Classical nucleation theory is based on the premise that the ice nucleation efficiency of aerosol particles can be quantified by the contact angleθ, which is a measure of the reduction of the energy barrier that impedes the formation of ice germs at the surface of aerosol particles (Pruppacher and Klett, 1997). For deposition nucle-ation, the nucleation rateJ (θ )per particle is given by
J (θ )=4π rN2·4π rg2√ e
2π mwkT n1
·exp
−1gkTg(θ )
1
ng r
1gg(θ )
3π kT
(5)
following the notation used by Chen et al. (2008), withrN
being the aerosol particle radius,rgthe radius of the ice germ, ethe water vapor pressure,mwthe mass of a water molecule, kthe Boltzmann constant,T the temperature in [K],n1the
number concentration of single molecules in contact with the aerosol surface, ng the number of water molecules per ice
germ and1gg(θ )the energy needed for forming a critical ice
germ. Note that, to calculaten1, the desorption energy1gd
is set to an average value of1gd=4×10⁻²⁰J (Chen et al.,
2008). The formalism used by Chen et al. (2008) explicitly considers the temperature- and humidity-dependence of n1
andrgwith
n1= e
νs√2π mwkT
exp
−1gd
kT
(6) and
rg=
2vwσi/v kT·lnSi
. (7)
The surface tension σi/v is described as a
temperature-dependent function according to Pruppacher and Klett (1997). The activation energy1gg(θ )is given by
1gg(θ )=
4π
3 r
2
g·σi/v·f (θ ), (8)
where σi/v is the surface tension at the ice–vapor
rate approach was extended towards including not only a sin-gle contact ansin-gle but a distribution of contact ansin-gles (Mar-colli et al., 2007; Lüönd et al., 2010). For this study, the dis-tributionp(θ )is assumed to be lognormal:
p(θ )= 1
θ σθ √
2πexp −
(ln(θ )−ln(µθ))2
2σθ2
!
, (9)
withµθ being the median contact angle andσθ the
logarith-mic width of the contact angle distribution.
Note that some parameterizations have sought to reconcile classical nucleation theory and the INAS density concept be-cause both approaches offer frameworks for fitting and pa-rameterizing experimental data, although they treat the in-herent time dependence of ice nucleation differently (Vali, 1994; Niedermeier et al., 2011). However, in this study only the INAS density approach and classical nucleation theory will be compared to each other.
Besides the INAS density approach and classical nucle-ation theory which can be used to describe the ice nuclenucle-ation efficiencies of certain well-defined aerosol species, there are also parameterizations which have been derived for either unidentified aerosols or certain subgroups of the aerosol pop-ulation. Meyers et al. (1992) used laboratory data from diffu-sion chamber experiments to derive a saturation-dependent relation for immersion freezing and deposition nucleation. The ice crystal concentrationcIN[L−1] is described by cIN=exp[−0.639+0.1296·(100(Sice−1))], (10)
which is valid for temperatures between 253 and 266 K and only depends on the supersaturation over iceSice−1. The
pa-rameterization developed by Phillips et al. (2008, 2012) links aerosol properties and ice crystal concentration in a more direct way by explicitly including the aerosol surface area and aerosol-specific freezing thresholds. The contribution of mineral dusts and metallic compounds to atmospheric ice nu-clei (cIN,DM) is given by
cIN,DM=
∞
Z
log[0.1 µm]
{1−exp[−µDM(DDM, Sice, T )]}
· dnDM
d(logDDM)
d(logDDM),
(11)
whereµDM(DDM, Sice, T )is the average number of activated
ice embryos per aerosol particle. µDM(DDM, Si, T ) is
de-fined in Phillips et al. (2008) as a function of aerosol diameter
DDM, temperatureT in◦C and the saturation over iceSice. nDMis the number mixing ratio of aerosol particles
belong-ing to the dust/metallic compounds group, given in per kg of air.
The approaches that are described in this section can all be used to develop ice nucleation parameterizations. For im-mersion freezing, several studies have investigated the per-formance of different approaches regarding the description of
ice nucleation efficiencies (Hoose and Möhler, 2012; Murray et al., 2012). For deposition nucleation, only very few stud-ies have compared different parameterizations, e.g., Wheeler and Bertram (2012). In this study deposition nucleation ex-periments conducted at the Aerosol Interaction and Dynam-ics in the Atmosphere cloud chamber (AIDA, Karlsruhe In-stitute of Technology) are presented and accompanied by a comparison of the INAS density approach with classical nucleation theory.
The manuscript is organized as follows: the instrumenta-tion used at the AIDA cloud chamber and a typical deposiinstrumenta-tion nucleation experiment are described in Sect. 2. In Sect. 3, the experimental results are presented, starting with ice-active fractions and ice nucleation active surface site densities. The impact of temperature, aerosol particle size and cooling rates on the observed deposition nucleation efficiency was investi-gated.
In this work, Arizona Test Dust (ATD, Powder Technol-ogy Inc.) is used as a substitute for naturally occurring desert dusts. ATD consists of desert dust that was washed, dried and milled in order to provide enough material in all size classes. Thus, the composition of individual ATD particles is probably more homogeneous than the composition of orig-inal desert dusts, and also the surface properties may differ from natural dusts.
Several sets of experimental runs were conducted, starting at approximately 250, 235 or 223 K. In order to investigate the impact of time dependence and variations in the aerosol size distribution on the deposition nucleation efficiency of ATD, the experimental cooling rate was varied between 0.3 and 2.9 K min−1, and also the aerosol size distribution was varied by either including or discarding particles larger than about 1 µm.
In Sect. 3, ice nucleation thresholds, INAS densities and contact angle distribution parameters as derived from the ex-perimental data are presented. Additionally, an average INAS density function is derived and compared to two empirical parameterizations (Meyers et al., 1992; Phillips et al., 2008) with regard to their sensitivity to temperature and relative hu-midity over ice.
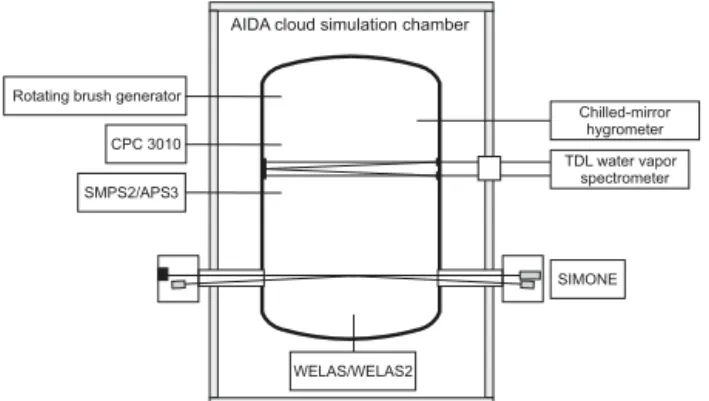
Figure 1.Schematic drawing of the AIDA cloud chamber: aerosol instrumentation (rotating brush generator, APS, SMPS, CPC3010), instruments used for characterization of the droplet/ice crystal population (welas/welas2, SIMONE) and humidity measurements (TDL, chilled-mirror hygrometer).
2 Experimental methods
The experiments presented in this study were conducted at the AIDA cloud chamber facility, located at the Karlsruhe Institute of Technology. With the AIDA cloud chamber, the ascent of air parcels can be simulated by expanding moist air within the chamber vessel. Thus, the ice nucleation prop-erties of various aerosol types can be investigated under at-mospherically relevant conditions for mixed-phase and cirrus clouds.
Figure 1 shows a schematic drawing of the AIDA cloud simulation chamber: the cloud chamber itself is enclosed by a thermally isolated housing. With two pumps the chamber volume can be expanded at controllable rates corresponding to defined cooling rates. Background aerosol concentrations within the cloud chamber were typically below 0.1 cm−3.
On the left side of Fig. 1, the aerosol instrumentation is shown. A rotating brush generator (RBG 1000, Palas) is used for dry dispersion of the dust samples. Additionally, cyclone impactors are generally used to eliminate particles larger than about 1 µm. Aerosol number concentrations are mea-sured with a condensation particle counter (CPC3010, TSI), whereas the aerosol size distribution was measured by com-bining SMPS (Scanning Mobility Particle Sizer – TSI) and APS (Aerodynamical Particle Sizer – TSI) measurements. From these data, the total aerosol surface area concentra-tion can be inferred by translating the size distribuconcentra-tion into a surface distribution after converting mobility and aerody-namic diameters into equivalent sphere diameters (Möhler et al., 2008). To this surface distribution a lognormal fit is ap-plied from which the total aerosol surface area concentration can be estimated through integrating the distribution. An ex-emplary aerosol surface distribution is shown in Fig. 2. Note that APS and SMPS data in combination cover the whole size range.
0.01 0.10 1.00 10.00
dp (µm)
1 10
dS/dlogd
p
(
µ
m
2 cm −3 )
SMPS APS Fit
Figure 2.Aerosol surface distribution for dust particles (Arizona
Test Dust) with lognormal fit:dmed, surf=0.32 µm;σsurf=1.55
(exp. IN17_04).
Values for the relative humidity over ice (RHice) and over
water (RHwater) are derived from tunable diode laser (TDL)
absorption spectroscopy measurements. Infrared absorption is measured at a wavelength aroundλ=1.37 µm and con-verted into water vapor concentrations with an accuracy of
±5 % (Fahey et al., 2014). From these water vapor concentra-tion values, the relative humidities RHwaterand RHiceare
cal-culated using the water vapor saturation pressures over liquid water and ice (Murphy and Koop, 2005) and measurements of the gas temperature in the cloud chamber. The total wa-ter content is also measured by a chilled-mirror hygromewa-ter. For the deposition nucleation experiments, however, only the TDL measurements were considered.
850 900 950 1000 p (hPa) 226 228 230 232 234 236 T (K) 226 228 230 232 234 236 T (K) 226 228 230 232 234 236 T (K) 226 228 230 232 234 236 T (K) p Tg Tw 60 80 100 120 140 RH (%) RHice RHwater 0 500 1000 1500 2000 2500 Scatter Ratio 0.0 0.2 0.4 0.6 0.8 Depolarisation 0.0 0.2 0.4 0.6 0.8 Depolarisation 0.0 0.2 0.4 0.6 0.8 Depolarisation for2back ratio depol 0.10 1.00 10.00 100.00 Cn (cm −3) Aerosol welas all welas ice welas2 ice
−50 0 50 100 150 200 250 300
Time (s)
AIDA IN17_18, 06.12.2011, HetIN_ATD_CoolingRate
b) a) c) c) d) f ice=1%
Figure 3. Time series for an AIDA expansion experiment in-vestigating deposition nucleation initiated by Arizona Test Dust.
(a)Variation of thermodynamical variables during expansion:
de-crease in gas temperatureTg and pressurep; temperature at the
walls of the vessel (Tw) stays approximately constant.(b)
Rela-tive humidity over water and over ice as derived from TDL data.
(c)Forward-to-backward scattering ratio and depolarization of the
backward-scattered light as measured by SIMONE. (d) Aerosol
number concentration (CPC3010) and ice crystal concentrations (welas/welas2).
amount of soluble components is expected to be very small (Vlasenko et al., 2005). The distinction between aerosol par-ticles and ice crystals is made by selecting a suitable size threshold. The formation of small ice crystals is also indi-cated by the change in depolarization detected by SIMONE (Schnaiter et al., 2012). SIMONE is used for observing scat-tering signals from particles crossing the pathway of a polar-ized laser beam (λ=488 nm) which horizontally traverses the cloud chamber. Besides scattering in forward (at 2◦) and near-backward (at 178◦) direction, the depolarization is mea-sured using a Glan laser prism to separate the parallel and the perpendicular polarized components of the near-backward-scattered light.
The course of a typical AIDA expansion experiment is de-picted in Fig. 3 and briefly described in the following para-graphs. The first panel shows the pressurep, which decreases during an expansion run; the gas temperatureTg within the
vessel drops simultaneously. During this expansion exper-iment, the pressure p within the AIDA vessel is lowered
from ambient pressure to approximately 800 mbar. The start-ing temperature was 235 K, whereas the minimum tempera-ture was about 226 K. Over the course of an expansion ex-periment, the temperatureTw at the chamber walls remains
virtually unchanged. Panel b depicts the relative humidity values (RHwater and RHice) as derived from the TDL
mea-surements. Water saturation is not reached during this ex-periment. Therefore, neither significant droplet activation nor immersion freezing can occur: ice crystals form almost com-pletely by deposition nucleation. The peak relative humidity over ice was about 118 %.
Figure 3c shows the forward-to-backward scattering ra-tio as derived from the SIMONE scattering signals along-side the depolarization signal measured for the backward-scattered light. The ice nucleation onset with the formation of small ice crystals is indicated by an increase in depolar-ization as well as a slightly delayed increase of the forward-to-backward scattering ratio. The increase in depolarization is a further indication that only deposition nucleation was observed because the formation of spherical droplets leads to a clear decrease in the depolarization signal. The last panel in Fig. 3 shows the aerosol concentration (measured by CPC3010) and the ice crystal concentrations (derived from welas/welas2 data). The aerosol concentration given per cu-bic centimeter decreases over the course of the experiment due to the volume expansion. The ice crystal concentration as derived from the welas/welas2 data shows a steep onset at ap-proximately RHice=103 %. The maximum fraction of
ice-active particles observed during this experiment wasfice=
40 %. Note that for the calculation of the ice nucleation ac-tive surface site densities only ice fractionsfice<10 % were
considered. Initially, the growing ice particles deplete the va-por phase only negligibly, and relative humidity over ice is an almost linear function of temperature.
Table 1 lists all experimental runs that were conducted as a part of this study. All AIDA expansion experiments de-scribed in Table 1 started at 250, 235 or 223 K. The cooling rate was varied between 0.3 and 2.9 K min−1 as indicated. Note that the cooling rate determines the timescale that is relevant to the observed ice nucleation processes and thus gives experimental access to the time dependence of hetero-geneous ice nucleation. Additionally, the aerosol surface area concentration was varied either by changing the aerosol num-ber concentration or by including particles larger than ca. 1 µm.
effi-Table 1.Overview of ice nucleation experiments with ATD as carried out at the AIDA cloud chamber; reference experiments (without ATD particles) being omitted – experiments not employing cyclone impactor stages are marked by an asterisk; experiments are grouped according to the temperatures at the beginning of each individual run.
Experiment Tstart Humidity Aerosol Median Aerosol surface Cooling Experiment
number [K] threshold concentration diameter area concentration rate name
[%] [cm−3] [µm] [µm2cm−3] [K min−1]
1 250.2 120.6 99 0.25 23 0.3 IN17_01
2 249.2 119.8 137 0.24 40 0.6 IN17_02
3 249.9 119.6 43 0.24 9 0.5 IN17_04
4 249.7 119.5 38 0.21 10 0.3 IN17_06
5 250.1 120.8 62 0.24 17 0.3 IN17_08
6 249.8 119.3 44 0.24 14 2.5 IN17_10
7 249.8 121.1 504 0.23 120 2.7 IN17_11
8 249.7 – 508 0.23 126 0.8 IN17_12
9 250.2 – 500 0.24 139 0.4 IN17_13
10 234.7 104.3 22 0.22 6 1.0 IN17_15
11 235.3 108.4 26 0.20 9 2.9 IN17_16
12 234.8 105.4 151 0.23 39 2.8 IN17_18
13 234.8 103.4 107 0.19 18 1.1 IN17_21
14 235.5 100.4 171 0.37 162 1.1 IN17_22∗
15 235.0 101.1 139 0.35 209 1.1 IN17_24∗
16 235.4 103.4 48 0.22 13 0.7 IN17_26
17 222.8 104.4 451 0.22 100 2.4 IN15_04
18 222.7 102.2 809 0.24 201 2.7 IN15_12
ciency was also investigated at colder temperatures, i.e., for expansion runs starting at approximately 223 K.
3 Experimental results
The deposition nucleation experiments described in Table 1 are used to derive different measures for the ice nucleation ef-ficiencies. In particular, humidity thresholds at ice nucleation onset, INAS densities and contact angle distribution parame-ters were analyzed.
3.1 Ice nucleation properties of ATD
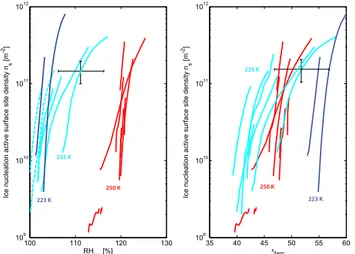
3.1.1 Thermodynamic ice nucleation thresholds Figure 4 shows trajectories in the T /RHice space for all
AIDA expansion experiments listed in Table 1. Also, the tem-perature and humidity conditions at which an ice fraction
fice=1 % was observed are represented. All trajectories in
Fig. 4 start shortly after ice formation was observed and end when ice crystal growth leads to a deviation from the initially linear increase in RHice. Note that all experimental runs
be-gan at initially subsaturated conditions with respect to ice. For the experiments starting at about 250 K, ice nucleation occurs for relative humidity values between 112 and 125 %, whereas for temperatures below 235 K ice nucleation is al-ready observed slightly above saturation with respect to ice. From Fig. 4 it can also be observed that trajectories for
ex-220 225 230 235 240 245 250
110 120 130 140 150 160 water s
aturatio n line
R
Hic
e
[
%
]
Temperature [K]
Figure 4.Trajectories of ice nucleation experiments with ice nu-cleation thresholds: trajectories are shown from the point when ice crystal concentrations first exceed background concentrations, with
only the part being shown for which RHiceincreases almost linearly
with decreasing temperature; relative humidity over ice
correspond-ing to an ice-active particle fractionfice=1 % is indicated by•for
standard experiments using cyclone impactors to define an aerosol
size cutoff, and⋆for experiments including larger particles.
periments starting below 235 K are more similar to each other than those of the experiments at warmer temperatures.
The relative humidity values (RHice), for which an ice
35 40 45 50 55 60 109
1010 1011
1012
xtherm
Ice
nu
cl
ea
ti
on
a
ct
ive
s
ur
fa
ce
si
te
den
si
ty
ns
[
m
-2]
100 110 120 130
109 1010 1011
1012
RH ice [%]
Ice
nu
cl
ea
ti
on
a
ct
ive
s
ur
fa
ce
si
te
den
si
ty
ns
[
m
-2]
223 K
235 K
250 K
223 K
235 K
250 K
Figure 5. Ice nucleation active surface site densities ns for all experiments starting at 223, 235 or 250 K: INAS densities are depicted with respect to relative humidity over ice (left) and with respect to the temperature- and saturation-dependent func-tionxtherm(T , Sice)(right) withxtherm(T , Sice)= −(T−273.2)+
(Sice−1)×100; dashed lines represent experiments including larger
particles. The error bars represent the measurement uncertainties
with1ns/ns≈35 % and1xtherm≈5.
ice nucleation thresholds in this study. These ice nucleation thresholds are depicted in Fig. 4 for all experiments. For the experiments starting at 250 K, the ice nucleation thresholds scatter around RHice≈120 %. Note that for two experiments
the ice fraction remained below fice=1 %. The humidity
threshold values suggest that warm-temperature deposition nucleation does not depend primarily on the cooling rate. At lower temperatures (Tstart≈235 K and Tstart≈223 K),
the ice nucleation thresholds mostly scatter around RHice≈
104 %. Only the two experiments which investigated the in-fluence of larger particles (exps. 14 and 15) are characterized by ice nucleation starting already slightly above saturation with respect to ice. This finding agrees with other studies finding that larger particles lower the observed ice nucleation thresholds (e.g., Welti et al., 2009).
It should be noted that the spread of the observed humid-ity threshold values – considering experiments with a simi-lar starting temperature – lies within the measurement uncer-tainty1RHice= ±(3–5)%. Only for experiments including
larger particles a shift towards lower ice nucleation thresh-olds is observed. Therefore, deposition nucleation seems to be only weakly time dependent over the range of variations in cooling rate and aerosol surface area concentrations in-vestigated in this study. If ice nucleation had to be described by a time-dependent heterogeneous nucleation rate approach, the freezing thresholds would have been shifted towards lower relative humidities for low cooling rates. Because nei-ther a completely singular behavior (i.e., always the same ice nucleation threshold) nor a relation between cooling rate and thresholds could be deduced from our measurements, it is
35 40 45 50 55 60
108
109
1010 1011
1012
1013
xtherm
Ice
nu
cl
ea
ti
on
a
ct
ive
s
ur
fa
ce
si
te
den
si
ty
[
m
-2]
ns(xtherm)=1.88∙105∙exp(0.2659xtherm) [m-2]
Figure 6.Ice nucleation active surface site densities as in Fig. 5 with exponential fit function (excluding the experiments starting at Tstart=223 K); the grey dashed lines indicate deviations from the fitting function by an order of magnitude.
not possible to directly infer the influence of different cool-ing rates (correspondcool-ing to ice nucleation timescales) on the observed ice fraction. Therefore, the impact of time depen-dence will be investigated in more detail in the following sub-sections.
Figure 4 also shows that the ice nucleation thresholds are clearly divided into two groups depending on the ambi-ent temperature, with higher humidity thresholds atTstart≈
250 K and lower ice nucleation thresholds for the exper-iments at colder temperatures (Tstart≈235 K and Tstart≈
223 K). Therefore, it can be also concluded that the deposi-tion nucleadeposi-tion efficiency of ATD particles depends not only on relative humidity, but also on temperature.
3.1.2 Ice nucleation active surface site densities
The ice nucleation efficiency can also be expressed as the INAS density averaged over the whole aerosol population for each experiment. The INAS density values (Niemand et al., 2012) are calculated from
ns=nice/Aaer [m−2] (12)
with the ice crystal concentration nice [cm−3] and the
to-tal aerosol surface area concentrationAaer[µm2cm−3]. Note
thatns can also be interpreted as a way of normalizing ice
crystal concentrations.
The INAS densities are depicted in Fig. 5 with respect to RHice(left) or with respect to a functionxtherm(right) which
is defined as
xtherm= −(T−273.2)+(Sice−1)×100 (13)
Note that in Eq. (13),T represents the numerical value of the average temperature within the cloud chamber in [K] and is therefore dimensionless.Sice corresponds to the ice
225 230 235 240 245 100
105 110 115 120 125 130 135 140
Temperature [K]
R
Hic
e
[
%
]
polydisp., Möhler et al. (2006) 400 nm, Welti et al. (2009) 100 nm, Welti et al. (2009) 200 nm, Sullivan et al. (2009) 300 nm, Köhler et al. (2010)
9.5 10 10.5 11 11.5 12
log10(ns)
Figure 7.ns trajectories derived from experimental runs (see Ta-ble 1) – the arrow indicates decreasing temperature and
increas-ing RHiceduring expansion experiments (see Fig. 4); colored lines
correspond to isolines of the fitted INAS density (log10(ns)) from
Fig. 6 – symbols indicate ice nucleation active surface site densi-ties derived from experimental studies by other authors (same color code as for isolines).
and simple way to describe the combined dependence of deposition nucleation on temperature and relative humidity over ice within a certain range of thermodynamic conditions. More general formulations of Eq. (13) would read
xtherm= −α(T )·(T−273.2)+(1−α(T ))·(Sice−1)×100 (14)
or
xtherm= −α(T )·(T−273.2)+β(T )·(Sice−1)×100, (15)
with α(T ) andβ(T )being temperature-dependent weight-ing coefficients. However, the improvement of fits relyweight-ing on Eqs. (14) or (15) was only marginal for the temperature and humidity conditions investigated in this study. Note also that
xthermas a linear function in humidity and temperature is
as-sumed to be only strictly valid between 226 and 250 K. Other studies show that the ns isolines for deposition nucleation
caused by materials such as hematite are strongly tempera-ture dependent between 223 and 237 K, but not between 223 and 213 K (Hiranuma et al., 2014). Thus, these results sug-gest that differentxthermor other approaches might be needed
within different temperature regimes. Also, deposition nucle-ation close to water saturnucle-ation may coincide with pore con-densation freezing (Marcolli et al., 2014).
In Fig. 5 (left) the two groups of experiments starting at 235, 223 or 250 K are clearly separated. Thus, in agree-ment with the behavior of the ice nucleation thresholds, Fig. 5 (left) confirms that, within the temperature range be-tween 223 and 250 K, deposition nucleation as a process does not only depend on RHice but is also strongly
con-trolled by temperature. Also, experiments including larger particles (dashed lines in Fig. 5) are characterized by sim-ilar INAS densities to the experiments targeting a narrow
110 120 130 140 150
106 107 108 109 1010 1011 1012 1013 1014 1015
RHice [%]
Ice
nu
cl
ea
ti
on
a
ct
ive
s
ur
fa
ce
si
te
den
si
ty
[
m
-2]
T = 220 K
T = 225 K
T = 230 K
T = 235 K
T = 240 K
T = 245 K
Figure 8.Comparison between ice nucleation active surface site densities derived from this work (colored lines), the dust-adapted parameterization by Phillips et al. (2012) (colored dashed lines) and the parameterization by Meyers et al. (1992) (black dashed line); for the Phillips parameterization, colors indicate the same temperatures as for our parameterization, whereas the Meyers parameterization
is not temperature dependent (Aaer=2×10⁻⁶m2m−3) – the grey
dashed line indicates the upper limit fornsvalues derived from
ex-pansion experiments presented in this study.
particle size distribution. Therefore, within this experimen-tal setup, aerosol particle size does not impact the observed INAS density values much. This finding supports the concept of a surface-area-related density of ice nucleation sites.
By representing the INAS densities as a function of rela-tive humidity and temperature (Fig. 5, right), the INAS tra-jectories representing warm-temperature deposition nucle-ation fall much closer together, which means that deposition nucleation can be described by the change inxthermas defined
by Eq. (13). Note that the length of eachns trajectory
The ns trajectories as shown in Fig. 5 are afflicted with
two sources of uncertainty, of which the ns values
them-selves are the first source. The measurement uncertainty of
ns is determined by the uncertainties ofnice andAaer, with 1nice/nice≈25 % and1Aaer/Aaer≈25 %, which results in 1ns/ns≈35 %. Secondly, the position of each trajectory
within the T /RHice space is affected by the uncertainties 1T = ±0.3 K and 1RHice up to 5 %. These uncertainties
then translate into an uncertainty of the thermodynamic vari-ablextherm, with1xtherm≈5. Figure 5 shows that the
experi-ments at higher relative humidities over ice (corresponding to warmer starting temperatures at about 250 K) are character-ized by a much larger variation in the slopes of INAS density trajectories than the experiments at lower relative humidities over ice (corresponding to colder temperatures).
3.2 Ice nucleation active surface site density approach and comparison to other parameterizations
In this section, we will first present an overall INAS den-sity fit to all measurements above 226 K. This means that the two measurements starting at 223 K will be excluded. The average INAS density function is then compared to the dust-adapted parameterization by Phillips et al. (2012) and the parameterization by Meyers et al. (1992), which does not distinguish between different aerosol species. Complement-ing the INAS density approach, also results from fittComplement-ing nu-cleation rates according to classical nunu-cleation theory to the measured ice fractions are presented. Additionally, in the last subsection, the time dependence of deposition nucleation ini-tiated by ATD particles is expressed as either a linear source term or a time-dependent exponential function.
3.2.1 General ice nucleation active surface density approach
Figure 5 shows that thensvalues observed for temperatures
above 226 K do not diverge by more than 1 order of magni-tude, which suggests that the INAS density values may be de-scribed by an averagensfunction. According to least-square
fitting, all measurements above 226 K can be described by the fit function
ns(xtherm)=1.88×10⁵·exp(0.2659·xtherm)[m−2]. (16)
The measurements together with the fit (r2=0.49) are de-picted in Fig. 6. Note that the quality of the fit only slightly improves by definingxthermas
xtherm= −1.085·(T−273.2)+0.815·(Sice−1)×100 (17)
instead of using Eq. (13).
Figure 7 shows all measured ns values corresponding to
the T /RHice trajectories of each experimental run listed in
Table 1. Isolines with constant INAS density values indi-cate the increase of the fit functionns(xtherm)with
supercool-ing and relative humidity over ice. The measurement uncer-tainties are given by1T = ±0.3 K, 1RHice up to 5 % and 1ns/ns≈35 %.
For comparison,nsvalues from other experimental studies
(see references) investigating the ice nucleation properties of ATD in the deposition nucleation mode are shown. Note that the experimental setups which were used to derive the INAS densities differ among these studies. INAS densities calcu-lated for previous AIDA cloud chamber experiments with ATD agree well withns(xtherm)from Eq. (16) (Möhler et al.,
2006).
INAS densities were also derived from ice fractionsfice
observed in studies investigating the deposition nucleation mode properties of monodisperse ATD particles (Koehler et al., 2010; Sullivan et al., 2010; Welti et al., 2009) with
ns=fice/(π d2), (18)
whered is the diameter of the size-selected ATD particles. The particle size selection in the aforementioned studies was achieved by using differential mobility analyzers (DMAs). Note that in Fig. 7 the nominal particle diameters of the size-selected particles are indicated. The INAS densities de-rived from the studies by Koehler et al. (2010); Sullivan et al. (2010) and Welti et al. (2009) generally differ by more than 1 order of magnitude from our fittedns(xtherm). In the study
by Koehler et al. (2010) a continuous flow diffusion cham-ber was used to investigate the ice nucleation properties of ATD particles with selected diameters of 200, 300 or 400 nm. A continuous flow diffusion chamber was also used by Sul-livan et al. (2010), who investigated monodisperse ATD par-ticles (d=200 nm). Welti et al. (2009) investigated the de-position nucleation properties of size-selected ATD particles with the Zurich Ice Nucleation Chamber (ZINC). In all stud-ies, the ATD sample was dispersed by using either a rotating brush generator or a fluidized bed generator. The INAS den-sity values derived from the aforementioned studies are much lower than the INAS densities derived within this experimen-tal study. These deviations might be partially explained by differences in the temperature and humidity profiles com-pared to the AIDA experiments.
3.2.2 Comparison to other parameterizations
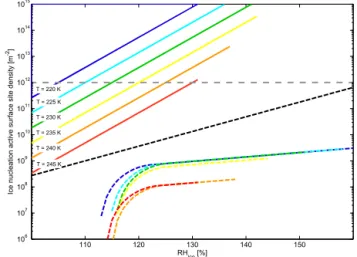
Figure 8 shows a comparison between the INAS densities from the ns(xtherm)parameterization (Eq. 16), the ice
for-mation as parameterized by Phillips et al. (2008, 2012) and the ice crystal concentration derived by using the purely humidity-dependent parameterization proposed by Meyers et al. (1992). For our calculations we assume that the ice was formed on a generic aerosol population with an aerosol sur-face area concentration of Aaer=2×10⁻⁶m2m−3 as
pro-posed in Phillips et al. (2012). The grey dashed line in Fig. 8 indicates the upper limit of observed ice nucleation active surface site densities in this study (fice<10 %). The INAS
deposi-0 500 1000 205 210 215 220 225 230 235 Te m pera ture [ K ] Time [s]
0 500 1000
100 110 120 130 140 150 R Hic e [ % ] Time [s]
0 500 1000
10-4 10-3 10-2 10-1 100 Ice f ra ct io n Time [s]
0 500 1000
40 50 60 70 xthe rm Time [s]
40 50 60 70
10-4 10-3 10-2 10-1 100 x therm Ice f ra ct io
n c = 1 cm-3
; d = 0.2 um
c = 100 cm-3; d = 0.2 um
c = 1 cm-3
; d = 0.4 um
c = 100 cm-3
; d = 0.4 um
0 500 1000
10-4 10-3 10-2 10-1 100 Ice f ra ct io n Time [s]
40 50 60 70
10-4 10-3 10-2 10-1 100 x therm Ice f ra ct io n c)
0 500 1000
10-4 10-3 10-2 10-1 100 Ice f ra ct io n Time [s]
40 50 60 70
10-4 10-3 10-2 10-1 100 x therm Ice f ra ct io n a) b)
w3= 5.0 ms
-1
w2 = 0.5 ms -1 w1 = 0.05 ms -1
d)
e)
g) h) i) j)
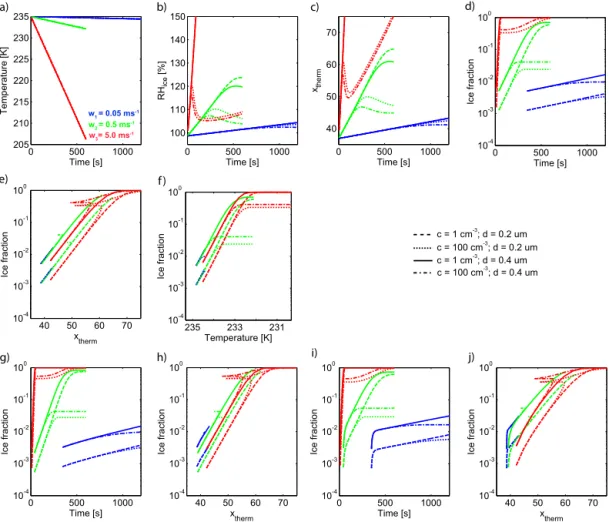
231 233 235 10-4 10-3 10-2 10-1 100 Temperature [K] Ice f ra ct io n f )
Figure 9.Time series for calculations with the box model ACPIM: parcel runs with varying updraft velocities (indicated by color as noted in
panela) for investigating the influence of aerosol concentration and the aerosol median diameter on the observed ice-active fractions; all runs
start atT=235 K andSwat=0.68 – the first panels(a–c)show temperature, relative humidity and the composite variablextherm; for the
subfigures (d), (e) and (f) ice nucleation is parameterized by Eq. (16), whereas for (g) and (h) Eq. (19) was used and for (i) and (j) Eq. (21)
was used .
tion nucleation occurring only below water saturation. Note that for this comparison not the absolute INAS density val-ues are considered to be most relevant but rather the slopes of thenscurves, because the absolute values also depend on
the assumed aerosol surface area concentrationAaer.
Never-theless, in a recent immersion freezing study ice crystal con-centrations derived from an INAS density parameterization based on cloud chamber experiments with desert dusts were observed to differ by more than 1 order of magnitude from estimates made with the Phillips parameterization for immer-sion freezing at temperatures above 255 K (Niemand et al., 2012).
For deposition nucleation, the parameterizations by Phillips et al. (2012) and Meyers et al. (1992) predict INAS densities with significantly smaller slopes (i.e., humidity de-pendence) compared to the results from our ATD measure-ments. Additionally, the temperature dependence of the pa-rameterization by Phillips et al. (2012) is weaker, whereas the parameterization by Meyers et al. (1992) is a priori, not
considering any changes in supercooling. Applied in climate models, paramaterizations describing deposition nucleation without considering the temperature dependence will predict largely deviating ice crystal concentrations in comparison to calculations based on our parameterization.
3.2.3 Comparison to classical nucleation theory Classical nucleation theory can be used to fit results from deposition nucleation experiments with ATD particles. For each experimental run, the observed ice nucleation efficiency can be expressed by an apparent median contact angleµθ
and an apparent contact angle distribution widthσθ. These
parametersµθandσθcan be derived from using Eqs. (5), (8)
and (9) to fit the observed ice fractions.
For most experiments, the aerosol size distribution was assumed to be lognormal, with the median diameterµd=
0.23 µm and the geometric size distribution widthσd=1.56.
larger particle being present) were the aerosol size distribu-tion parameters chosen to beµd=0.35 µm andσd=1.73.
For the experiments starting at about 250 K, the median contact angles µθ vary between 17 and 48◦ (excluding one
outlier), whereas for experimental runs starting at about 235 or 223 K the median contact anglesµθ were found to scatter
between 25 and 39◦and between 8 and 13◦.
For deposition nucleation observed during experiments starting at higher temperatures around 250 K, the contact an-gle distribution parameters which best described all exper-imental runs (r2=0.48) were µθ =22.1◦ andσθ=0.095.
For deposition nucleation at lower temperatures, the con-tact angle parameters were found to be µθ =36.2◦ and σθ =0.520 (r2=0.52) for experiments atTstart≈235 K, and µθ=16.9◦andσθ=0.540 (r2=0.89) atTstart≈223 K.
The contact angle parameters derived from the ATD ex-periments presented in this study vary considerably between different experimental runs and also slightly depend on the thermodynamic conditions (i.e., temperature and relative hu-midity over ice). The nucleation rate approach with the as-sumption of a lognormally distributed range of contact an-gles did not result in a consistent set of fit parameters for the available data set.
Note that, even though both T andSice enter the
classi-cal nucleation theory formulation of the nucleation rateJhet,
the dependence onSiceis much stronger than the dependence
onT. This can be seen, e.g., in Fig. A1 of Hoose and Möh-ler (2012) by the near-horizontal isolines ofJhet. The
experi-mentally observedT andSicedependence in this study,
how-ever, is markedly different from the CNT prediction. More experimental studies in a wider range of tempera-ture, aerosol surface area and cooling rate may provide a bet-ter basis for constraining the results from nucleation rate fits to measured ice formation rates.
3.3 Time dependence of deposition nucleation and extension of the ice nucleation active surface site density concept
Ice nucleation active surface site densities as defined by Eq. (12) depend only on temperature and relative humidity over ice. Considering time-dependent ice formation in the
ns(xtherm)fits requires an extension of the functional form
as stated in Eq. (16) by time-dependent terms. Two different approaches are used for describing the time-dependent con-tribution to ice formation.
Time dependent ice nucleation may be described by
ns=ens+a3·t (19)
=a1·exp(a2·xtherm)+a3·t [m−2], (20)
where xtherm is defined by Eq. (13) and t [s] is the time
starting from the first observation of ice crystals, neglecting ice formation below the detection limit. To derive the coeffi-cients in Eq. (19), only the first 25 s after ice formation was
Table 2.Overview of updraft velocities and aerosol properties as used for the trajectories calculated with the box model ACPIM.
Aerosol concentration [cm−3] 1 100
Aerosol particle median diameter [µm] 0.2 0.4
Updraft velocityw[m s−1] 0.05 0.5 5.0
observed are considered. The first part of Eq. (19), expressed asens, describes the formation of ice crystals caused by the
“best” ice nuclei among the dust particles. Upon reaching certain thermodynamic thresholds (i.e.,xtherm values) these
particles initiate ice nucleation immediately within the tem-poral resolution of our experimental setup. The linear source term then describes the formation of ice by the less efficient ice nuclei components, which (at comparablextherm
condi-tions) have lower freezing probabilities and are only acti-vated after a certain period of time. Therefore, this linear contribution will become apparent especially at low cool-ing rates. The coefficients in Eq. (19) are determined from least-square fitting asa1=1.9×10³[m−2],a2=0.363 and a3=3.7×10⁶[m−2s−1] (r2=0.74).
A second time dependence parameterization assumes that there is a certain ice nucleation active surface site den-sityens(xtherm)towards which the measured INAS densities
would converge eventually at a certain xtherm value. This
time-dependent behavior is then described by
ns=ens·(1−exp(−b3·t )) (21)
=b1·exp(b2·xtherm)·(1−exp(−b3·t )) [m−2]. (22)
Again, the coefficients are derived from the measurements for ice fractions smaller thanfice<10 %. The coefficients in
Eq. (21) are determined asb1=6.1·105[m−2],b2=0.254
andb3=0.065 [s−1] (r2=0.70).
Note, however, that Eqs. (19) and (21) need to be viewed as very simplistic approaches. Nevertheless, these equations could be used to evaluate the time dependence of ice nucle-ation initiated by other particle species.
3.3.1 Relevance of the time-dependent source term The box model ACPIM, which was developed at the Uni-versity of Manchester (Connolly et al., 2009), was used to calculate the ice formation within an ascending air parcel, using a prescribed ice nucleation parameterization. The ice nucleation parameterizations as described by Eqs. (16), (19) and (21) were analyzed for different updraft velocities and aerosol parameters as described in Table 2. Each parcel run is initialized at cirrus cloud conditions withT =235 K,p=
550 mbar and RHwater=68 %. The parcel is then allowed to
develop fort=600 s or fort=1200 s at the lowest updraft velocity.
change in the temperature- and saturation-dependent func-tionxtherm as defined in Eq. (13) (Fig. 9c). The ice fractions
predicted by Eq. (16) (without time dependence) for different updraft velocities are depicted as a function of time (Fig. 9d) and in relation to the function xtherm (Fig. 9f) and in rela-tion to temperature (Fig. 9e). For each updraft velocity value the trajectories were calculated for all aerosol parameters as described in Table 2.
– For the lowest updraft velocity (w1=0.05 m s−1), the
reduction in temperature is less than 1 K over the whole simulated time period. Likewise, the increase in rel-ative humidity over ice is less than 5 %. Thus, only a small supersaturation is reached. The temperature-and saturation-dependent functionxthermincreases from xtherm=37 to xtherm=42. After1t=1200 s, the
ob-served ice fractions remain below 2 %.
– For intermediate updraft velocities (w2=0.5 m s−1),
the parcels are cooled to 232 K and reach peak rela-tive humidity values of RHice=110 % at high aerosol
concentrations and RHice=120 % at low aerosol
con-centrations. The increase inxthermis strongly driven by
the increase in relative humidity, and thus xtherm can
reach peak values of xtherm=50 andxtherm=65. The
observed ice fractions are strongly influenced by the aerosol concentrations and vary between 2 and 70 %. – At very large updraft velocities (w3=5.0 m s−1),
tem-peratures as low as 206 K are reached within 600 s. However, the determining factor for these simulations is the peak relative humidity, which is related to the pre-scribed aerosol concentration. At low aerosol concen-trations, all aerosol particles are activated within less than 100 s. After the ice activation process is completed, the relative humidity value increases further to values larger than RHice=200 %. For high aerosol
concen-trations, the conversion of all aerosol particles into ice crystals is only achieved at the end of the parcel run since the peak relative humidity (RHice=120 %) is
al-ready reached within the first 100 s of the simulation while ice formation slows down after having reached peak relative humidity.
The graphs in Fig. 9g–j show simulations similar to those depicted in Fig. 9d, e and f. However, for the simulations pre-sented in Fig. 9g–j the ice nucleation process was assumed to be time dependent according to Eqs. (19) and (21). Note that the temperature and relative humidity trajectories are very similar to the runs without time-dependent ice nucle-ation (Fig. 9a and b). Likewise, the evolution ofxthermis also
similar.
When comparing the predicted ice fractions at the end of the updraft periods, the first time-dependent ice nucle-ation parameteriznucle-ation (Eq. 19) does not produce results de-viating much from those based on Eq. (16). Only the ini-tial increase of the observed ice fractions is steeper than for
purely humidity- and temperature-dependent ice formation. The second time-dependent ice nucleation parameterization (Eq. 21) generally predicts ice-active fractions being higher than the purelyxtherm-dependent parameterization by a
fac-tor of 2, which is largely due to the coefficientb1in Eq. (21).
Note that the time-dependent ice nucleation parameterization described by Eq. (21) predicts rapid ice nucleation at low ice-active particle fractions. The measurements shown in Fig. 5 at least partially corroborate this result.
From this simple case study it can be concluded that the effect of time dependence is generally small and may only be relevant at low to moderate updraft velocities and for small ice-active particle fractions.
4 Conclusions and discussion
Deposition nucleation on ATD particles was investigated with AIDA cloud chamber experiments, following expansion trajectories starting from ice-subsaturated conditions at about 250, 235 or 223 K. The aerosol surface area concentrations and cooling rates were varied for all expansion experiments, because one of the goals of this experimental study was to determine the relevance of timescales to the observed ice nu-cleation efficiencies.
The ice nucleation efficiency observed for each experi-mental run was quantified by the measured ice nucleation thresholds atfice=1 %, by deriving the INAS densities and
by fitting the contact angle distribution parameters using nu-cleation rate formulations.
Ice nucleation onsets (fice=1 %) were observed at
rela-tive humidities over ice between 118 and 121 % at warmer temperatures (Tstart≈250 K), whereas ice activation of 1 %
of all ATD particles occurred between 101 and 107 % at colder temperatures (Tstart below 235 K). No direct relation
between ice nucleation thresholds and cooling rates could be deduced from the experimental data. The time depen-dence of deposition nucleation was presumably small and could not be quantified from the ice nucleation thresholds. It should be noted that the observed freezing thresholds could also be partly explained by a freezing mechanism other than deposition nucleation, namely pore condensation freezing. Pore condensation freezing was proposed by Marcolli et al. (2014) as an explanation for freezing below water satura-tion. Note, however, that in our experimental setup we can-not clearly distinguish between these freezing mechanisms and thus make the assumption that ice nucleation is mostly caused by deposition nucleation.
INAS densities were derived for all experiments and were found to depend both on temperatureT and the ice saturation ratioSicewith
where the temperature- and saturation-dependent function
xthermis defined by
xtherm= −(T−273.2)+(Sice−1)×100. (24)
The INAS density approach was found to be independent of shifts in the particle size distribution, i.e., from shifting the median diameter from dmed≈0.23 µm to dmed≈0.35 µm.
As a parameterization for numerical models, the INAS den-sity relation is only strictly valid for temperatures between 226 and 250 K and for humidities with 1< Sice<1.2.
Espe-cially at temperatures below 220 K,xtherm may be better
de-scribed by a relation different from Eq. (24). Note that an ex-trapolation to lower temperatures relying on Eq. (24) would also predict very high INAS densities already at Sice close
to 1. To describe deposition nucleation even more precisely,
xtherm could be parameterized as a higher-order function of
temperature and relative humidity over ice in order to achieve a better match with observations, both at low temperatures above ice saturation and at higher temperatures close to wa-ter saturation. Deposition nucleation at higher temperatures should be investigated for a wider range of thermodynamic conditions in order to better characterize the dependence of
xthermon temperature and relative humidity and also for
natu-ral minenatu-ral dusts which are typically less ice-active than ATD particles (Möhler et al., 2006). Ice crystal concentrations pre-dicted byns(xtherm)match the observed ice crystal
concen-trations for most experiments of this study within 1 order of magnitude regardless of the cooling rate or the aerosol sur-face area concentration.
In comparison to INAS density values derived from other empirical parameterizations or laboratory studies, the ice nu-cleation efficiency of ATD in deposition nunu-cleation mode as derived from AIDA cloud chamber measurements is larger by at least 1 order of magnitude. Note that, in contrast to the parameterization derived from our measurements, the param-eterizations by Phillips et al. (2012) and Meyers et al. (1992) suggest a much weaker or no temperature dependence of de-position nucleation.
Applying classical nucleation theory to the observed ice fractions yields average contact angle distribution param-eters. For high-temperature deposition nucleation (Tstart≈
250 K) the contact angle distribution parameters which best described all experimental runs (r2=0.48) wereµθ=22.1◦
and σθ =0.095. For deposition nucleation at lower
tem-peratures, the contact angle parameters were found to be
µθ=36.2◦ andσθ=0.520 (r2=0.52) for experiments at Tstart≈235 K, and µθ=16.9◦ andσθ=0.540 (r2=0.89)
for Tstart≈220 K. The large variability of the contact angle
distribution parameters suggests that the application of clas-sical nucleation theory to deposition nucleation by certain aerosol species such as mineral dust would require a detailed investigation of the contact angle distribution parameters for different thermodynamic conditions. Additionally, the con-tribution of pore condensation freezing to heterogeneous
nu-cleation observed close to water saturation might lead to dif-ficulties with applying classical nucleation theory directly.
The time dependence of deposition nucleation initiated by ATD particles was investigated by assuming that time depen-dence might be represented by either a linear source terma3·t
or a factor describing the delayed activation of ice nucleation active surface sites according to 1−exp(−b3·t ). Note that,
fort→ ∞,ns is limited by two factors: first, the activation
of all aerosol particles and, secondly, by the size of an ac-tive site which is assumed to coverAsite=10 nm2(Marcolli
et al., 2007), with the surface area covered by active sites not exceeding the available aerosol surface area.
To evaluate the potential role of time-dependent ice nucle-ation in the atmosphere, the box model ACPIM was used to simulate the ascent of air parcels. For these case stud-ies, ice nucleation was described by a purely thermody-namically driven INAS density function and two parame-terizations with additional dependent terms. The time-dependent terms are potentially important at low to moderate updraft velocities and for small ice fractions. However, the results obtained from the three different parameterizations did not differ much from each other under the prescribed ex-perimental conditions. It should be noted, however, that the modeling case studies in this work are based on ice nucle-ation results for ATD obtained under certain thermodynamic conditions.
The ATD experiments and modeling studies presented in this work are supposed to be a first step in rigorously inves-tigating deposition nucleation over a wide temperature and saturation range in order to gain a better understanding of the factors which are relevant for deposition nucleation. This knowledge was then used to develop a metric which can be easily employed for the comparative analysis of other het-erogeneous nucleation studies. Further investigations of at-mospherically relevant dust samples are needed in order to better inform future parameterizations describing deposition ice nucleation.
Acknowledgements. Support by the AIDA technician team is
grate-fully acknowledged.
Part of this research was funded by the Helmholtz Association through the President’s Initiative and Networking Fund and the research program Atmosphere and Climate (ATMO).
The service charges for this open access publication have been covered by a Research Centre of the Helmholtz Association.
References
Broadley, S. L., Murray, B. J., Herbert, R. J., Atkinson, J. D., Dob-bie, S., Malkin, T. L., Condliffe, E., and Neve, L.: Immersion mode heterogeneous ice nucleation by an illite rich powder rep-resentative of atmospheric mineral dust, Atmos. Chem. Phys., 12, 287–307, doi:10.5194/acp-12-287-2012, 2012.
Chen, J.-P., Hazra, A., and Levin, Z.: Parameterizing ice nu-cleation rates using contact angle and activation energy de-rived from laboratory data, Atmos. Chem. Phys., 8, 7431–7449, doi:10.5194/acp-8-7431-2008, 2008.
Connolly, P. J., Möhler, O., Field, P. R., Saathoff, H., Burgess, R., Choularton, T., and Gallagher, M.: Studies of heterogeneous freezing by three different desert dust samples, Atmos. Chem. Phys., 9, 2805–2824, doi:10.5194/acp-9-2805-2009, 2009. Eastwood, M. L., Cremel, S., Wheeler, M., Murray, B. J.,
Gi-rard, E., and Bertram, A. K.: Effects of sulfuric acid and ammonium sulfate coatings on the ice nucleation proper-ties of kaolinite particles, Geophys. Res. Lett., 36, L02811, doi:10.1029/2008GL035997, 2009.
Fahey, D. W., Gao, R.-S., Möhler, O., Saathoff, H., Schiller, C., Ebert, V., Krämer, M., Peter, T., Amarouche, N., Avallone, L. M., Bauer, R., Bozóki, Z., Christensen, L. E., Davis, S. M., Durry, G., Dyroff, C., Herman, R. L., Hunsmann, S., Khaykin, S. M., Mack-rodt, P., Meyer, J., Smith, J. B., Spelten, N., Troy, R. F., Vömel, H., Wagner, S., and Wienhold, F. G.: The AquaVIT-1 intercom-parison of atmospheric water vapor measurement techniques, At-mos. Meas. Tech. Discuss., 7, 3159–3251, doi:10.5194/amtd-7-3159-2014, 2014.
Fletcher, N. H.: Active sites and ice crystal nucleation,
J. Atmos. Sci., 26, 1266–1271,
doi:10.1175/1520-0469(1969)026<1266:ASAICN>2.0.CO;2, 1969.
Hiranuma, N. and Paukert, M. and Steinke, I. and Zhang, K. and Kulkarni, G. and Hoose, C. and Schnaiter, M. and Saathoff, H. and Möhler, O.: A comprehensive parameterization of het-erogeneous ice nucleation of dust surrogate: laboratory study with hematite particles and its application to atmospheric mod-els, Atmos. Chem. Phys., 23, 13145–13158, doi:acp-14-13145-2014,2014.
Hoose, C. and Möhler, O.: Heterogeneous ice nucleation on atmo-spheric aerosols: a review of results from laboratory experiments, Atmos. Chem. Phys., 12, 9817–9854, doi:10.5194/acp-12-9817-2012, 2012.
Koehler, K. A., Kreidenweis, S. M., DeMott, P. J., Petters, M. D., Prenni, A. J., and Möhler, O.: Laboratory investigations of the impact of mineral dust aerosol on cold cloud formation, Atmos. Chem. Phys., 10, 11955–11968, doi:10.5194/acp-10-11955-2010, 2010.
Lüönd, F., Stetzer, O., Welti, A., and Lohmann, U.: Experimental study on the ice nucleation ability of size-selected kaolinite par-ticles in the immersion mode, J. Geophys. Res., 115, D14201, doi:10.1029/2009JD012959, 2010.
Marcolli, C., Gedamke, S., Peter, T., and Zobrist, B.: Efficiency of immersion mode ice nucleation on surrogates of mineral dust, Atmos. Chem. Phys., 7, 5081–5091, doi:10.5194/acp-7-5081-2007, 2007.
Marcolli, C.: Deposition nucleation viewed as homogeneous or im-mersion freezing in pores and cavities, Atmos. Chem. Phys., 4, 2071–2104, doi:10.5194/acp-14-2071-2014, 2014.
Meyers, M. P., DeMott, P. J., and Cotton, W. R.: New pri-mary ice-nucleation parameterizations in an explicit cloud model, J. Appl. Meteorol., 31, 708–721, doi:10.1175/1520-0450(1992)031<0708:NPINPI>2.0.CO;2, 1992.
Möhler, O., Field, P. R., Connolly, P., Benz, S., Saathoff, H., Schnaiter, M., Wagner, R., Cotton, R., Krämer, M., Mangold, A., and Heymsfield, A. J.: Efficiency of the deposition mode ice nu-cleation on mineral dust particles, Atmos. Chem. Phys., 6, 3007– 3021, doi:10.5194/acp-6-3007-2006, 2006.
Möhler, O., Benz, S., Saathoff, H., Schnaiter, M., Wagner, R., Schneider, J., Walter, S., Ebert, V., and Wagner, S.: The fect of organic coating on the heterogeneous ice nucleation ef-ficiency of mineral dust aerosols, Environ. Res. Lett., 3, 025007, doi:10.1088/1748-9326/3/2/025007, 2008.
Murphy, D. M. and Koop, T.: Review of the vapour pressures of ice and supercooled water for atmospheric applications, Q. J. Roy. Meteor. Soc., 131, 1539–1565, doi:10.1256/qj.04.94, 2005. Murray, B. J., Broadley, S. L., Wilson, T. W., Atkinson, J. D.,
and Wills, R. H.: Heterogeneous freezing of water droplets con-taining kaolinite particles, Atmos. Chem. Phys., 11, 4191–4207, doi:10.5194/acp-11-4191-2011, 2011.
Murray, B. J., O’Sullivan, D., Atkinson, J. D., and Webb, M. E.: Ice nucleation by particles immersed in supercooled cloud droplets, Chem. Soc. Rev., 41, 6519–6554, doi:10.1039/c2cs35200a, 2012.
Niedermeier, D., Shaw, R. A., Hartmann, S., Wex, H., Clauss, T., Voigtländer, J., and Stratmann, F.: Heterogeneous ice nucleation: exploring the transition from stochastic to singular freezing be-havior, Atmos. Chem. Phys., 11, 8767–8775, doi:10.5194/acp-11-8767-2011, 2011.
Niemand, M., Möhler, M., Vogel, B., Vogel, H., Hoose, C., Con-nolly, P., Klein, H., Bingemer, H., DeMott, P., Skrotzki, J., and Leisner, T.: A particle-surface-area based parameterization of immersion freezing on desert dust particles, J. Atmos. Sci., 69, 3077–3092, doi:10.1175/JAS-D-11-0249.1, 2012.
Phillips, V. T. J., DeMott, P. J., and Andronache, C.: An empiri-cal parameterization of heterogeneous ice nucleation for multi-ple chemical species of aerosol, J. Atmos. Sci., 65, 2757–2783, doi:10.1175/2007JAS2546.1, 2008.
Phillips, V. T. J., DeMott, P. J., Andronache, C., Pratt, K. A., Prather, K. A., Subramanian, R., and Twohy, C.: Improvements to an empirical parameterization of heterogeneous ice nucleation and its comparison with observations, J. Atmos. Sci., 70, 378– 409, doi:10.1175/JAS-D-12-080.1, 2012.
Pruppacher, H. R. and Klett, J. D.: Microphysics of Clouds and Precipitation, Atmospheric and Oceanographic Sciences Library, 2nd rev., and enl. edn., 18, Kluwer, Dordrecht, 1997.
Rigg, Y. J., Alpert, P. A., and Knopf, D. A.: Immersion freezing of water and aqueous ammonium sulfate droplets initiated by humic-like substances as a function of water activity, Atmos. Chem. Phys., 13, 6603–6622, doi:10.5194/acp-13-6603-2013, 2013.
Sullivan, R. C., Miñambres, L., DeMott, P. J., Prenni, A. J., Car-rico, C. M., Levin, E. J. T., and Kreidenweis, S. M.: Chemi-cal processing does not always impair heterogeneous ice nucle-ation of mineral dust particles, Geophys. Res. Lett., 37, L24805, doi:10.1029/2010GL045540, 2010.
Vali, G.: Nucleation terminology, J. Aerosol Sci., 16, 575–576, 1985.
Vali, G.: Freezing rate due to heterogeneous nucleation,
J. Atmos. Sci., 51, 1843–1856,
doi:10.1175/1520-0469(1994)051<1843:FRDTHN>2.0.CO;2, 1994.
Vali, G.: Repeatability and randomness in heterogeneous
freezing nucleation, Atmos. Chem. Phys., 8, 5017–5031, doi:10.5194/acp-8-5017-2008, 2008.
Vlasenko, A., Sjögren, S., Weingartner, E., Gäggeler, H. W., and Ammann, M.: Generation of submicron Arizona test dust aerosol: chemical and hygroscopic properties, Aerosol Sci. Tech., 39, 452–460, doi:10.1080/027868290959870, 2005.
Wagner, R., Linke, C., Naumann, K.-H., Schnaiter, M., Vragel, M., Gangl, M., and Horvath, H.: A review of optical measurements at the aerosol and cloud chamber AIDA, J. Quant. Spectrosc. Ra., 110, 930–949, doi:10.1016/j.jqsrt.2009.01.026, 2009.
Welti, A., Lüönd, F., Stetzer, O., and Lohmann, U.: Influence of particle size on the ice nucleating ability of mineral dusts, At-mos. Chem. Phys., 9, 6705–6715, doi:10.5194/acp-9-6705-2009, 2009.
Westbrook, C. D.: The fall speeds of sub-100 µm ice crystals, Q. J. Roy. Meteor. Soc., 134, 1243–1251, doi:10.1002/qj.290, 2008. Wheeler, M. J. and Bertram, A. K.: Deposition nucleation on
min-eral dust particles: a case against classical nucleation theory with the assumption of a single contact angle, Atmos. Chem. Phys., 12, 1189–1201, doi:10.5194/acp-12-1189-2012, 2012.