© Author(s) 2016. CC Attribution 3.0 License.
Effect of gravity wave temperature fluctuations on homogeneous
ice nucleation in the tropical tropopause layer
T. Dinh1, A. Podglajen2, A. Hertzog2, B. Legras3, and R. Plougonven2
1Program in Atmospheric and Oceanic Sciences, Princeton University, Princeton, New Jersey, USA 2Laboratoire de Météorologie Dynamique, École Polytechnique, Palaiseau, France
3Laboratoire de Météorologie Dynamique, École Normale Supérieure, Paris, France Correspondence to:T. Dinh ([email protected])
Received: 3 March 2015 – Published in Atmos. Chem. Phys. Discuss.: 24 March 2015 Revised: 5 November 2015 – Accepted: 24 November 2015 – Published: 14 January 2016
Abstract.The impact of high-frequency fluctuations of tem-perature on homogeneous nucleation of ice crystals in the vicinity of the tropical tropopause is investigated using a bin microphysics scheme for air parcels. The imposed tempera-ture fluctuations come from measurements during isopycnic balloon flights near the tropical tropopause. The balloons col-lected data at high frequency, guaranteeing that gravity wave signals are well resolved.
With the observed temperature time series, the numerical simulations with homogeneous freezing show a full range of ice number concentration (INC) as previously observed in the tropical upper troposphere. In particular, a low INC may be obtained if the gravity wave perturbations produce a non-persistent cooling rate (even with large magnitude) such that the absolute change in temperature remains small during nucleation. This result is explained analytically by a depen-dence of the INC on the absolute drop in temperature (and not on the cooling rate). This work suggests that homoge-neous ice nucleation isnotnecessarily inconsistent with ob-servations of low INCs.
1 Introduction
Cirrus clouds have an important impact on the global radia-tive energy budget (Lohmann and Roeckner, 1995). In the tropical tropopause layer (TTL; Fueglistaler et al., 2009), cir-rus clouds contribute to the radiative heating (Corti et al., 2006; Dinh and Fueglistaler, 2014a) and control the dehy-dration of the air before entry into the stratosphere (Brewer, 1949; Jensen et al., 1996; Dinh and Fueglistaler, 2014b). For
all cirrus clouds, the radiative and climate impact, ability to modify water vapour, and cloud evolution are sensitive to the ice number concentration (e.g. Kärcher et al., 2014), which depends strongly on the nucleation process of ice crystals.
When evaluating the ice number concentration (INC) pro-duced by nucleation, it has been often assumed that the rel-evant timescale is sufficiently short such that the vertical velocity and associated adiabatic cooling rate remain con-stant (e.g. Barahona and Nenes, 2008). For concon-stant cooling rates, homogeneous freezing of aqueous aerosols produces higher INCs (>1000 L−1) than those commonly observed
(.100 L−1) in cirrus clouds (Lawson et al., 2008; Krämer
et al., 2009; Davis et al., 2010). Observations and calcula-tions of INC based on homogeneous freezing can be recon-ciled only if very low vertical speeds (w <0.01 m s−1) are
used in the simulations. This seems at odds with the ubiq-uitous presence of atmospheric gravity waves, which typi-cally generate disturbances an order of magnitude larger in the vertical velocity. Therefore, it has been suggested that heterogeneous freezing (instead of homogeneous freezing) is the dominant nucleation mechanism for cirrus clouds in the upper troposphere (Jensen et al., 2010, 2012). The INC obtained by heterogeneous freezing is apparently limited by the availability of suitable ice nuclei (generally less than 100 L−1) in the upper troposphere (Chen et al., 1998; Rogers et al., 1998).
on ideally constructed temperature time series and so remain somewhat conceptual. The present work complements their study by using temperature time series data collected at high temporal resolution during long-duration balloon flights near the tropical tropopause. The observed temperatures contain perturbations from a spectrum of atmospheric waves, with periods ranging from days to minutes. Our numerical simu-lations based on these observed temperature time series con-firm the earlier results of Spichtinger and Krämer (2013).
In addition to the numerical simulations using realistic temperature time series (as described above), our contribu-tion is to provide a theoretical framework for characterising homogeneous nucleation while taking into account the tem-perature fluctuations due to gravity waves. The theoretical framework put forward here complements previous studies (see also Barahona and Nenes, 2011; Jensen et al., 2010, 2012; Murphy, 2014), where the effect of high-frequency temperature fluctuations on ice nucleation has been described but not explained analytically.
The article is organised as follows. Sections 2 and 3 de-scribe the balloon data and the technical details of the model used here to simulate homogeneous ice nucleation. Section 4 presents the numerical results. Section 5 provides the theo-retical basis explaining how the fluctuations in time of tem-perature may affect homogeneous ice nucleation. Section 6 contains the conclusions.
2 Balloon data descriptions
The temperature time series used in this study are derived from data collected by two long-duration, superpressure bal-loons launched by the French Space Agency from Seychelles Islands (55.5◦E, 4.6◦N) in February 2010 in the framework of the pre-Concordiasi campaign (Rabier et al., 2010). The balloons flew at an altitude of about 19 km and achieved circumterrestrial flights, therefore sampling the whole equa-torial circle. Details on the balloon trajectories and large-scale atmospheric dynamics during the flights can be found in Podglajen et al. (2014). Superpressure balloons are ad-vected by the wind on isopycnic (constant-density) surfaces and therefore behave as quasi-Lagrangian tracers of atmo-spheric motions. A further remarkable property of superpres-sure balloons is their sensitivity to atmospheric gravity waves (Massman, 1978; Nastrom, 1980; Boccara et al., 2008; Vin-cent and Hertzog, 2014). The sampling frequency of the bal-loon position, atmospheric pressure, and temperature during the campaign is every 30 s.
Here, we do not use the temperature observations gath-ered during the flights to constrain the nucleation simula-tions; these time series tend to be both too noisy and warm biased during daytime. Instead, we infer the temperature dis-turbances from the balloon vertical displacements (ζb′). The
isentropic air parcel vertical displacement (ζ′) is linked to
that of the isopycnic balloon through
ζ′= g/cp+∂T /∂z g/Ra+∂T /∂zζ
′
b (1)
(Boccara et al., 2008), whereg is the gravitational
acceler-ation,cp is the specific heat at constant pressure,Ra is the gas constant for air, and ∂T /∂zis the vertical gradient of
the background temperature. We use the European Centre for Medium-range Weather Forecasts (ECMWF) operational analyses to diagnose ∂T /∂z at the balloon position in the
above equation. The isentropic vertical displacement is then converted to the Lagrangian temperature fluctuation (felt by the air parcel) at the balloon flight level (i.e. in the lower stratosphere) by
TLS′ = −g cp
ζ′. (2)
We must furthermore take into account that the balloons flew in the lower stratosphere rather than in the upper tropo-sphere where most of the cirrus form. Because of the differ-ence in stability of these two regions, the vertical displace-ments and hence temperature fluctuations induced by gravity waves are larger in the upper troposphere than in the lower stratosphere. For conservative wave propagation, it can be shown that
TUT′ =
s
NLS NUTexp
−21zH
TLS′ , (3)
whereNUTandNLS respectively are the buoyancy
frequen-cies in the upper troposphere and lower stratosphere,1zis
the difference between the balloon flight and cloud altitudes,
H is the atmospheric scale height (∼6 km in the TTL), and TUT′ is the temperature disturbance in the upper troposphere
induced by the gravity wave packet observed at the balloon altitude. Typically,NLS∼2NUT, andTUT′ ∼TLS′ if the cirrus
forms 4 km below the balloon flight level.
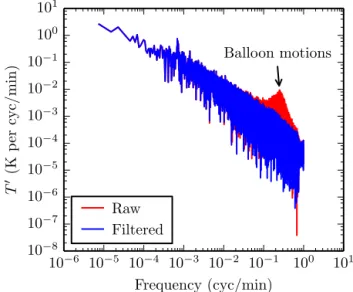
The power spectrum of the temperature perturbation (TUT′ )
time series derived from the balloon vertical displacements is shown in Fig. 1. Notice that the balloon neutral oscillations due to the flight mechanics have a frequency of 0.25 min−1. Since the spectrum of gravity waves extends up to the Brunt– Väisälä frequency (typically less than 0.20 min−1 in the TTL), we expect that the balloon motions do not negatively affect the quality of gravity waves in the data set. Neverthe-less, we applied a Butterworth band-stop filter to remove the balloon oscillations from the temperature time series (Fig. 1). We have also experimented filtering the data using a high cut-off frequency of 0.10 or 0.20 min−1(not shown). Our results (Sect. 4) are not sensitive to the data filtering method.
3 Model configurations
10−6
10−5
10−4
10−3
10−2
10−1
100
101
Frequency (cyc/min)
10−8
10−7
10−6
10−5
10−4
10−3
10−2
10−1
100
10
T
′ (K
p
er
cy
c/m
in
) Balloon motions
Raw Filtered
Figure 1.Power spectrum of the raw and filtered temperature
per-turbation time series derived from the balloon vertical displace-ments.
crystals (see e.g. Pruppacher and Klett, 1978) using the bin scheme designed by Dinh and Durran (2012). The formula for the water activity has been revised following Koop and Zobrist (2009). The saturation water vapour pressure (over ice) is taken from Murphy and Koop (2005).
Ice crystals and aerosol particles that form ice crystals are assumed to be spherical. We use 20 bins to resolve the size distribution of ice crystals with radii up to 10 µm. The time step used in the simulations is 0.5 s. The numerical results do not change with more bins or smaller time step, i.e. the stated bin and time resolutions are sufficient to ensure accuracy.
The number concentration of the aerosol reservoir isNa=
200 cm−3, and aerosol particles are assumed to be monodis-persed in size with a radius of 0.25 µm. These assumptions are within observed properties of aerosols in the upper tropo-sphere (Chen et al., 1998; Hermann et al., 2003). Simulations with polydispersed aerosols up to 1 µm in size do not show qualitative differences, and so we retain a monodispersed dis-tribution to simplify the analytical derivation in Sect. 5.
In addition, we do not consider ice sedimentation in or-der to focus solely on the nucleation process. Further, nucle-ation is calculated only for initially ice-free air parcels. The effect of pre-existing ice on nucleation has been discussed elsewhere (see Shi et al., 2015).
Currently, there is not yet a well-constrained limit on the deposition coefficient (also called accommodation coeffi-cient). The deposition coefficient controls the number of gas molecules that effectively enter the condensed phase after a collision with the ice surface. Laboratory measurements of the deposition coefficient vary by as much as 3 orders of magnitude, between 0.001 and 1 (Magee et al., 2006; Skrotzki et al., 2013). Figure 2 illustrates the effect of vary-ing the deposition coefficientαon the INC calculated using
10−2
10−1
100
101
Vertical velocityw (m s−1
)
101
102
103
104
105
10
N
i
(L
−
1 )
α=
1
α=
0.1
α=
0.01 α= 0.001
Figure 2.INC obtained from homogeneous nucleation at 195 K
forced by constant vertical velocitywfor different values of the deposition coefficientα.
our model. For the same constant updraft, the INC obtained by homogeneous nucleation is smaller for largerα. In the
fol-lowing sections, we first present the simulations forα=0.1
and then discuss the sensitivity toαin Sects. 4.3.3 and 5.2.
4 Numerical simulations
For adiabatic motions, the effect of pressure variations on the water vapour mixing ratio (r) can be neglected compared
with that due to temperature variations. Assuming constant air pressure, we prescribe an initial water vapour content for the air parcels such that nucleation occurs at a chosen temperatureT0. This is possible because the saturation ratio
with respect to ice (S) at the threshold of nucleation (Snuc)
is a function of temperature (Koop et al., 2000; Kärcher and Lohmann, 2002; Ren and Mackenzie, 2005), and it is related to the initial water vapour mixing ratio of air parcels by
r0=esat(T0) Snuc(T0) p
Ra
Rv, (4)
wherep is air pressure,esat is the saturation water vapour pressure over ice, andRa andRv are respectively the gas constants of air and water vapour. The notationsesat(T0)and Snuc(T0)≡S0refer to respectivelyesatandSnuc atT0. Note
that up to the nucleation time the vapour mixing ratior is
conserved (r=r0fort≤t0). As illustrated in Fig. 3, every
air parcel follows an isoline of constant water vapour mixing ratio (r=r0) until crossing theSnuc(T )curve, at which point
(t=t0) nucleation begins.
The simulations were first carried out for pressurep=
T
0T
0+
δT
0Temperature
S
at
u
rat
ion
rat
io
S
0S
0+
δS
0S
nuc(
T
)
r
=
con
st
r
=
r
0
r
=
r
0
+
δ
r
Figure 3. Diagram illustrating the initial conditions of the air parcels. Prior to nucleation air parcels follow isolines of water vapour mixing ratior(shown here in blue) and approach the curve Snuc(T )from below (as indicated by the arrows). Nucleation begins at the intersections of therisolines with the curveSnuc(T ).
event may be formally defined to start when the rate of nu-cleationJ exceeds a thresholdJε(J≥Jε) and to end when it becomes less thanJε(J < Jε). For our simulations, choos-ing a threshold of Jε=109L−1s−1, we have S0=1.553 forT0=195 K. Sensitivities to nucleation temperatureT0in
the range between 180 and 210 K and α in the range
be-tween 0.001 and 1 are discussed in Sect. 4.3.2 and 4.3.3. Time series of temperature is defined by
T (t )=T +T′(t ), (5)
whereT′(t )are either idealised following temperature
vari-ations associated with constant and time-varying vertical velocities (Sect. 4.1 and 4.2), or taken from the balloon data (Sect. 4.3). The base temperature T is varied between
180 and 220 K, which allows us to explore a range of satu-ration ratio with respect toT (0.8≤S(T )≤1.2) for a given
nucleation temperatureT0. The results and conclusions
pre-sented below, including the analytical derivation in Sect. 5.1, do not depend on the choice ofT. The only requirement for T is that it is sufficiently low to allow for nucleation along
the temperature time series, specifically T+T′(t ) < T0for at least some time (t) in the time series.
4.1 Constant vertical velocity
Here temperature is set to decrease with time due to adia-batic cooling at a constant vertical velocity in a hydrostatic background, i.e.
T′(t )= −g cp
wt. (6)
10−2
10−1
100
101
Vertical velocityw(m s−1
)
101
102
103
104
105
106
N
i
(L
−
1)
constant w= 0.1 m s−1
w=±0.1 m s−1
ts= 3.1 min
w=±0.1 m s−1
ts= 2.1 min
w=±0.1 m s−1
ts= 1.1 min
Figure 4.INCs obtained forα=0.1 with constantw(filled circles), and withw= ±0.1 m s−1(open circles), see Eq. (7). Vapour-limit events are shown in blue and temperature-limit events are shown in red.
Forα=0.1, the number of ice crystals nucleated Ni
in-creases withwifw <1 m s−1(see Fig. 4). Forw≥1 m s−1,
all aerosols particles form ice, henceNi=Na=200 cm−3.
Figure 4 shows that if the vertical velocity and the cooling rate are constant during the nucleation events, w must be
less than 0.01 m s−1 in order forNi<100 L−1. This result is consistent with previous studies (e.g. Krämer et al., 2009) of homogeneous freezing under constant vertical velocity. 4.2 Nonpersistent cooling
Now we varywwith time so that the rate of change of
tem-peraturedTdt is no longer constant with time. Specifically, we set
w(t )=
+0.1 m s−1 if t−t0≤ts
−0.1 m s−1 if t−t0> ts. (7)
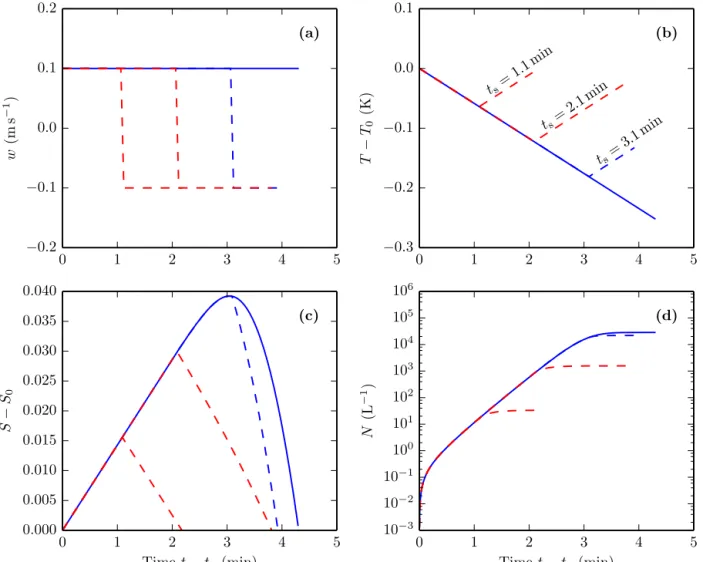
The timets at whichw switches signs is varied by setting ts= {1.10; 2.10; 3.10}min. The dash lines in Fig. 5 show
the evolution of the vertical velocity, temperature, saturation ratio, and INC during the nucleation events forced byw= ±0.1 m s−1as defined above.
In the event wherewswitches signs atts=3.10 min (blue
dash curves in Fig. 5), the saturation ratio (S) reaches a
maximum (Smax) att∗=3.05 min, which is before the
min-imum temperature (Tmin) is reached (t∗< ts). Here,Smaxis
controlled by the depletion of water vapour by depositional growth of ice crystals. The INC in this event is almost the same as that which would have been obtained ifwwere kept
constant at 0.1 m s−1(see also Fig. 4). We refer to this event and all cases with constantw as “vapour limit”, indicating
0 1 2 3 4 5
−0.2
−0.1
0.0
0.1
w
(m
s
−
1 )
(a)
0 1 2 3 4 5
−0.3
−0.2
−0.1
0.0
T
−
T0
(K
)
(b)
ts=
1.1 m in
ts=
2.1 m in
ts=
3.1 m in
0 1 2 3 4 5
Timet−t0(min)
0.000
0.005
0.010
0.015
0.020
0.025
0.030
0.035
0.040
S
−
S0
(c)
0 1 2 3 4 5
Timet−t0 (min)
10−3
10−2
10−1
100
101
102
103
104
105
106
N
(L
−
1)
(d)
Figure 5.Evolution of vertical velocity(a), temperature(b), saturation ratio(c), and INC(d)during nucleation events forced by constant w=0.1 m s−1 (solid) and byw= ±0.1 m s−1(dash) as defined by Eq. (7). Blue curves show vapour-limit events and red curves show temperature-limit events.
For the other two events in whichwswitches signs earlier
atts=1.10 and 2.10 min (red curves in Fig. 5 and red circles
in Fig. 4), Ni is significantly smaller than that obtained for
the vapour-limit event described above. For these two events,
Smax andTmin occur at the same time (t∗=ts). After Smax
is reached, S decreases with time because temperature
in-creases with time. We refer to these events as “temperature limit” because the minimum temperature determines Smax and hence Ni. The depletion of water vapour by ice
depo-sitional growth can be neglected becauseNiis small. The numerical results show that homogeneous nucleation may be cut off if the cooling that initiates nucleation does not persist sufficiently long into the nucleation events. As a con-sequence, low INCs can be obtained for temperature-limit events despite initially high vertical velocities and cooling rates. The results in this section are consistent with the sim-ulations with similar setups that have been carried out previ-ously by Spichtinger and Krämer (2013).
4.3 Balloon temperature time series
In contrast to the previous sections which used theoretically constructed temperature time series, the numerical simula-tions presented in this section were carried out using the bal-loon data. Below, for Sect. 4.3.1 we useT0=195 K andα=
0.1 (same as previously in Sect. 4.1 and 4.2). In Sect. 4.3.2
and 4.3.3, we vary T0 between 180 and 210 K and α
be-tween 0.001 and 1 to explore sensitivities to these parame-ters.
4.3.1 Control simulations withT0=195 K andα=0.1
−5 −4 −3 −2 −1 0 1 2 3 4 5 6
−0.6
−0.4
−0.2
0.0
0.2
0.4
0.6
0.8
1.0
1.2
w
(m
s
−
1)
(a)
−5 −4−3 −2 −1 0 1 2 3 4 5 6
194.5
195.0
195.5
196.0
196.5
197.0
T
(K
)
(b)
−5 −4 −3 −2 −1 0 1 2 3 4 5 6
Timet−t0(min)
1.1
1.2
1.3
1.4
1.5
1.6
1.7
S
(c)
−5 −4−3 −2 −1 0 1 2 3 4 5 6
Timet−t0(min)
10−3
10−2
10−1
100
101
102
103
104
105
106
N
(L
−
1)
(d)
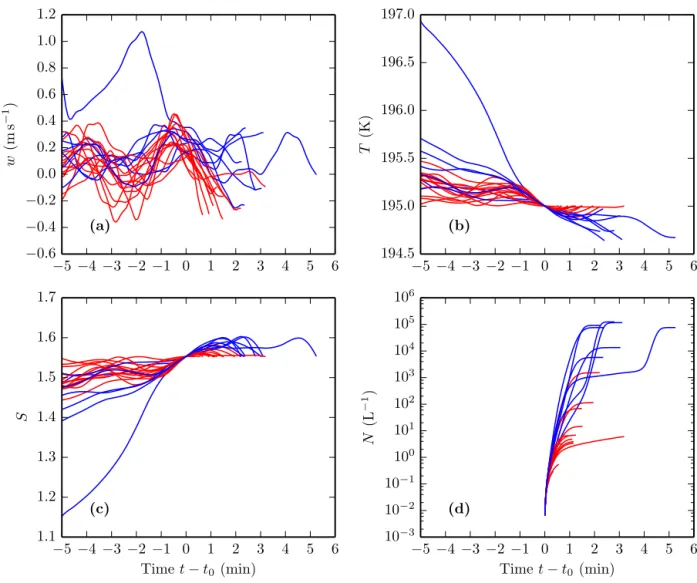
Figure 6.Evolution of vertical velocity(a), temperature(b), saturation ratio(c), and INC(d)in the period immediately before and during
representative nucleation events forced by the temperature perturbations derived from the balloon data. The plots are shown for an extended period of time before nucleation begins att0to illustrate the background condition leading to nucleation. Blue curves show vapour-limit events and red curves show temperature-limit events.
leading to nucleation. However, we will show below that the INC obtained by nucleation is independent of the background condition prior to nucleation.
Figure 6 shows that the durationτof the nucleation events
(as formally defined by the period during whichJ≥Jε) is
typically less than 5 min. However, during this short time pe-riod, the cooling rate is typically not constant because there are high-frequency fluctuations in the observed vertical ve-locity and temperature time series. Moreover, more than one local maximum and minimum inT andSmay occur during
one nucleation event. Nevertheless, it is possible to distin-guish between
– vapour-limit events, for which the absolute maximum
Smaxis obtained before the absolute minimumTmin be-cause of substantial vapour depletion – constant cooling rate is a special case of this type; and
– temperature-limit events, for whichSmaxis obtained at
the same time asTmin; i.e. temperature controls the
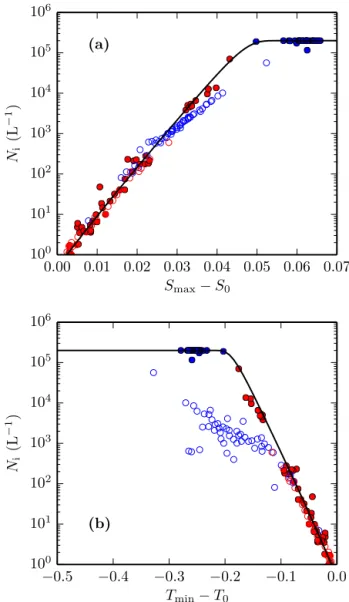
cut-off of nucleation, and vapour depletion is negligible. As shown in Fig. 7, the INCs nucleated during temperature-limit events are typically smaller than for vapour-limit events. The numerical results suggest that, for all nucleation events,Niincreases exponentially with the dif-ference
△S≡Smax−S0 (8)
as long asNi≪Na(Fig. 7). For temperature-limit nucleation
events,Niincreases exponentially with|△T|, where
△T ≡Tmin−T0. (9)
func-0.00 0.01 0.02 0.03 0.04 0.05 0.06 0.07 Smax−S0
100
101
102
103
104
105
10
N
i
(L
−
1 )
(a)
−0.5 −0.4 −0.3 −0.2 −0.1 0.0 Tmin−T0
100
101
102
103
104
105
106
N
i
(L
−
1 )
(b)
Figure 7. Number of ice crystals nucleated at T0=195 K for α=0.1 using the balloon temperature perturbation time series. Blue circles show vapour-limit nucleation events. Red circles show temperature-limit nucleation events. The solid curves are obtained from Eqs. (14)–(18) withµ=0.05 s−1.
tion of △T for temperature-limit events). These two
quan-tities (△S and△T) are characterisation of the fluctuations
in water vapour and temperature during nucleation; they are defined exclusively within the period of nucleation and are independent of the background condition prior to nucleation. 4.3.2 Sensitivity of INC to nucleation temperature
Here, we prescribe the initial vapour content r0 of the air
parcels such that the nucleation temperatureT0is either 180
or 210 K. In Fig. 3, this is equivalent to choosing another isoline ofrand displacing accordingly the values ofT0and
S0at nucleation.
The number of ice crystals nucleated for T0=180 and 210 K is shown in Fig. 8. The data for T0=195 K shown
0.00 0.01 0.02 0.03 0.04 0.05 0.06 0.07
Smax−S0
100
101
102
103
104
105
N
i
(L
−
1)
180 K 210
K
(a)
−0.5 −0.4 −0.3 −0.2 −0.1 0.0 Tmin−T0
100
101
102
103
104
105
106
N
i
(L
−
1)
180
K
210
K
(b)
Figure 8.Same as Fig. 7 (α=0.1) but forT0=180 K (filled cir-cles) and 210 K (empty circir-cles).
previously in Fig. 7 generally lie between the data points for
T0=180 and 210 K; that is, there is a monotonic relation-ship betweenNiandT0. For the same△S,Niis smaller for smallerT0. Conversely, for the same△T,Ni is smaller for largerT0.
4.3.3 Sensitivity of INC to deposition coefficient
The number of ice crystals nucleated atT0=195 K forα=
0.001 andα=1 is shown in Fig. 9. Notice that the transition
from temperature-limit events to vapour-limit events occurs at lower INC forα=1 than α=0.001. This makes sense
because ice crystals deplete water vapour at a faster rate in the caseα=1, and so the number of ice crystals needed to
significantly deplete water vapour is smaller.
For temperature-limit events, the functional dependence of
smaller forα=1 thanα=0.001 for the same△S(or△T).
The sensitivity of vapour-limit events to the deposition coef-ficient is explained in the theory section below.
5 Theory and discussions
In this section we provide the theoretical basis that explains the numerical results shown previously in Sect. 4.
5.1 Formula for ice number concentration
The rate of nucleation of ice crystals during a nucleation event is given by
dN
dt =(Na−N ) J Va, (10)
whereNais the aerosol particle number concentration,Vais
the volume of each aerosol particle, andJ is the
homoge-neous nucleation rate given by Koop et al. (2000, their Eq. 7). By integrating Eq. (10) from the beginning (t=t0) to end
(t=t0+τ) of the nucleation event we obtain
ln
1−Ni
Na
= −Va t0+τ
Z
t0
Jdt
= −VaJmax
t0+τ
Z
t0
exp(ln(J )−ln(Jmax))dt,
(11) whereJmax≡J (t∗)is the maximum value of J during the
nucleation event (t0< t∗< t0+τ), andNi≡N (t0+τ )is the
INC obtained at the end of the nucleation event. Following the steepest descent method, we obtain
ln
1−Ni
Na
≈ −VaJmax t0+τ
Z
t0
exp 1 2
d2(lnJ ) dt2 t
∗
t−t∗2
!
dt
≈ −VaJmax t0+τ−t∗
Z
t0−t∗
exp−µ2t2
dt
≈ −VaJmax ∞
Z
−∞
exp−µ2t2
dt
≈√π VaJmax
µ , (12)
where
µ2= −1
2
d2(lnJ )
dt2 t
∗
= −2 1 Jmax
d2J
dt2 t
∗
. (13)
0.00 0.01 0.02 0.03 0.04 0.05 0.06 0.07
Smax−S0
100
101
102
103
104
105
106
N
i
(L
−
1)
(a)
−0.5 −0.4 −0.3 −0.2 −0.1 0.0 Tmin−T0
100
101
102
103
104
105
106
N
i
(L
−
1)
(b)
Figure 9.Same as Fig. 7 (T0=195 K) but forα=0.001 (filled circles) andα=1 (empty circles).
The approximations used to derive Eq. (12) are appropriate ift∗−t0andt0+τ−t∗are both significantly larger than the
e-folding timescale given byµ−1. These criteria are well
sat-isfied in our simulations. From Eq. (12) we obtain
Ni≈Na
1−exp
−√π VaJmax
µ
. (14)
For homogeneous ice nucleation,J is given by (see Koop
et al., 2000)
log10(J )=P3
(S−1)awi, (15)
whereP3denotes a third-order polynomial, andawi is the
log10(Jmax)=P3
(Smax−1) awi T t∗ ≈P3
(S0+ △S−1) aiw(T0)
, (16)
where△Sis the change in the saturation ratio during the
nu-cleation event defined in Eq. (8). Since awi andS0are both
functions of temperature,Jmaxis a function of△Sand
tem-perature. Therefore, Eqs. (14) and (16) indicate that Ni is
a function of △S, µ, and temperature. However, note that △S,µ, and temperature are not exclusively independent
vari-ables. In fact, substituting Eqs. (15) and (16) into Eq. (13) we obtain
µ2≈f (△S, T0) d 2S
dt2 t
∗
!
+h (△S, T0) d 2T
dt2 t
∗
!
, (17)
wheref (△S,T0)andh(△S,T0)are functions of△SandT0,
and we have made the approximation thatT ≈T0 because the perturbationT′is small compared withT andT0.
Equa-tion (17) indicates that µ is a function of △S,T0, and the
second-order time derivatives ofSandT evaluated att∗.
For the nucleation events atT0=195 K shown in Fig. 7, our calculations indicate that 0.01< µ <0.1 s−1. From Eq. (14) we deduce that the large range of Ni (10−3 to
106L−1) obtained for these nucleation events must be due to a large range in Jmax. If the differences inµ among the
nucleation events can be ignored, at a chosen temperatureNi
depends solely onJmax, which depends solely on△S. In fact,
setting µ=0.05 s−1 andT0=195 K in Eqs. (14) and (16) we obtain a functional dependence of Ni on△S (the solid
curve in Fig. 7a) that fits the numerical data well. The error that results from assuming constantµis further discussed in
Sect. 5.2.
For the special case of a temperature-limit event, the par-tial pressure of water vapour can be approximated as constant during the nucleation event fort0< t < t0+τ, and so
△S≈ −S0Ls
RvT02△T , (18)
where △T is the change in temperature during the
nucle-ation event defined in Eq. (9), Ls is the latent heat of sub-limation, and Rvis the gas constant of water vapour. With
µ=0.05 s−1andT0=195 K, from Eqs. (14)–(18) we obtain the solid curve in Fig. 7b that captures the dependence ofNi on△T as suggested by the simulations of temperature-limit
events.
5.2 Sensitivity of INC to nucleation temperature and deposition coefficient
Using the formulae derived in Sect. 5.1 we can now explain the sensitivity of the numerical results to T0 and the depo-sition coefficientα. The analytic functions ofNi-versus-△S
w
recall Eq. 16). Ifµis assumed constant, the analytic
func-tions are independent of the deposition coefficientα. As
de-scribed further below, the assumption of constant µ gives
consistent result with the numerical data for temperature-limit events but tends to overestimate INCs for vapour-temperature-limit events at largerT0and/or largerα.
Forα=0.1, Fig. 8a shows that the analytic function of Ni-versus-△S is consistent with the numerical data, except
for vapour-limit events atT0=210 K that produce more than 104L−1 ice crystals. This error arises becauseµ has been assumed to be constant (µ=0.05 s−1) and independent of △Sin the calculation of the analytic curve. The error is larger
for larger temperature.
For α=1, the analytic function of Ni-versus-△S also
overestimatesNifor vapour-limit events (Fig. 9a). We again
attribute this error to the assumption thatµis constant over
the shown range of△S. The deposition coefficient governs
the growth rate of ice crystals and affects how the saturation ratio changes with time and howµchanges with△S(a
con-sequence of Eq. 17). Our calculation indicates that the rate of change ofµwith respect to△Sincreases withα. For larger
values of α, calculation of Ni (especially for vapour-limit events) must account for the variations inµas△Svaries.
Let us now study the variation ofNi with respect to△T
(Figs. 8b and 9b). Recall that the function ofNiwith respect to△T is derived by neglecting the depletion of water vapour
due to ice depositional growth (see Eq. 18). For all values of
T0andαtested here, the analytic function with constantµ
explains well the pattern ofNi-versus-△T for
temperature-limit events. For vapour-temperature-limit events, the analytic curves in Figs. 8b and 9b overestimate the numerical solution because of (i) the neglect of water vapour depletion in Eq. (18) and (ii) the assumption of constantµ.
5.3 Dependence of INC on the initial water vapour mixing ratio
The temperature time seriesT (t )along the trajectory of an
air parcel (recall Eq. 5) and the initial water vapour contentr0 of the parcel are two independent conditions to be specified for the simulations. The initial water vapour contentr0has a one-to-one relationship with the temperature at the threshold of nucleationT0via Eq. (4). In Sect. 4 we have studied how the INC varies with the various forms ofT (t )for agivenr0 and a correspondingT0. Here, however, we discuss how the INC varies asr0andT0vary for agivenT (t ).
Now, consider air parcels with slightly different initial wa-ter vapour mixing ratios:r0andr0+δr0. The nucleation
tem-peratures for these air parcels are respectivelyT0andT0+δT0
(see illustration in Figs. 3 and 10). For constant pressure,δr0
andδT0are related by
δr0
r0 =
δesat
esat + 1
S0 dS0 dT0δT0=
Ls
RvT02δT0+
1
S0 dS0
0 1 2 3 4 5 6 7 194.6
194.7 194.8 194.9 195.0 195.1
T
em
p
er
at
u
re
T
(K
)
r
Ar
Br
C (a)0 1 2 3 4 5 6 7
1.48 1.50 1.52 1.54 1.56 1.58 1.60
S
at
u
rat
ion
rat
io
S
r
Ar
Br
C(b)
0 1 2 3 4 5 6 7
Timet(min)
10−3
10−2
10−1
100
101
102
103
104
105
106
INC
N
(L
−
1 )
r
Ar
Br
C(c)
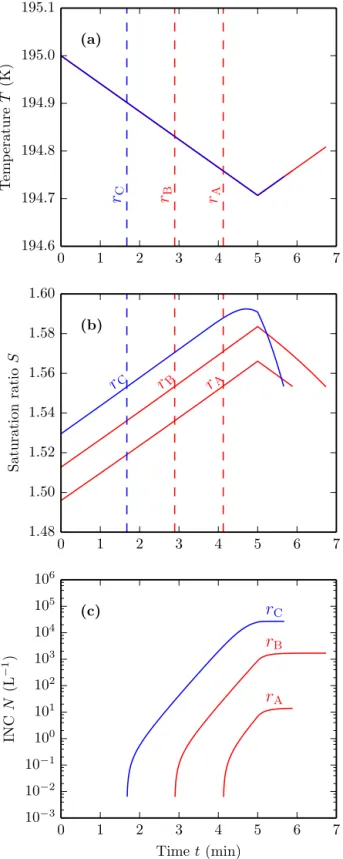
Figure 10. Evolution of temperature (a), saturation ratio (b), and INC (c) for three air parcels with slightly different
ini-tial water vapour mixing ratios: {rA=1.78; rB=1.80; rC= 1.82} ×10−5kg kg−1. The parcels follow the same temperature time series as shown in(a), but they begin nucleation at different
times (indicated by the dash lines) and end up with widely different INCs.
by Eq. (4) and the Clausius–Clapeyron relation. The first term dominates the right-hand side of Eq. (19), from which we obtain
dT0 dr0 ≈
RvT02
Lsr0, (20)
which indicates thatT0increases monotonically withr0. For
a given temperature time series T (t ), the minimum
tem-perature Tmin experienced by the parcels is the same (see Fig. 10). It follows that|△T| =T0−Tmin increases mono-tonically withr0. For temperature-limit events,Niincreases exponentially with|△T|(recall Fig. 7 and Eq. 18), and so
it must increase exponentially withr0. Asr0 increases,Ni increases until reaching a limit above which the nucleation event must be vapour limit (see e.g. Fig. 7). Thus, for a given temperature time series,r0controlsNi and also determines
whether the nucleation event is temperature or vapour limit. For example, consider a temperature time series defined by a cooling rate associated withw= +0.1 m s−1between t=0 andts=5 min, and a warming rate associated withw= −0.1 m s−1afterts(see Fig. 10). This temperature time series is similar to the profiles we have studied earlier in Sect. 4.2. Consider three air parcels following this temperature time se-ries, but for whichr0= {1.78; 1.80; 1.82} ×10−5kg kg−1.
All three air parcels experience nucleation, and in all cases
Tmin=194.71 K occurs during the nucleation periods.
How-ever, our calculations giveT0= {194.76; 194.83; 194.90}K andNi= {1.4×101; 1.7×10³; 2.7×10⁴}L−1respectively
for the three parcels. Moreover, the two drier air parcels experience temperature-limit nucleation events (red lines in Fig. 10), whereas the moist air parcel experiences a vapour-limit event (blue line in Fig. 10). As illustrated here, small differences inr0result in many orders of magnitude changes
inNi. Such a strong dependence of Ni onr0could explain the large-amplitude, small-scale heterogeneities in the INC as observed in cirrus clouds by Jensen et al. (2013).
6 Conclusions
We have simulated homogeneous ice nucleation using tem-perature time series data collected at high frequency by long-duration balloon flights near the tropical tropopause. The simulated nucleation events can be conceptually categorised as either vapour limit or temperature limit. For vapour-limit events, nucleation is limited by the depletion of water vapour. In contrast, for temperature-limit events, nucleation is con-trolled by the fluctuations in temperature (while the deple-tion in water vapour is negligible). The INC obtained for temperature-limit events is typically smaller than that ob-tained for vapour-limit events.
ob-cooling rates such that the absolute drop in temperature (i.e. the difference between the temperature at the threshold of cleation and the minimum temperature obtained during nu-cleation) remains small. This relationship between the INC and temperature has been illustrated here both numerically and analytically.
In addition to the fluctuations in temperature, small varia-tions in the initial water vapour content of the air parcels can also lead to large variations in the INC obtained by nucle-ation. Moreover, post-nucleation processes acting during the cirrus life cycle contribute to modify the cloud original char-acteristics. Simulations of cirrus clouds in the TTL by Dinh et al. (2012, 2014) show that the INC decreases by several orders of magnitude as the cloud ages. For these reasons, we suggest that homogeneous ice nucleation (even acting alone in the absence of heterogeneous freezing) is not inconsistent with recent observations of cirrus clouds in the TTL that in-dicate generally low but highly variable INC (Jensen et al., 2013).
Finally, it is encouraging that the INC for temperature-limit events does not depend on the deposition coefficient, a parameter still poorly constrained by theoretical understand-ing as well as laboratory measurements and field observa-tions.
Acknowledgements. The data used for simulations in this work were collected during the project “Concordiasi,” which is supported by the following agencies: Météo-France, CNES, CNRS/INSU, NSF, NCAR, University of Wyoming, Purdue University, Uni-versity of Colorado, Alfred Wegener Institute, Met Office, and ECMWF. Concordiasi also benefited from the logistic and financial support of the Institut polaire français Paul Emile Victor (IPEV), Programma Nazionale di Ricerche in Antartide (PNRA), United States Antarctic Program (USAP), British Antarctic Survey (BAS), and from measurements by the Baseline Surface Radiation Net-work (BSRN) at Concordia.
Tra Dinh acknowledges support from the NOAA Climate and Global Change Postdoctoral Fellowship Program and NSF grant AGS-1417659. This collaborative research emerged from Tra Dinh’s visit to the Laboratoire de Météorologie Dynamique, which was supported by the “Tropical Cirrus” project of École Polytechnique’s “Chaire pour le Développement Durable”. Au-rélien Podglajen, Albert Hertzog, Bernard Legras, and Ri-wal Plougonven received support from the ANR project “Stradyvar-ius” (ANR-13-BS06-0011-01). Additional support was provided by the EU 7th Framework Program under grant 603557 (StratoClim).
The authors would like to thank three anonymous reviewers and Martina Krämer, Bernd Kärcher, and Daniel Knopf for helpful questions and comments that led to significant improvements of this work.
Edited by: M. Krämer
Barahona, D. and Nenes, A.: Parameterization of cirrus cloud for-mation in large-scale models: Homogeneous nucleation, J. Geo-phys. Res., 113, D11211, doi:10.1029/2007JD009355, 2008. Barahona, D. and Nenes, A.: Dynamical states of low temperature
cirrus, Atmos. Chem. Phys., 11, 3757–3771, doi:10.5194/acp-11-3757-2011, 2011.
Boccara, G., Hertzog, A., Vincent, R. A., and Vial, F.: Esti-mation of gravity-wave momentum fluxes and phase speeds from quasi-Lagrangian stratospheric balloon flights. Part I: Theory and simulations, J. Atmos. Sci., 65, 3042–3055, doi:10.1175/2008JAS2709.1, 2008.
Brewer, A. W.: Evidence for a world circulation provided by the measurements of helium and water vapour distribution in the stratosphere, Q. J. Roy. Meteorol. Soc., 75, 351–363, doi:10.1002/qj.49707532603, 1949.
Chen, Y., Kreidenweis, S. M., McInnes, L. M., Rogers, D. C., and DeMott, P. J.: Single particle analyses of ice nucleating aerosols in the upper troposphere and lower stratosphere, Geophys. Res. Lett., 25, 1391–1394, doi:10.1029/97GL03261, 1998.
Corti, T., Luo, B. P., Fu, Q., Vömel, H., and Peter, T.: The impact of cirrus clouds on tropical troposphere-to-stratosphere transport, Atmos. Chem. Phys., 6, 2539–2547, doi:10.5194/acp-6-2539-2006, 2006.
Davis, S., Hlavka, D., Jensen, E., Rosenlof, K., Yang, Q., Schmidt, S., Borrmann, S., Frey, W., Lawson, P., Voemel, H., and Bui, T. P.: In situ and lidar observations of tropopause subvisi-ble cirrus clouds during TC4, J. Geophys. Res., 115, D00J17, doi:10.1029/2009JD013093, 2010.
Dinh, T. and Durran, D. R.: A hybrid bin scheme to solve the con-densation/evaporation equation using a cubic distribution func-tion, Atmos. Chem. Phys., 12, 1003–1011, doi:10.5194/acp-12-1003-2012, 2012.
Dinh, T. and Fueglistaler, S.: Cirrus, Transport, and Mixing in the Tropical Upper Troposphere, J. Atmos. Sci., 71, 1339–1352, doi:10.1175/JAS-D-13-0147.1, 2014a.
Dinh, T. and Fueglistaler, S.: Microphysical, radiative and dynam-ical impacts of thin cirrus clouds on humidity in the tropi-cal tropopause layer and stratosphere, Geophys. Res. Lett., 41, 6949–6955, doi:10.1002/2014GL061289, 2014b.
Dinh, T., Durran, D. R., and Ackerman, T.: Cirrus and water va-por transva-port in the tropical tropopause layer – Part 1: A spe-cific case modeling study, Atmos. Chem. Phys., 12, 9799–9815, doi:10.5194/acp-12-9799-2012, 2012.
Dinh, T., Fueglistaler, S., Durran, D., and Ackerman, T.: Cirrus and water vapour transport in the tropical tropopause layer – Part 2: Roles of ice nucleation and sedimentation, cloud dynam-ics, and moisture conditions, Atmos. Chem. Phys., 14, 12225– 12236, doi:10.5194/acp-14-12225-2014, 2014.
Fueglistaler, S., Dessler, A. E., Dunkerton, T. J., Folkins, I., Fu, Q., and Mote, P. W.: Tropical tropopause layer, Rev. Geophys., 47, RG1004, doi:10.1029/2008RG000267, 2009.
Jensen, E. J., Toon, O. B., Pfister, L., and Selkirk, H. B.: Dehy-dration of the upper troposphere and lower stratosphere by sub-visible cirrus clouds near the tropical tropopause, Geophys. Res. Lett., 23, 825–828, doi:10.1029/96GL00722, 1996.
Jensen, E. J., Pfister, L., Bui, T.-P., Lawson, P., and Baumgardner, D.: Ice nucleation and cloud microphysical properties in tropi-cal tropopause layer cirrus, Atmos. Chem. Phys., 10, 1369–1384, doi:10.5194/acp-10-1369-2010, 2010.
Jensen, E. J., Pfister, L., and Bui, T. P.: Physical processes control-ling ice concentrations in cold cirrus near the tropical tropopause, J. Geophys. Res., 117, D11205, doi:10.1029/2011JD017319, 2012.
Jensen, E. J., Diskin, G., Lawson, R. P., Lance, S., Bui, T. P., Hlavka, D., McGill, M., Pfister, L., Toon, O. B., and Gao, R.: Ice nucle-ation and dehydrnucle-ation in the Tropical Tropopause Layer, P. Natl. Acad. Sci., 110, 2041–2046, doi:10.1073/pnas.1217104110, 2013.
Kärcher, B. and Lohmann, U.: A parameterization of cirrus cloud formation: Homogeneous freezing of supercooled aerosols, J. Geophys. Res., 107, 4010, doi:10.1029/2001JD000470, 2002. Kärcher, B., Dörnbrack, A., and Sölch, I.: Supersaturation
Variabil-ity and Cirrus Ice Crystal Size Distributions, J. Atmos. Sci., 71, 2905–2926, doi:10.1175/JAS-D-13-0404.1, 2014.
Koop, T. and Zobrist, B.: Parameterizations for ice nucleation in biological and atmospheric systems, Phys. Chem. Chem. Phys., 11, 10839–10850, doi:10.1039/b914289d, 2009.
Koop, T., Luo, B., Tsias, A., and Peter, T.: Water activity as the de-terminant for homogeneous ice nucleation in aqueous solutions, Nature, 406, 611–614, doi:10.1038/35020537, 2000.
Krämer, M., Schiller, C., Afchine, A., Bauer, R., Gensch, I., Man-gold, A., Schlicht, S., Spelten, N., Sitnikov, N., Borrmann, S., de Reus, M., and Spichtinger, P.: Ice supersaturations and cir-rus cloud crystal numbers, Atmos. Chem. Phys., 9, 3505–3522, doi:10.5194/acp-9-3505-2009, 2009.
Lawson, R. P., Pilson, B., Baker, B., Mo, Q., Jensen, E., Pfister, L., and Bui, P.: Aircraft measurements of microphysical prop-erties of subvisible cirrus in the tropical tropopause layer, At-mos. Chem. Phys., 8, 1609–1620, doi:10.5194/acp-8-1609-2008, 2008.
Lohmann, U. and Roeckner, E.: Influence of cirrus cloud radiative forcing on climate and climate sensitivity in a general circulation model, J. Geophys. Res., 100, 16305, doi:10.1029/95JD01383, 1995.
Magee, N., Moyle, A. M., and Lamb, D.: Experimental deter-mination of the deposition coefficient of small cirrus-like ice crystals near −50 Celsius, Geophys. Res. Lett., 33, L17813, doi:10.1029/2006GL026665, 2006.
Massman, W. J.: On the nature of vertical oscillations of con-stant volume balloons, J. Appl. Meteorol., 17, 1351–1356, doi:10.1175/1520-0450(1978)017<1351:OTNOVO>2.0.CO;2, 1978.
Murphy, D. M.: Rare temperature histories and cirrus ice number density in a parcel and a one-dimensional model, Atmos. Chem. Phys., 14, 13013–13022, doi:10.5194/acp-14-13013-2014, 2014. Murphy, D. M. and Koop, T.: Review of the vapour pressures of ice and supercooled water for atmospheric applications, Q. J. Roy. Meteorol. Soc., 131, 1539–1565, doi:10.1256/qj.04.94, 2005. Nastrom, G. D.: The response of superpressure balloons to
grav-ity waves, J. Appl. Meteorol., 19, 1013–1019, doi:10.1175/1520-0450(1980)019<1013:TROSBT>2.0.CO;2, 1980.
Podglajen, A., Hertzog, A., Plougonven, R., and Žagar, N.: Assessment of the accuracy of (re)analyses in the equato-rial lower stratosphere, J. Geophys. Res., 119, 11,166–11,188, doi:10.1002/2014JD021849, 2014.
Pruppacher, H. R. and Klett, J. D.: Microphysics of clouds and precipitation, D. Reidel Publishing Company, Dordrecht, the Netherlands, 1978.
Rabier, F., Bouchard, A., Brun, E., Doerenbecher, A., Guedj, S., Guidard, V., Karbou, F., Peuch, V.-H., Amraoui, L. E., Puech, D., Genthon, C., Picard, G., Town, M., Hertzog, A., Vial, F., Coc-querez, P., Cohn, S. A., Hock, T., Fox, J., Cole, H., Parsons, D., Powers, J., Romberg, K., VanAndel, J., Deshler, T., Mercer, J., Haase, J. S., Avallone, L., Kalnajs, L., and Mechoso, C. R.: The Concordiasi project in Antarctica, B. Am. Meteorol. Soc., 91, 69–86, doi:10.1175/2009bams2764.1, 2010.
Ren, C. and Mackenzie, A. R.: Cirrus parametrization and the role of ice nuclei, Q. J. Roy. Meteorol. Soc., 131, 1585–1605, doi:10.1256/qj.04.126, 2005.
Rogers, D. C., Demott, P. J., Kreidenweis, S. M., and Chen, Y.: Mea-surements of ice nucleating aerosols during SUCCESS, Geo-phys. Res. Lett., 25, 1383–1386, doi:10.1029/97GL03478, 1998. Shi, X., Liu, X., and Zhang, K.: Effects of preexisting ice crystals on cirrus clouds and comparison between different ice nucleation parameterizations with the Community Atmo-sphere Model (CAM5), Atmos. Chem. Phys., 15, 1503–1520, doi:10.5194/acp-15-1503-2015, 2015.
Skrotzki, J., Connolly, P., Schnaiter, M., Saathoff, H., Möhler, O., Wagner, R., Niemand, M., Ebert, V., and Leisner, T.: The accom-modation coefficient of water molecules on ice – cirrus cloud studies at the AIDA simulation chamber, Atmos. Chem. Phys., 13, 4451–4466, doi:10.5194/acp-13-4451-2013, 2013.
Spichtinger, P. and Krämer, M.: Tropical tropopause ice clouds: a dynamic approach to the mystery of low crystal numbers, At-mos. Chem. Phys., 13, 9801–9818, doi:10.5194/acp-13-9801-2013, 2013.