ACPD
8, 14419–14465, 2008Ice nucleation rate from contact angle and activation energy
J.-P. Chen et al.
Title Page
Abstract Introduction
Conclusions References
Tables Figures
◭ ◮
◭ ◮
Back Close
Full Screen / Esc
Printer-friendly Version
Interactive Discussion
Atmos. Chem. Phys. Discuss., 8, 14419–14465, 2008 www.atmos-chem-phys-discuss.net/8/14419/2008/ © Author(s) 2008. This work is distributed under the Creative Commons Attribution 3.0 License.
Atmospheric Chemistry and Physics Discussions
This discussion paper is/has been under review for the journalAtmospheric Chemistry and Physics (ACP). Please refer to the corresponding final paper inACPif available.
Parameterizing ice nucleation rates for
cloud modeling using contact angle and
activation energy derived from laboratory
data
J.-P. Chen1, A. Hazra1, and Z. Levin2
1
Department of Atmospheric Sciences, National Taiwan University, Taipei, Taiwan
2
Department of Geophysics and Planetary Sciences, Tel Aviv University, Tel Aviv, Israel
Received: 29 May 2008 – Accepted: 1 July 2008 – Published: 29 July 2008
Correspondence to: J.-P. Chen ([email protected])
ACPD
8, 14419–14465, 2008Ice nucleation rate from contact angle and activation energy
J.-P. Chen et al.
Title Page
Abstract Introduction
Conclusions References
Tables Figures
◭ ◮
◭ ◮
Back Close
Full Screen / Esc
Printer-friendly Version
Interactive Discussion Abstract
The rate of ice nucleation in clouds is not easily determined and large discrepancies ex-ist between model predictions and actual ice crystal concentration measured in clouds. In an effort to improve the parameterization of ice nucleating in cloud models, we in-vestigate the rate of heterogeneous ice nucleation under specific ambient conditions
5
by knowing the sizes as well as two thermodynamic parameters of the ice nuclei – contact angle and activation energy. Laboratory data of freezing and deposition nu-cleation modes were analyzed to derive inversely the two thermodynamic parameters for a variety of ice nuclei, including mineral dusts, bacteria, pollens, and soot particles. The analysis considered the Zeldovich factor for the adjustment of ice germ formation,
10
as well as the solute and curvature effects on surface tension, the latter effects have strong influence on the contact angle. Contact angle turns out to be a more important factor than the activation energy in discriminating the nucleation capabilities of various ice nuclei species. By extracting these thermodynamic parameters, laboratory results can be converted into a formulation that follows classical nucleation theory, which then
15
has the flexibility of incorporating factors such as the solute effect and curvature effect that were not considered in the experiments.
1 Introduction
Ice processes in clouds are important to precipitation formation thus the hydrological cycle. As Lau and Wu (2003) pointed out, more than 50% of the mid-latitude
precipita-20
tion is produced via cold-cloud (involving ice) processes, whereas in the tropical region the proportion reaches 30%. The initiation of ice formation and cloud glaciation at temperatures above about−35◦C usually requires the presence of ice nucleating par-ticles. These so-called ice nuclei (IN) can lower the energy barriers of ice nucleation so that ice particles can be produced heterogeneously at relatively warm environment.
25
They can initiate ice through the deposition mode, condensation-freezing mode,
ACPD
8, 14419–14465, 2008Ice nucleation rate from contact angle and activation energy
J.-P. Chen et al.
Title Page
Abstract Introduction
Conclusions References
Tables Figures
◭ ◮
◭ ◮
Back Close
Full Screen / Esc
Printer-friendly Version
Interactive Discussion
tact freezing mode or the immersion mode (Pruppacher and Klett, 1997, p. 309). Detailed information on atmospheric IN is rather scarce. Earlier studies measured the bulk concentration of atmospheric IN without knowing the physical or chemical properties of individual particles. Some of them characterized the ice nucleating capa-bility of IN with the co-called “threshold temperature” (e.g., Heffernan and Bracewell,
5
1959; Isono et al. 1959; Carte and Mossop, 1960; Fletcher, 1962; Cooper and Saun-ders, 1980; Bowdle et al., 1985). However, many observational studies have shown that the number concentration of ice crystals in clouds is not strictly determined by temperature (e.g., Gultepe et al., 2001; Korolev et al., 2003). In fact, the ice nucleat-ing capability in the deposition mode can be better characterized with the degree of
10
super-saturation with respect to ice (e.g., Bryant et al., 1959; Huffman 1973; Hussain and Saunders 1984; Stein and Georgii 1982). But such notion is not strictly correct either. According to classical theory, nucleation should be a probabilistic rate process, meaning that only a certain proportion of a particular kind of nuclei can be activated into ice in a specific length of time. Those “threshold” formulations are based on the
15
assumption that the nucleation rate varies sharply from negligible to significant over a very narrow range of nucleation conditions (i.e. temperature or supersaturation). Un-der such a concept, different IN may be treated to nucleate at their specific critical conditions while identical IN must nucleate all together.
The above threshold concept is adopted popularly in many meteorological cloud
20
models. Their formulations present the number of ice particles, generated through de-position or condensation-freezing nucleation, as a function of either temperature or ice supersaturation, or a combination of the two variables (e.g., Fletcher, 1962; Wisner et al., 1972; Cotton et al., 1982; Lin et al., 1983; Myers et al., 1992; Reisner et al., 1998). Although easy to use, such formulations have several deficiencies. First, the formulas
25
ACPD
8, 14419–14465, 2008Ice nucleation rate from contact angle and activation energy
J.-P. Chen et al.
Title Page
Abstract Introduction
Conclusions References
Tables Figures
◭ ◮
◭ ◮
Back Close
Full Screen / Esc
Printer-friendly Version
Interactive Discussion
Furthermore, by treating the nucleation process in a diagnostic way, such schemes cannot handle the situations when IN actually have been consumed earlier even in the same cloud, thus they tend to over-predict the number of ice particles. It is also impossible to recount the IN when the ice particles formed on them were evaporated. Furthermore, these empirical formulas obviously lose track of individual IN, thus are
5
not suitable for evaluating IN of different origins or physical properties such as size. To simulate accurately the ice-phase processes remains a difficult task for cloud modelers to this date. One of the main complexities is the properties and distribution of IN. A few species of IN have been identified as important ice initiation agent in the atmo-sphere, such as mineral dust (Kumai 1951; Isono et al., 1959), volcanic ashes (Isono
10
and Kombayashi, 1954; Isono et al., 1959), combustion particles (Hobbs and Locatelli 1969; DeMott 1990), and bio-aerosols which include whole organisms (e.g. bacteria, fungi, and phytoplankton), reproductive materials (e.g. pollens and spores) and plant fragments (Schnell and Vali, 1973; Schnell, 1974; Levin et al., 1987; Diehl et al., 2001). As will be discussed later, significant progress has been made recently in laboratory
15
measurement of ice nucleation rates of various IN. Combined with increasing model capability of simulating the emission and transport of atmospheric IN species (e.g., Lighthart 1997; Uno et al., 2003; Chen et al., 2004; Kishcha et al., 2005; Pasken and Pietrowicz, 2005), the next generation meteorological models may be able to ad-equately examine the roles that major IN played in precipitation formation. Such work
20
would be important to the understanding of interactions between land surface (includ-ing the ecosystem) and the atmospheric hydrologic cycle (Barth et al., 2005).
Laboratory derived ice nucleation rates can be used adequately in models that re-solves cloud microphysics for treatment of single or multiple IN species. However, few attempts were made to extract from these data useful information related to the
prop-25
erties of IN. If fundamental thermodynamic properties of IN can be obtained, they may not only help understanding the physical mechanisms of nucleation but also broaden the application of laboratory results by providing better parameterization for ice nucle-ation in cloud models. For example, ice nuclei, such as mineral dust, often contain
ACPD
8, 14419–14465, 2008Ice nucleation rate from contact angle and activation energy
J.-P. Chen et al.
Title Page
Abstract Introduction
Conclusions References
Tables Figures
◭ ◮
◭ ◮
Back Close
Full Screen / Esc
Printer-friendly Version
Interactive Discussion
solute coating that helps to acquire liquid water for freezing. Yet, freezing nucleation experiments often were measured under pure water conditions, and it is difficult to in-clude solute effect into empirical rate equations derived from these experiments. With the help of fundamental analysis, it may be possible to integrate the solute effect or other factors into the nucleation rate formulas. In this study we intend to show this
pos-5
sibility by re-analyzing laboratory data of ice nucleation from various IN, then obtain basic thermodynamic parameters as described by the classical theory so that a more general and accurate parameterization of ice nucleation rate can be obtained for use in cloud microphysical models.
2 Method 10
In classical nucleation theory, the heterogeneous ice nucleation rates can be calculated by knowing a few key parameters that are specific to each ice nuclei, such as the activation energies and contact angles. If the classical theory holds well, then it is possible to extract these key parameters inversely from laboratory data. Although there have been a number of laboratory studies focused on heterogeneous ice nucleation,
15
few tried to relate the measurement data to these key parameters. Here, we describe the method of analyzing classical formulas of heterogeneous ice nucleation, as well as the laboratory data and apply it to a variety of natural and anthropogenic ice nuclei.
2.1 Laboratory data
We focus on four types of IN that are common and potentially important to ice formation
20
in clouds, namely, mineral dust, bacteria, pollen, and soot particles.
Mineral dust particles have long been identified as a common and efficient IN since Kumai (1951) and others found solid silicate particles in the central portion of snow crystals. Extensive studies have been conducted since to examine the threshold tem-peratures of dust for ice nucleation. But not until recently did comprehensive
ACPD
8, 14419–14465, 2008Ice nucleation rate from contact angle and activation energy
J.-P. Chen et al.
Title Page
Abstract Introduction
Conclusions References
Tables Figures
◭ ◮
◭ ◮
Back Close
Full Screen / Esc
Printer-friendly Version
Interactive Discussion
surements of their nucleation rates were conducted. The work of M ¨ohler et al. (2006) provided one of the most detailed information of ice nucleation, including the nucleation rates and corresponding environment conditions of temperature, pressure and satura-tion ratio. Although they measured ice nucleasatura-tion on three types of dusts, we selected data (excluding a couple of data points that might be problematic) for the Arizona test
5
dust (ATD) because of their sufficient number of data and wide temperature range. Note that Archuleta et al. (2005) and Field et al. (2006) also measured ice nucleation on dusts, but they only provided the conditions required to activate a certain percentage of dust. These conditions pertain to the aforementioned concept of “threshold super-saturation” or “threshold temperature,” which are not suitable for our purpose. But from
10
Fig. 7 in Field et al. (2006) we were able to get nucleation rates for the Saharan dust (SD) and Asian dust (AD), which are more representative of natural dust than ATD.
The above measurements were performed in the large cylindrical aerosol chamber (AIDA, volume 84 m3) that was used as a moderate expansion cloud chamber at dif-ferent cloud conditions like temperature, cooling rate, and ice supersaturation. The
15
number concentration of ice particles was measured by OPC-PCS instrument, Small Ice Detector (SID, University of Hertfordshire, UK), and was retrieved also by FTIR extinction spectra. Mean adiabatic cooling rates (close to the time of nucleation) for the experiments were 1–2 K min−1. Crystals mainly formed by deposition nucleation mode. Rate of ice activated at each temperature range was obtained from the
con-20
centration ratio of activated particles to total particles divide by the specific time span. Hung et al. (2003) measured freezing nucleation on dust coated with ammonium sul-fate solution. This latter data set is used not only to derive the similar thermodynamic parameters but also to examine the closure of surface energy calculation as will be discussed in Sect. 4.
25
Bacteria are considered a major type of ice-nucleating bio-aerosols because of their ubiquity and efficient ice nucleating capability. Their freezing activity appears asso-ciated with the cell structure (Maki et al., 1974), and more precisely due to unique proteins that act as nucleation catalyst (Ruggles et al., 1993). Decaying plant leaves
ACPD
8, 14419–14465, 2008Ice nucleation rate from contact angle and activation energy
J.-P. Chen et al.
Title Page
Abstract Introduction
Conclusions References
Tables Figures
◭ ◮
◭ ◮
Back Close
Full Screen / Esc
Printer-friendly Version
Interactive Discussion
were also found to act as IN, but the ice nucleation was identified to be of bacterial origin. In fact, some plant frost injury has been shown to involve an interaction of cer-tain leaf-surface bacteria (Lindow, 1983). Worldwide availability of such nuclei was established by finding ice-forming nuclei in plant litters collected in different climatic zones (Schnell and Vali, 1973). The subsequent studies of Vali et al. (1976), Yankofsky
5
et al. (1981), Levin et al. (1987), and Hazra et al. (2004) showed that such biogenic IN might be released from the earth’s surface to the atmosphere and initiate signifi-cant ice formation at temperatures as high as−2◦C, even more effective than silver iodide which is an artificial IN commonly used for cloud seeding. In this study we took the nucleation data for two types of bacteria (Erwinia herbicolaandPseudomonas
sy-10
ringae) from Yankofsky et al. (1981) and one (Pseudomonas aeruginosa) from Hazra et al. (2004). E. herbicolaandP. syringaeare common plant-pathogenic bacteria that can infect a wide range of plant species, whereasP. aeruginosanot only infects plants but also animals and humans. But the above studies considered only immersion freez-ing nucleation mode, and we were not able to find data for the deposition nucleation on
15
bacteria.
Freezing nucleus activity ofP. syringaeand E.herbicola (Yankofski et al., 1981) of drops containing bacteria were determined in the drop freezing spectrometer. Some of these experiments were performed with the drops held for 2 min at fixed tempera-tures below 0◦C. The ice or water saturations were not recorded in these experiments.
20
Nucleation activity of P. aeruginosa (Hazra et al., 2004) was conducted in a walk-in cold chamber at water saturation and at each temperature formvar coated slides were placed for 2 min to collect ice crystals.
Pollens are another category of bio-aerosols that may spread in large quantities and over wide ranges. Their surface contains active sites that enable them to take up water
25
ACPD
8, 14419–14465, 2008Ice nucleation rate from contact angle and activation energy
J.-P. Chen et al.
Title Page
Abstract Introduction
Conclusions References
Tables Figures
◭ ◮
◭ ◮
Back Close
Full Screen / Esc
Printer-friendly Version
Interactive Discussion
kinds of pollens. They found that pollens initiate ice nucleation not via the deposition mode but by immersion freezing or condensation-freezing within the investigated tem-perature and ice supersaturation ranges. Von Blohn et al. (2005) extended the study by including more pollen types. From Diehl et al. (2001) we took nucleation data for four kinds of pollens: birch, oak, grass, and pine. As only the fractions of nucleation
5
were provided, we again obtain their experiment time of 1 min by personal commu-nication. In addition, our own study measured the freezing nucleation rates for the pollens of eucalyptus and China Rose following the procedure of Hazra et al. (2004). These results are also included in our analysis. Freezing nucleation of eucalyptus and China Rose pollen was done in the same way asPseudomonas aeruginosamentioned
10
earlier. Condensation freezing efficiency of different pollen (Deihl et al., 2001) carried out inside the walk-in cold chamber where glass flask having diameter of 30 cm was installed. At supersaturation with respect to water pollen grains were scattered at equi-librium temperature for a short period (nearly 1 min) and activated grains fell down onto a soap film.
15
When Kumai (1951) and others analyzed the nucleation center of snow crystals, they also found that some of the cores were composed of combustion products such as soot. Subsequent evidence of soot as ice nuclei was suggested by Hobbs and Locatelli (1969) as well as Langer (1973) who observed a significant increase of IN downwind of burning forest or sugarcane fields. Similar mechanism was proposed
20
by Str ¨om and Ohlsson (1998) who found that cirrus ice crystals in a region of heavy air traffic often contain soot-like particles. In a laboratory experiment, Gorbunov et al. (2001) showed that soot surface contains chemical groups which can form hydro-gen bonds with water molecules, thus enhance ice nucleation. However, in contrast to the aforementioned IN species, soot particles can only initiate ice nucleation at rather
25
low temperatures as pointed out by Hallett et al. (1986), DeMott (1990) and Dymarska et al. (2006). In the latter study, ice nucleation never occurred at temperatures above 248 K. Both DeMott (1990) and Dymarska et al. (2006) showed that soot particles ini-tiate ice formation almost exclusively via the freezing nucleation mode. We took the
ACPD
8, 14419–14465, 2008Ice nucleation rate from contact angle and activation energy
J.-P. Chen et al.
Title Page
Abstract Introduction
Conclusions References
Tables Figures
◭ ◮
◭ ◮
Back Close
Full Screen / Esc
Printer-friendly Version
Interactive Discussion
nucleation fraction data of DeMott (1990), the one that provided sufficient informa-tion. For this experimental data, soot particles were generated using simple oxygen-deficient acetylene burner and injected into the CSU dynamic cloud chamber (volume 1.2 m3) to see its nucleation activity during expansion to −40◦C with adiabatic cool-ing of 1◦C min−1. The freezing rate per unit volume was calculated between −26◦C
5
and−34◦C. Ice crystals were detected by extinction in a laser-based detection device (DeMott and Rogers, 1990). Most crystals formed by immersion freezing mode. Cumu-lative fraction nucleated as a function of temperature was presented in this experiment. Thus when temperature goes down, soot particles that are not nucleated at a particular temperature have a very little effect on nucleation rate at another temperature.
10
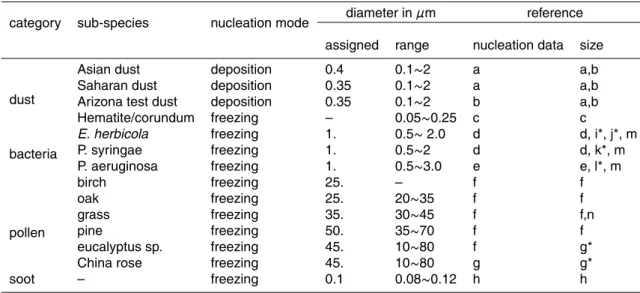
In addition to the nucleation rates and ambient conditions, the sizes of these IN are also important to our analysis of the thermodynamic parameters for ice nucleation. Some experiments provide exact information of particle sizes and other relevant exper-imental data, while others lack this type of information. For the missing information we resort to other literatures to obtain estimations. Uncertainties of such estimations will
15
be discussed later. Table 1 gives a summary of the types of IN, as well as their mode of nucleation, representative size and actual size range that will be used for analysis later.
2.2 Classical nucleation theory
Classical nucleation theory is straightforward, but is repeated here for discussion
pur-20
pose. The rate of heterogeneous nucleation per particle can be expressed as (Mason, 1974, p. 474–478; Hagen et al., 1981; Pruppacher and Klett, 1997, p. 303):
J=4πrN2Js =4πrN2A1n1·exp
−∆gg kT
!
·Z, (1)
whererN is the radius of ice nuclei,Js is the rate of surface nucleation, A1is the rate
at which the critical embryo gains one molecule through interaction with the parent
ACPD
8, 14419–14465, 2008Ice nucleation rate from contact angle and activation energy
J.-P. Chen et al.
Title Page
Abstract Introduction
Conclusions References
Tables Figures
◭ ◮
◭ ◮
Back Close
Full Screen / Esc
Printer-friendly Version
Interactive Discussion
phase,n1 is the number of single molecules in contact with unit area of the substrate,
∆gg is the energy of critical embryo (germ) formation,k is the Boltzmann constant, T
is temperature, andZ is the Zeldovich factor which modifies the nucleation rate by ac-counting for the depletion of embryo population due to germ production (cf. Pruppacher and Klett, 1997, p. 202; Vehkam ¨aki et al., 2007):
5
Z =n1 g ·
s
∆gg
3πkT. (2)
Here,ngis the number of water molecule in the ice germ, defined as:
ng = 4πr
3
g
3vw , (3)
where vw is the volume of a water molecule and rg is the radius of embryo germ (which can be derived according to classical nucleation theory and its definition will
10
be shown later). Equation (1) can be applied to ice nucleation from both the vapor phase (deposition nucleation) and liquid phase (freezing nucleation). Details of the parametersA1,n1,∆gg and rg pertaining to each of these two nucleation modes are given separately below.
2.2.1 Deposition nucleation
15
For deposition nucleation, the parametersA1in Eq. (1) is determined from the kinetic
theory (Mason, 1974, p. 474):
A1=4πrg2
e p
2πmwkT, (4)
whereeis the vapor pressure,mw is the mass of a water molecule, and the germ size
rg can be expressed as:
20
rg = 2vwσi /v
kT lnSi, (5)
ACPD
8, 14419–14465, 2008Ice nucleation rate from contact angle and activation energy
J.-P. Chen et al.
Title Page
Abstract Introduction
Conclusions References
Tables Figures
◭ ◮
◭ ◮
Back Close
Full Screen / Esc
Printer-friendly Version
Interactive Discussion
in whichσi /v is the surface tension between ice and vapor, and Si is saturation ratio with respect to ice. The second parameter,n1, inJs can be determined under the as-sumption of a steady state adsorption-desorption fluxes (Pruppacher and Klett, 1997, p. 300):
n1=
e
vsp2πmwkT exp −
∆gd kT
, (6)
5
whereνs is the frequency of vibration of water vapor molecule adsorbed on solid sub-strate,∆gd is the energy of desorption. According to classical nucleation theory, the energy of germ (critical embryo) formation for heterogeneous nucleation∆gg in Eq. (1) is simply the homogeneous nucleation energy of germ formation,∆ggo, modified by a geometrical factorf:
10
∆gg= ∆gog·f (7)
where
∆gog=
16πvw2σi /v3
3∆g2
b =
16πvw2σi /v3
3[kTlnSi]2 =
4π
3 σi /v·r
2
g, (8)
and∆gb is the bulk free energy of phase change. The geometric factor for ice germ formation on a planar surface is a function of the contact angle only:
15
f =f(m)=(2+m)(1−m)
2
4 , (9)
ACPD
8, 14419–14465, 2008Ice nucleation rate from contact angle and activation energy
J.-P. Chen et al.
Title Page Abstract Introduction Conclusions References Tables Figures ◭ ◮ ◭ ◮ Back Close
Full Screen / Esc
Printer-friendly Version
Interactive Discussion f =f(m, q)=1
2 ( 1+ 1 −mq φ 3 +q3
" 2−3
q −m φ + q −m φ 3#
+3mq2 q
−m φ −1
) ,(10)
where φ≡p1−2mq+q2, and q≡r
N/rg. When rN approaches zero or the contact angle is at its extreme (θ=π), the geometric factorf approaches unity so the condition reduces to homogeneous nucleation. ForrN approaches infinity, f should reduce to Eq. (9) (i.e. for a planar surface).
5
2.2.2 Freezing nucleation
For freezing nucleation, Turnbull and Fischer (1949) gave the parameterA1as:
A1=
kT h exp
−∆ga
kT
, (11)
where h is the Plank’s constant, and ∆ga is activation energy for the transfer of a water molecule across the water-ice boundary. Similar to Eq. (8), the energy of germ
10
formation for homogeneous freezing is:
∆gog=
16πvw2σi /w3
3∆g2b =
16πvw2σi /w3
3[kTln(eswesi)]2 =
4π
3 σi /w·r
2
g, (12)
whereσi /wis the surface tension between ice and liquid water, andeswandesi are the saturation vapor pressure over water and ice, respectively. Note that for the freezing of solution, the parameter esw in Eq. (12) should be modified by the water activity
15
of the solution (cf. Mason 1974, p. 491; Heymsfield and Sabin 1989). In contrast to that for deposition nucleation, the parameter n1 for freezing nucleation does not
vary significantly. For a water density of 1 g cm−3, one can easily calculate thatn1 =
1.0×10¹⁹m−2, which is the same as that given in Fletcher (1962) but much larger that the 5.3×10¹⁶m−2 given by Eadie (1971; also see Pruppacher and Klett, 1997, p.
20
ACPD
8, 14419–14465, 2008Ice nucleation rate from contact angle and activation energy
J.-P. Chen et al.
Title Page
Abstract Introduction
Conclusions References
Tables Figures
◭ ◮
◭ ◮
Back Close
Full Screen / Esc
Printer-friendly Version
Interactive Discussion
nucleation modes. Another parameter that needs to be defined for freezing nucleation is the size of the ice germ:
rg =
2vwσi /w kTln(esw
esi)
. (13)
3 Linearization analyses of classical theory
The nucleation rate given in Eq. (1) consists of two groups of parameters; (A)
ambi-5
ent variables such as air temperature (and temperature dependent variables), vapor pressure and ice supersaturation; (B) particle variables, including particle sizerN, the activation energy (∆gd for deposition nucleation or∆ga for freezing nucleation), and the contact angleθ(or the wetting coefficientm). Existing laboratory studies provided the nucleation rates and the corresponding environment variables of group (A). But the
10
particle parameters of group (B), particularly the activation energy and contact angle, are virtually unknown for common atmospheric IN. Our main task is to derive these pa-rameters from laboratory measurements. This can be done by first rearranging Eq. (1) into:
J=A′·rN2 ·pf ·exp −∆g
#
−∆gg
kT
!
, (14)
15
whereA′depends on ambient parameters only;∆g# is either∆gd in Eq. (6) or∆ga in Eq. (11), and they will be generally termed the activation energy for future discussion. One can see that the rate equation for both nucleation modes can be expressed in the same form. For deposition nucleation,∆g#=∆gd and
A′= 2π(rge)
2
mwkT νsng
√
3π · s
∆gog kT =
e2vw
mwkT νs · s
σi /v
kT . (15)
ACPD
8, 14419–14465, 2008Ice nucleation rate from contact angle and activation energy
J.-P. Chen et al.
Title Page
Abstract Introduction
Conclusions References
Tables Figures
◭ ◮
◭ ◮
Back Close
Full Screen / Esc
Printer-friendly Version
Interactive Discussion
For freezing nucleation,∆g#=∆gaand
A′=4π· 1 ng ·
s
∆gog
3πkT · kT
h ·n1 (16)
The rate Eq. (14) contains three parameters that are properties of the ice nuclei: parti-cle sizerN, activation energy∆g#, and wetting coefficientm(or contact angle). With a few sets of nucleation rate and ambient condition data that measured in the laboratory,
5
it is possible to derive these particle parameters from Eq. (14) particularly when the particle size is known. In the following, we intent to linearize Eq. (14) and perform data fitting to derive the two parameters∆g#andm.
3.1 Initial analysis
Recall from Eq. (10) that the geometric factorf is a complicated function of nuclei size,
10
contact angle, and air properties. But under typical conditions, its primary dependent variable is the contact angle. So we shall first assume it is a constant, taking the form of Eq. (9), and extend the analysis later for an exact f. By taking the logarithmic of Eq. (14), we have
kT lnJ/A′/rN2
| {z }
y
=kT lnpf −∆g#
| {z }
a
− f |{z}
b
·∆ggo |{z}
x
, (17a)
15
This formula is arranged in such a way thatxandy can be directly determined from the experimental data, whereas the particle-related parameters are kept in the coefficients
aandb. Therefore, by fitting the experimental data with the linear equationy=a−bx, we are able to derive the coefficientsa andb, and from which we can obtain the par-ticle parameters. For example, using Eq. (17a), the geometric factorf can be derived
20
immediately as it is exactly the coefficient b. However, the coefficient a contains air temperature and thus is not truly a constant, and the uncertainties contained in it will
ACPD
8, 14419–14465, 2008Ice nucleation rate from contact angle and activation energy
J.-P. Chen et al.
Title Page
Abstract Introduction
Conclusions References
Tables Figures
◭ ◮
◭ ◮
Back Close
Full Screen / Esc
Printer-friendly Version
Interactive Discussion
inevitably pass to the value ofb. This also means that we are not able to obtain directly the second parameter, the activation energy∆g#, from the coefficienta.
To derive the value of the activation energy, we can take a variation of Eq. (17a) as:
kT ln J/A′+f ·∆gog−kTlnpf
| {z }
y
=−∆g#
| {z }
a
+lnr2
N
| {z }
−b
· kT |{z}
x
. (17b)
In this formula, we applied intoy the previously derived coefficientf as an initial guess.
5
This gives us not only the value of∆g#but also the nuclei size which we use to indicate the robustness of our method. Of course, all values derived so far still contain the previously mentioned uncertainties. Some of the uncertainties can be minimized by introducing another variation of Eq. (17a):
ln J/A′+ ∆g#/kT
| {z }
y
=ln(rN2pf)
| {z }
a
− f |{z}
b
·∆ggo/kT | {z }
x
. (17c)
10
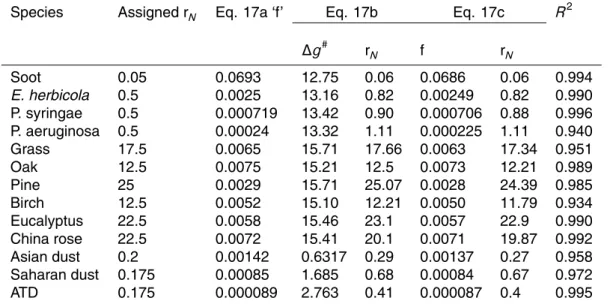
Here, we can apply the ∆g# obtained from Eq. (17b) into y to re-derive f . Further calculation by iteration between the two procedures (Eqs. 17b and 17c) has been tried, but the results do not converge. But this is not a problem because we only want to obtain an initial estimation and get a sense of the order of magnitude of the desired parameters. More detailed analysis will be performed in the next section.
15
Table 2 shows the results obtained by a simple iteration from Eqs. (17a) to (17c) for the species shown in Table 1. One can see that the two values off are quite close to each other, but the calculatedrN may differ significantly from the originally assigned values for some IN species. The discrepancy inrN arises either from the uncertainties in the formulation procedure or due to the assumption of constantf. In the next section
20
ACPD
8, 14419–14465, 2008Ice nucleation rate from contact angle and activation energy
J.-P. Chen et al.
Title Page
Abstract Introduction
Conclusions References
Tables Figures
◭ ◮
◭ ◮
Back Close
Full Screen / Esc
Printer-friendly Version
Interactive Discussion
3.2 Refined geometric factor
In the above analysis, we have assumed thatf takes the form of Eq. (9) and is inde-pendent of the ambient parameters. But in factf is also a function of particle sizerN
and the germ sizerg as given in Eq. (10). For a more accurate analysis we need to consider these dependences. But the original form of Eq. (10) is too complicated to be
5
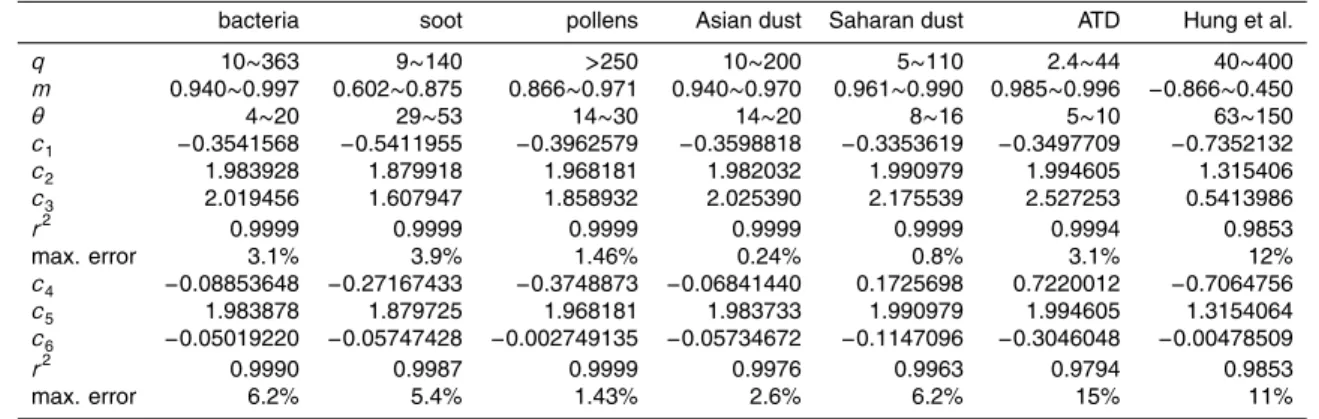
decomposed for the analysis done in the previous section. This problem can be cir-cumvented by fitting Eq. (10) into either of the following two equations, which separate out particle size (contained inq) and contact angle:
lnf ≈c1+c2·ln(1−m)+c3/q. (18a)
lnf ≈c4+c5·ln(1−m)+c6·lnq, (18b)
10
The coefficients of the above equations are given in Table 3 for the species of IN con-sidered in this study under appropriate ranges ofq and θ. The coefficients of deter-mination (R2) for these fittings are all greater than 0.98, and their maximum errors are quite small except for ATD.
By applying Eq. (18a) into Eqs. (17a) and (17b), we obtained two variations of fitting
15
on the nucleation rate formula as done in the previous section but without assumingf
as a constant:
kT{lnJ/A′/r2
N
−0.5·(c1+c3·rg/rN)−0.5·c2·ln(1−m)}
| {z }
y =−∆g#
| {z }
a
−(1−m)c2
| {z }
b
·∆gog·exp(c1+c3·rg/rN)
| {z }
x
(19a)
lnJ/A′/rN2+ ∆g#(kT)−0.5·(c1+c3·rg/rN)
| {z }
y =0.5·c2·ln(1−m)
| {z }
a
−(1−m)c2
| {z }
b
·∆go(kT)·exp(c1+c3·rg/rN)
| {z }
x
(19b)
ACPD
8, 14419–14465, 2008Ice nucleation rate from contact angle and activation energy
J.-P. Chen et al.
Title Page
Abstract Introduction
Conclusions References
Tables Figures
◭ ◮
◭ ◮
Back Close
Full Screen / Esc
Printer-friendly Version
Interactive Discussion
In both equations, the coefficientsaandbno longer contain ambient parameters but are purely functions of the particle parameters∆g#(activation energy) andm (cosine contact angle). However, the independent variabley also contains these supposedly unknown parameters. So, we need an initial guess of eithermor∆g#in order to solve Eqs. (19a) and (19b) iteratively. But now it is not necessary to go through a similar
5
procedure as Eq. (17a) to get the initial guess because the results in Table 2 already suffice the purpose. The calculations converged quickly within three iterations after including more accurate treatment of the factorf. Note that we also applied Eq. (18b) into Eq. (17b) to obtain a fitting formula in the form of:
ln J/A′+ ∆g#(kT)−0.5·(c4−c5lnrg)
| {z }
y =lnr2
N+0.5·[c5·ln(1−m)+c6·lnrN]
| {z }
a
−(1−m)c5·rc6 N
| {z }
b
·∆go(kT)·exp(c4)·r−
c6 g
| {z }
x
(19c)
10
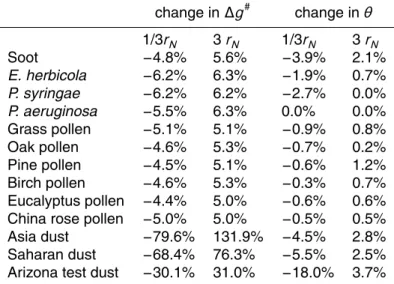
This fitting formula, when used in conjunction with either Eq. (19a) or Eq. (19b), gives very similar results as before. Furthermore, it also gives the nuclei size which we use to check the self-consistency. The refined results are given in Table 4. We can see that the values of∆g# differ slightly from those in Table 2 for all species except dusts, for the latter the deviation may reach 90% (Saharan dust). The differences inmbehaved
15
similarly, with the largest discrepancy of about 40% occurred in the species ATD. These large errors signify the importance of a more detailed treatment of the factorf. Note that the calculatedrN are now very close to their assigned values, and this is a good indication of self-consistency of our method.
3.3 Curvature and solute effects on surface tension
20
ACPD
8, 14419–14465, 2008Ice nucleation rate from contact angle and activation energy
J.-P. Chen et al.
Title Page
Abstract Introduction
Conclusions References
Tables Figures
◭ ◮
◭ ◮
Back Close
Full Screen / Esc
Printer-friendly Version
Interactive Discussion
we included the solute effect onesw in Eq. (12) by multiplying it with the water activity using the empirical formula in Chen (1994). Note that in Hung et al. (2003) the mea-surements for hematite (Fe2O3) were done in a rather narrow temperature range, but
their different dust sizes give extra variability that benefits our analysis. However, for corundum (Al2O3) there is only one measurement temperature, which makes the fitting
5
analysis difficult and no reasonable result was obtained. Our calculation shows that the contact angle of ice germ on hematite ranges from 109.2◦ at low solute concen-tration (mole fractionχ=0.03) to 74.4◦ at high solute concentration (χ=0.13). Similar to our approach, Hung et al. (2003) applied measurement data into classical theory to find an optimized value of contact angle, except that they apparently neglected the
10
Zeldovich factor in Eq. (1) as well as the activation energy term and other details that will be discussed later. The contact angles they obtained were 90◦ or 97◦, depending on the different criteria they set. Although the two calculations seem to be reasonably close to each other, these contact angles are significantly larger than for other types of freezing IN shown in Table 4. As will be discussed later, contact angle is the most
15
important factor in determining the nucleation capability of IN. The large angles derived above would imply a poor nucleating capability of hematite that is even inferior to soot. Such a result seems to be at odds with the perceptions that mineral dusts typically have higher threshold temperature of nucleation than soot, and this prompted us to go back over our analysis.
20
The first missing factor that we found is the effect of solute on the surface tension of water, which strongly influences the germ formation energy and germ size. Un-fortunately, no data exist for the surface tension between ice and water solution. We overcome this by applying the Antonoff’s rule, which states that the surface tension between a solid and liquid (σi /l) can be approximated by the difference between the
25
surface tension of solid-air interface (σi /a) and that of liquid-air interface (σl /a):
σi /l ≈σi /a−σl /a, (20)
where the subscript “l” represents a solution to contrast with the subscript “w” that we used to for pure water. The values ofσi /acan be found in various literatures, whereas
ACPD
8, 14419–14465, 2008Ice nucleation rate from contact angle and activation energy
J.-P. Chen et al.
Title Page
Abstract Introduction
Conclusions References
Tables Figures
◭ ◮
◭ ◮
Back Close
Full Screen / Esc
Printer-friendly Version
Interactive Discussion
the value ofσl /a for the solutions of ammonia sulfate and several other solute species can be obtained from Chen (1994). As σl /a increases with increasing ammonium sulfate concentration, surface tension between ice and solution (σl /a) becomes lower under the presence of solute. Table 5 listed the calculated thermodynamic parameters with and without the consideration of solute effect on surface tension. Unfortunately,
5
under a solute mole fraction of χ=0.03, the value of contact angle did not become smaller as hoped; whereas for the high solute concentration the wetting parameterm
even exceeded its lower bound of−1, thus no contact angle can be obtained. So, the inclusion of solute effect leads us in the wrong direction.
Another important factor that may influence contact angle is the curvature
adjust-10
ment of surface tension on ice germs. Tolman (1949) suggested that surface tension deviates from its bulk value when the particle is small, and the size adjustment follows
σA/B′ =σA/B∞ ·φ, whereσ∞is the bulk surface tension, and subscriptsAandBrepresent the particle phase (here, ice germ) and the medium phase (here, water or air), respec-tively. The proportionality coefficient can be expressed as (also see Dufour and Defay
15
1963, p. 61):
φ= 1
1+2Γr
A(ρA−ρB)
≡ 1
1+2δr A
, (21)
whererAis the particle size,ρis the density of the phase that indicated by its subscript, Γ=1.55×10⁻⁷kg m−2is the Gibbs surface adsorption, and
δ≡Γ/(ρA−ρB). (22)
20
ACPD
8, 14419–14465, 2008Ice nucleation rate from contact angle and activation energy
J.-P. Chen et al.
Title Page
Abstract Introduction
Conclusions References
Tables Figures
◭ ◮
◭ ◮
Back Close
Full Screen / Esc
Printer-friendly Version
Interactive Discussion
a more general formula of curvature adjustment for nanocrystals in the gas phase:
φ= 1− 1 4r/δ−1
!
·exp − 2E 3RT ·
1 4r/δ−1
!
, (23)
whereE is the bulk energy of phase transformation andR is the gas constant. We ex-tended the use of their formula to other particle-medium systems by applying Eq. (22) for the factor δ, and found that it can be safely applied to all our situations. Besides
5
influencing contact angle, curvature adjustment may also affect the germ size and en-ergy of germ formation. From Eqs. (5) and (13) we see that the germ size is directly proportional to the surface tension, so it should be modified accordingly with
rg′ =rg∞·φ, (24)
whererg∞ is the bulk germ size given by Eqs. (5) or (13). However, the factorφitself
10
is a function of the germ size as can be seen in Eq. (23). Thus,rg′ andφ need to be solved simultaneously (e.g. by iteration) from Eqs. (23) and (24).
From Eq. (23) one can see that the curvature adjustment depresses both the surface tension and size of ice germ that is embedded in air (e.g. deposition nucleation), but enlarge them if the surrounding medium is water (e.g. freezing nucleation). As shown in
15
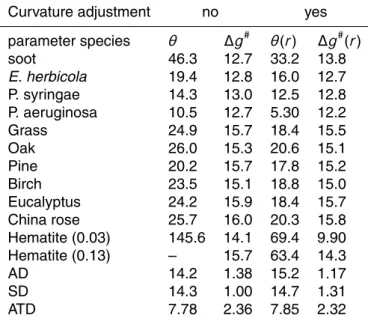
Table 5, the resulting contact angle of 69.4◦atχ=0.03 has shifted toward the desirable direction. Furthermore, the originally invalid value at χ=0.13 now becomes a much more reasonable 63.4◦. But these contact angles are still larger than that of soot. In the next section we will further elaborate the inconsistency of these values with other data.
20
In Table 6 we recalculated the contact angle and activation energy with the consid-eration of curvature adjustment for all species, and compare them with the old values shown in Table 4. One can see that the curvature adjustment generally results in smaller contact angles for freezing nucleation and inversely so for deposition nucle-ation. As for the activation energies the influence is less prominent. Those values
25
ACPD
8, 14419–14465, 2008Ice nucleation rate from contact angle and activation energy
J.-P. Chen et al.
Title Page
Abstract Introduction
Conclusions References
Tables Figures
◭ ◮
◭ ◮
Back Close
Full Screen / Esc
Printer-friendly Version
Interactive Discussion
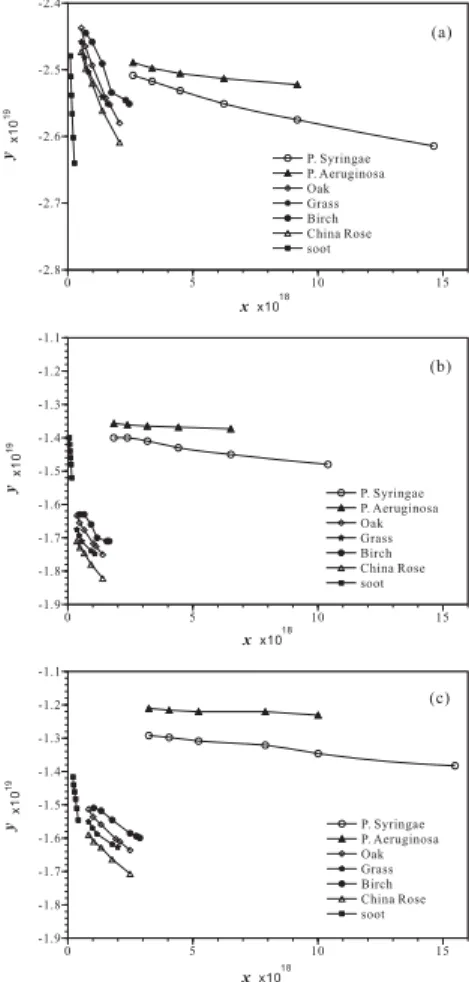
Take Eqs. (17a) and (19a) as examples, we show the effects of linearization on the distribution of experimental data in Fig. 1. Figure 1a uses Eq. (17a) but neglects cur-vature adjustment; Fig. 1b and 1c are both from Eq. (19a) but without and with the curvature adjustment, respectively. From Fig. 1a one can see that Eq. (17a) already produced fairly good linearization. The curves are grouped naturally according to the
5
general species types (i.e. bacteria, pollens or soot), and the distinct slope reflects the wetting parameterf that is unique for each species. Results from Eq. (19a) are not much different in terms of the degree of linearization. But more importantly, these curves give more accurate values of contact angle and activation energy. The effect of curvature adjustment is shown in Fig. 1c as oppose to Fig. 1b. One can see significant
10
changes in the values ofxandy, resulting in substantial changes in the slope (mainly representing the contact angle) and intercept (mainly representing the activation en-ergy). Note that the inclusion of curvature adjustment also slightly improved theR2 of linear regression.
4 Discussions 15
4.1 Relative significance of the activation energies and contact angles
Table 6 can tell us about the ice nucleating ability of various species. We can see that activation energy∆gafor freezing nucleation is the highest for pollens and slightly lower for bacteria and soot, but the differences between species and, particularly, between sub-species are not significant except for hematite. However, all the differences in∆g# 20
are too small to account for the vastly different nucleation capability among species. By examining Eq. (14) one may realize that ∆g# (either ∆ga or ∆gd) is not a major factor in determining the nucleation rate because there is another stronger energy requirement for nucleation – the energy of germ formation ∆gg. Typically, ∆gg are of the order of 10−16 to 10−18J, about two to three orders of magnitude larger than
25
ACPD
8, 14419–14465, 2008Ice nucleation rate from contact angle and activation energy
J.-P. Chen et al.
Title Page
Abstract Introduction
Conclusions References
Tables Figures
◭ ◮
◭ ◮
Back Close
Full Screen / Esc
Printer-friendly Version
Interactive Discussion
activation energy becomes important. Another interesting contrast is that changes in the activation energy are relatively smaller for the freezing mode than for the deposition mode nucleation. This implicates that the adsorption energy of vapor (∆gd) is sensitive to the composition or surface structure of the substrate, whereas the activation energy for the transfer of a water molecule across the water-ice boundary (∆ga) is not.
5
Let us see if the difference in contact angles may reflect the nucleation capability. Bacteria have significantly smaller contact angles (see Table 6), and this indeed reflects the fact that bacteria are better IN than the other freezing mode species as shown by the nucleation rate data or the so-called threshold temperature.Pseudomonas aerug-inosa obviously is a more effective IN because of its smallest contact angle. Soot
10
seems to have a lower (but only slightly) activation energy, yet it has a rather large con-tact angle. Exacerbated by its small size, soot apparently is not a very effective IN as can be seen from Eq. (1) for the size dependence of the nucleation rate. Pollens have the advantages of large sizes and relatively small contact angles, and thus they are relatively efficient ice nucleating agents. Among the six types of pollens, pine pollen
15
has the smallest contact angle and largest size thus it should have better nucleation ability than other pollens, and this is confirmed by the experimental data. Hematite has the largest contact angle thus its freezing nucleation capability is even lower than soot. For the three deposition-mode dust species, the contact angles are rather small, particularly for the Arizona test dust and next to it the Asian dust, indicating mineral
20
dusts are good nucleation agent, at least by deposition nucleation. We are not able to explain why the contact angle for freezing on a seemly similar mineral dust – hematite – is much larger, except that hematite might not represent common mineral dust in the atmosphere.
4.2 Verification of results
25
There are very little direct measurements on the activation energies for the types of IN and nucleation conditions considered in this study, and essentially none for the contact angles. Therefore, it is difficult to get a direct comparison and verification for the results
ACPD
8, 14419–14465, 2008Ice nucleation rate from contact angle and activation energy
J.-P. Chen et al.
Title Page
Abstract Introduction
Conclusions References
Tables Figures
◭ ◮
◭ ◮
Back Close
Full Screen / Esc
Printer-friendly Version
Interactive Discussion
shown in Table 6. However, by comparing with similar data one may get a sense of the correctness of our findings. We first look at∆ga, the activation energy for the transfer of a water molecule across the water-ice boundary.
Hagen et al. (1981) applied an approach similar to ours to analyze measurement data of nucleation rate, but for homogeneous freezing, to derive∆ga. They obtained
5
8×10⁻²⁰ J (per H2O molecule) for∆ga at−40◦C, and this value roughly increases by 0.3×10⁻²⁰ per degree K of temperature rise. If their calculation can be extrapolated to the temperature range of the experimental data, it would be similar to the values calcu-lated here, which lie between 10×10−20 and 16×10−20 J. Pruppacher and Klett (1997, Table 7.3) also calculated∆gabut found somewhat lower values: 3×10⁻²⁰ J at−36◦C
10
and increases to 5.4×10⁻²⁰ J at −29◦C. Note that the activation energy ∆ga might have different controlling mechanisms at different temperatures. Hagen et al. (1981) suggested that at temperatures warmer than −29◦C, the transfer of water molecules across the water-ice interface is limited by the self-diffusion through the bulk water, while at temperatures lower than−32◦C the transfer is by large water clusters.
15
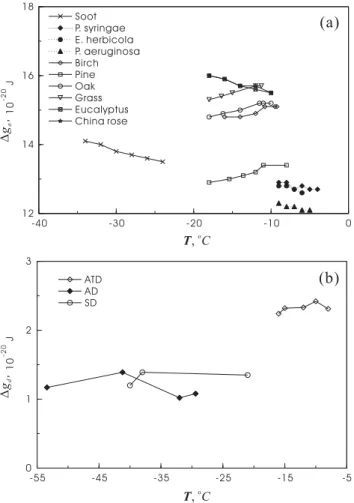
The values of∆g#that we derived should be considered as averages over the tem-perature range of each experimental data set. In principle, one should be able to get the temperature dependence by inserting the parameters rN and contact angle from Table 6 along with the measured nucleation rate into Eq. (14) to get∆g#at each mea-sured temperature. Of course, this has to be done under the assumption thatm is a
20
constant with respect to temperature. Figure 2 shows the activation energies that were calculated this way. Within each species, the variation of∆gawith temperature (Fig. 2a) is not significant comparing to the theoretical estimations of Hagen et al. (1981) and Pruppacher and Klett (1997) for homogeneous nucleation. This suggests either that our method and data are not sufficient to resolve it or that there exist other factors that
25
diminish the temperature dependence. One possible cause for the difference is that the factor m also depends on temperature, and neglecting this somehow offset the tem-perature dependence of∆ga. Thus, we tried to fix ∆g# as an alternative to calculate
ACPD
8, 14419–14465, 2008Ice nucleation rate from contact angle and activation energy
J.-P. Chen et al.
Title Page
Abstract Introduction
Conclusions References
Tables Figures
◭ ◮
◭ ◮
Back Close
Full Screen / Esc
Printer-friendly Version
Interactive Discussion
temperature. It is also possible that the presence of IN substrate regulated the value of∆gaso its behavior deviates from that for homogeneous nucleation. As can be seen from Fig. 2a, the differences in∆gaamong species are greater than for single species at different temperatures.
For the deposition nucleation mode, the activation energy is the energy of adsorption
5
of water vapor onto the IN substrate but represented by the energy of desorption∆gd. Since the adsorption process strongly depends on the properties of the substrate, one would expect the value of∆gd to change more significantly among species as com-pared to the changes in∆ga. Indeed, our values of∆gd vary by more than one fold, even though they are all for mineral dusts, whereas those for freezing nucleation vary
10
within 40% among different species. Some direct measurements of∆gd can be found in the literature for comparison. Seisel et al. (2004) found the adsorption energy of water vapor on mineral dust to be 6.6×10⁻²⁰ J; Hu and Michaelides (2007) obtained 1×10⁻¹⁹J for water adsorption on Kaolinite; whereas Gustafsson et al. (2005) obtained 7.6×10⁻²⁰ J for calcite and 8.7×10⁻²⁰J in the case of Arizona Test Dust. Although our
15
values are of the right orders of magnitude, they are somewhat lower than those found in the literature. Note that the adsorption energy is controlled by not only the chem-ical composition but also the physchem-ical properties such as roughness and defects of the substrate. This implies that the way the dust samples are processed in the lab-oratory may influence the value of∆gd. Also note that, as shown in Fig. 2b, we did
20
not find an obvious temperature trend for∆gd. The following are a few measurement data on adsorption energy which might be useful for relevant atmospheric applications: 4.9×10⁻²⁰J on grey soot and 6.3×10⁻²⁰ J on black soot (Alcala-Jornod et al., 2002), and 1.5×10⁻¹⁹ J for AgI (Corrin and Nelson, 1968). One can see that the difference between species is pretty much the same as that between sub-species of dusts.
25
Contact angle is more important in determining the heterogeneous nucleation ability. Unfortunately, most of the past efforts were done for the contact angle of liquid water as enclosed by air and the substrate, which is conventionally written asθw/a. Yet, the contact angles that we are considering here are for ice, as enclosed either by air and
ACPD
8, 14419–14465, 2008Ice nucleation rate from contact angle and activation energy
J.-P. Chen et al.
Title Page
Abstract Introduction
Conclusions References
Tables Figures
◭ ◮
◭ ◮
Back Close
Full Screen / Esc
Printer-friendly Version
Interactive Discussion
substrate (θi /a; for deposition nucleation) or by liquid water and substrate (θi /w; for freezing nucleation). The only attempt that we are aware of to find the contact angle of ice is the study of Hung et al. (2003), but those values were not measured directly but were obtained by a similar analysis as ours. Here we introduce an indirect way of verifying the results on contact angle. According to the Young-Dupr ´e relation, the
5
contact angles can be expressed as:
cosθw/a=
σs/a−σs/w σw/a
, (25)
cosθi /a= σs/a−σs/i
σi /a
, (26)
cosθi /w = σs/wσ−σs/i i /w
, (27)
where the subscripts represent the interface between any two of the following phases:
10
liquid water (w), ice (i), air (a) or substrate (s). A closure of the equation set Eqs. (25) to (27) can be obtained by using Eqs. (26) and (27) to replaceσs/aandσs/win Eq. (25) and obtain:
cosθw/a=
cosθi /a·σi /a−cosθi /w·σi /w σw/a
. (28)
In this equation the values ofσw/a,σi /w andσi /a(with temperature dependence) can
15
be found in many textbooks (e.g., Pruppacher and Klett, 1997). Then, using values of
θi /a from the literature and values of θi /w obtained here, one may derive θw/a from Eq. (28).
If one assumes that hematite is similar to the other mineral dusts, then the freezing contact angle θi /w of hematite and the deposition contact angle θi /a of ATD, AD or
20
ACPD
8, 14419–14465, 2008Ice nucleation rate from contact angle and activation energy
J.-P. Chen et al.
Title Page
Abstract Introduction
Conclusions References
Tables Figures
◭ ◮
◭ ◮
Back Close
Full Screen / Esc
Printer-friendly Version
Interactive Discussion
Bergh (1965) observed a contact angle of less than 6◦on SiO2, but it increases to 40◦ after heat treatment of the substrate; Chen et al. (1993) measured 33◦on SiO2and 57◦
on Al2O3; Janczuk and Zdziennicka (1994) measured 26.8◦on quartz; Pruppacher and
Klett (1997, Table 5.2) reported 43∼52◦on quartz (beach sand); whereas Gence (2005) reported 10.5◦ on magnesite and 6.7◦ on dolomite. One can see that there is a large
5
spread in the values of water contact angle on different minerals. In any case, to derive from Eq. (28) a reasonable value ofθw/a within the range reported above,θi /w must be smaller than θi /a. Yet, the results in Table 6 show just the opposite. Note thatθi /w would be even larger when extrapolated to pure water situation. The above inconsistencies indicate that either we missed some aspects of the ice germ calculation
10
or the hematite particle used by Hung et al. (2003) behave very differently from the other dust species considered here. If the latter is true, then it is still feasible to apply the above method to derive one contact angle with the knowledge of the other two. Of course, experimental data on both the deposition mode and freezing mode nucleation for the same IN species would be necessary for verification. It is also possible that the
15
data of Hung et al. (2003) were measured over a temperature range that is too narrow for an accurate fitting with our method, or the formula for curvature adjustment (Eq. 23) is not accurate enough.
4.3 Application to other nucleation modes
In Sect. 4.2 we discussed the possibility of using the contact angles in Table 6 to
de-20
rive various surface tension parameters so that the results for freezing nucleation (or commonly called immersion freezing) can be applied to deposition nucleation or vice versa. It would also be interesting to know whether the results obtained here can be applied to the other two modes of heterogeneous nucleation: condensation-freezing nucleation and contact nucleation. Condensation-freezing nucleation can be treated
25
as a two-step process: condensation nucleation followed by the immersion freezing nucleation. Without the presence of salt (solute), the occurrence of condensation nu-cleation requires at least some supersaturation with respect to water. Its rates can be
ACPD
8, 14419–14465, 2008Ice nucleation rate from contact angle and activation energy
J.-P. Chen et al.
Title Page
Abstract Introduction
Conclusions References
Tables Figures
◭ ◮
◭ ◮
Back Close
Full Screen / Esc
Printer-friendly Version
Interactive Discussion
calculated easily following formulations similar to those given in Sect. 2 and by know-ing the adsorption energy and contact angleθw/a, so the details will not be elaborated here. Due to the extra step of condensation nucleation, IN that have good freezing ca-pability might not be good condensation-freezing nuclei. In this regard, pollens could be good IN for condensation-freezing nucleation because they are also efficient in
con-5
densation nucleation, partly due to their large sizes and partly because the capillary effect on pollens allows rather easy water uptake even under sub-saturated environ-ment (Diehl et al., 2001). The presence of solute could also help the uptake of liquid water thus enhances the condensation nucleation but, in the mean time, depresses the probability of freezing nucleation.
10
The remaining heterogeneous ice nucleation is the contact nucleation, whose rate is difficult to measure in the laboratory. Cooper (1974) suggested that the contact nucleation could be calculated in a manner analogous to that for immersion freezing and deposition freezing. Of course, the probability of making contact also needs to be considered. Cooper’s theoretical approach seems to be a viable way of dealing
15
with this potentially important nucleation mechanism. Therefore, the thermodynamic parameters obtained in this study in effect can be used on all four ice nucleation modes.
4.4 Error sources
Even though it has been proven successful against laboratory studies, the classical theory has several apparent deficiencies. For instance, we used many bulk
thermo-20
dynamic properties to describe the behavior of microscopic ice germs. Caution must be made that the contact angle is a macroscopic concept, which might not hold for the minuscule nucleation germs. Most of the contact angles mentioned in the literature were measured on a macroscopic scale. As Evans and Lane (1973) pointed out, there is a marked difference between the macroscopic contact angle and that of the ice germ
25
ACPD
8, 14419–14465, 2008Ice nucleation rate from contact angle and activation energy
J.-P. Chen et al.
Title Page
Abstract Introduction
Conclusions References
Tables Figures
◭ ◮
◭ ◮
Back Close
Full Screen / Esc
Printer-friendly Version
Interactive Discussion
(12).
Inherent uncertainties also arise from some of the basic assumptions of the classical theory, such as the Boltzmann distribution and quasi-steady state assumption of germ concentration. The latter assumption can be corrected with the Zeldovich factor, but the factor itself was derived with mathematical approximations. Fortunately, the error
5
involved is about 1% (Pruppacher and Klett, 1997, p. 202).
Some error of estimation may also arise from the assumptions that we made. In Eq. (8) the bulk free energy of phase change∆gbin the denominator may be affected by elastic strain ε between the lattices across the interface (Turnbull and Vonnegut, 1952):
10
∆gb=kTlnSi −vw·C·ε2, (29)
whereCis about 1.7×10¹⁰J m−3. In previous discussions, we have ignored this term because very little is known about the values of ε. However, one may wonder how significantly the elastic strain affects our results. The strain is typically less than a few percents between ice and most other materials. Assume it is on the order of 1%, this
15
would decrease the bulk free energy∆gg by less than 15% when the ice saturation ratioSi is above 1.1. The same estimation can be made on Eq. (12) for the freezing nucleation mode. The error from neglecting the strain term would cause a similar error in the factorf but no obvious effect on the activation energies. However, as the contact angle andm vary slowly withf for the conditions considered here, we expect
20
the error associated with the elastic strain effect to be less than 15%. Other physical properties such as defects or dislocations that may enhance the nucleation capability also contribute to similar uncertainties.
A more complicated problem is the uncertainties inrN. In natural environment, bac-teria, pollens, soot and dust particles all have large variations in rN. The variations
25
might be smaller for the laboratory particles mentioned in Sect. 2.1, which were pre-processed before applying to the measurement of nucleation rates. However, the parti-cles will never reach a mono-dispersed size distribution as we have implicitly assumed.