Vascular Factors and Multiple Measures of
Early Brain Health: CARDIA Brain MRI Study
Lenore J. Launer1*, Cora E. Lewis2, Pamela J. Schreiner3, Steve Sidney4,
Harsha Battapady5, David R. Jacobs3, Kelvin O. Lim6, Mark D’Esposito7, Qian Zhang1, Jared Reis8, Christos Davatzikos5, R. Nick Bryan5
1Laboratory of Epidemiology and Population Sciences, National Institute on Aging, Bethesda, MD, United States of America,2University of Alabama, Birmingham, AL, United States of America,3Division of Epidemiology and Community Health, University of Minnesota, Minneapolis, MN, United States of America, 4Division of Research, Kaiser Permanente Northern California, Oakland, CA, United States of America, 5Department of Radiology, University of Pennsylvania, Philadelphia, PA, United States of America, 6Department of Radiology, University of Minnesota, Minneapolis, MN, United States of America, 7Department of Radiology, University of California, Berkeley, Berkeley, CA, United States of America, 8Division of Cardiovascular Sciences, National Heart, Lung, and Blood Institute, Bethesda, MD, United States of America
*launerl@nia.nih.gov
Abstract
Objective
To identify early changes in brain structure and function that are associated with cardiovas-cular risk factors (CVRF).
Design
Cross-sectional brain Magnetic Resonance I (MRI) study.
Setting
Community based cohort in three U.S. sites.
Participants
A Caucasian and African-American sub-sample (n= 680; mean age 50.3 yrs) attending the 25 year follow-up exam of the Coronary Artery Risk Development in Young Adults Study.
Primary and Secondary Outcomes
3T brain MR images processed for quantitative estimates of: total brain (TBV) and abnormal white matter (AWM) volume; white matter fractional anisotropy (WM-FA); and gray matter cerebral blood flow (GM-CBF). Total intracranial volume is TBV plus cerebral spinal fluid (TICV). A Global Cognitive Function (GCF) score was derived from tests of speed, memory and executive function.
OPEN ACCESS
Citation:Launer LJ, Lewis CE, Schreiner PJ, Sidney
S, Battapady H, Jacobs DR, et al. (2015) Vascular Factors and Multiple Measures of Early Brain Health: CARDIA Brain MRI Study. PLoS ONE 10(3): e0122138. doi:10.1371/journal.pone.0122138
Academic Editor:Mohammad Arfan Ikram,
University Medical Center Rotterdam, NETHERLANDS
Received:August 18, 2014
Accepted:February 8, 2015
Published:March 26, 2015
Copyright:This is an open access article, free of all
copyright, and may be freely reproduced, distributed, transmitted, modified, built upon, or otherwise used by anyone for any lawful purpose. The work is made available under theCreative Commons CC0public domain dedication.
Data Availability Statement:Data are available from
the CARDIA Coordinating Center:http://www.cardia. dopm.uab.edu/contact-cardia. A description of the NHLBI policies governing the data and describing access to the data can be found at the following website: http://www.cardia.dopm.uab.edu/study-information/nhlbi-data-repository-data.
Funding:The Coronary Artery Risk Development in
Young Adults Study (CARDIA) is supported by contracts HHSN268201300025C,
Results
Adjusting for TICV and demographic factors, current smoking was significantly associated with lower GM-CBF and TBV, and more AWM (all<0.05); SA with lower GM-CBF, WM-FA
and TBV (p=0.01); increasing BMI with decreasing GM-CBF (p<0003); hypertension with
lower GM-CBF, WM-FA, and TBV and higher AWM (all<0.05); and diabetes with lower
TBV (p=0.007). The GCS was lower as TBV decreased, AWM increased, and WM-FA (all p<0.01).
Conclusion
In middle age adults, CVRF are associated with brain health, reflected in MRI measures of structure and perfusion, and cognitive functioning. These findings suggest markers of mid-life cardiovascular and brain health should be considered as indication for early intervention and future risk of late-life cerebrovascular disease and dementia.
Introduction
Identifying early risk factors and early changes in the brain will have a major impact on future clinical and public health priorities related to the looming epidemic of dementia. To reduce the incidence of dementia, different approaches will be needed to identify risky predictive changes in disease markers of the brain (outcome), as well as in putative risk factors (independent vari-able). Recent studies suggest pathologic processes start 10 to 20 years before clinical onset of dementia [1]. To better design prevention strategies, there is a call to study pre-clinical individ-uals to identify cerebral biomarkers that detect early disease. However, also needed, are studies of risk factor patterns and the concurrent cerebral characteristics that initiate pathologic pro-cesses and may indicate pre-clinical risk for dementia [2]. This question can be addressed in well described longitudinally followed community based cohorts with a wide range of health characteristics Yet, as recently reviewed literature on the prevention of Alzheimer’s disease [3], and on the associations of CVRF to a range of MRI sequences and modalities [4], such data are lacking on middle age community dwelling individuals, and in minority populations. As re-viewed, studies relating CVRF to multiple MRI characteristics, are based on small samples, pa-tient populations with particular diseases, or community based cohorts who are older than 60 years. Further, investigations into the association of CVRF to MRI markers have focused on volumetric outcomes, such as total brain volume (TBV) and burden of white matter disease measured by lesion load, which are thought to be later manifestations of disease.
With the aim of establishing CVRF-MRI correlations at an earlier age then has previously been studied, we examine the association of MRI brain outcomes to selected CVRF in a well de-scribed middle age bi-racial cohort, whose brain has been characterized by multiple Magnetic Resonance Imaging (MRI) sequences that reflect brain structure, physiology and function. Al-though many candidate CVRF have been identified as associated with MRI brain outcomes [5], here we focus on smoking, sedentary activity, hypertension, diabetes and obesity. These factors have beena prioriselected because their associated risks for dementia have been replicated in several cohort studies with a wide range of demographic groups [5,6], and because they are im-portant components of the public’s current CVD risk profile [7]. We examine the association of these selected CVRF to TBV, and white matter disease, as well as measures of cerebral perfu-sion and brain tissue microstructural integrity These latter two characteristics have been HHSN268200900041C from the National Heart,
Lung, and Blood Institute, the Intramural Research Program of the National Institute on Aging and an Intra-agency agreement between NIA and NHLBI (AG0005). This manuscript has been reviewed by CARDIA for scientific content. There were no financial relationships with any organizations that might have an interest in the submitted work in the previous three years; there were no other relationships or activities that could appear to have influenced the submitted work. The funders had no role in study design, data collection and analysis, decision to publish, or preparation of the manuscript.
Competing Interests:The authors have declared
suggested to provide indicators of early changes in the brain that proceed to, or form the ana-tomical basis of, dementia [8,9], [10], [11,12].
Methods
Study population
Data are from a sub-sample of black and white men and women who participate in the community- based Coronary Artery Risk Development in Young Adults (CARDIA) Study (baseline 1985) and were examined (2010) at a mean age of 50 years. The CARDIA Study [13] is a longitudinal study of the development and determinants of cardiovascular disease in 5,115 young adults aged 18–30 years at baseline in 1985–1986. The community based sample was re-cruited from four US cities (Birmingham, Alabama; Chicago, Illinois; Minneapolis, Minnesota; and Oakland, California) to be approximately balanced within center by sex, age (18–24 years and 25–30 years), race (white, black), and education (high school,>high school) [13]. In 2010―2011, 72% of the surviving cohort attended the 25 year (Y25) follow-up exam. All
par-ticipants provided written informed consent at each exam, and institutional review boards from each field center and the coordinating center (The University of Alabama Birmingham Institutional Review Board, University of Minnesota Institutional Review Board, Kaiser Perma-nente Northern California Institutional Review Board), annually approve this study.
As a part of the Y25 exam, a sub-sample of the cohort participated in the CARDIA Brain MRI sub-study. This sub-study was designed to characterize the morphology, pathology, physi-ology and function of the brain with magnetic resonance imaging (MRI) technphysi-ology. The sam-ple for the CARDIA Brain MRI sub-study was enrolled at the time Y25 appointments were made, with the aim of achieving a balance within four strata of ethnicity/race (black, white) and sex from three of the CARDIA field centers: Birmingham, AL, Minneapolis, MN, and Oak-land, CA. Each center had a Brain MRI s target sample size and when reached enrollment was ended. Exclusion criteria at the time of sample selection, or at the MRI site, were a contra-indi-cation to MRI or a body size that was too large for the MRI tube bore.
Separate written consent for participation in the Brain MRI sub-study was obtained, and separate approval was given by the IRBs governing participating sites (The University of Ala-bama Birmingham Institutional Review Board, University of Minnesota Institutional Review Board, Kaiser Permanente Northern California Institutional Review Board, University of Penn-sylvania Institutional Review Board, and the NIH Office of Human Subjects Research Protec-tion for the Intramural Research Program, NaProtec-tional Institute on Aging).
MRI acquisition and processing
Parameters of interest were estimated as follows: From the sagittal 3D T1 sequence (Plane Sagittal Coil 12channel File name 3D T1 MPRAGE: Tr 1900 Te 2.89 Fov 250mm, thickness 1mm slices 176 slices, Base Res 255, Phase res 100%, Matrix 256X256 NSA 1 TI 900 ms Pixel BW 170hz. ETL = 1 Flip = 9), we estimated total intracranial volume (TICV), (a measure of head size) as the sum of gray matter (GM),white matter (WM) and cerebral spinal fluid (CSF) volumes, and total brain tissue volume (TBV) as the sum of GM and WM volumes). We esti-mated abnormal white matter tissue from the sagittal 3D FLAIR (Plane Sagittal Coil 12channel File name 3D FLAIR: Tr 6000 Te 160 Fov 250mm (fov phase = 85%), thickness 1 mm slices 160 slices, Base Res 202, Phase res 91%, Matrix 258 X 221 NSA 1 TI = 2200 ms Pixel BW 930, ETL 203)), T1 and T2 (Plane Sagittal Coil 12 channel Psd File name 3D T2: Tr 3200 Te 409 Fov 250 (fov phase = 80%), thickness 1mm slices 176, Base Res = 246, Phase res = 80%, Matrix 258x256 NSA 1 Center Freq. water ETL 141 Flip 120 Pixel BW 750)[14] sequences. Brain mi-crostructural tissue integrity and organization were estimated from axial Diffusion Tensor Im-ages (DTI); Plane Axial Coil 12-channel Psd File name ep2d diff MDDW: TR 7300 TE 84 Fov 245 Thickness 2.2mm distance factor 0% Diff Directions- 33 Concatenations = 1 number sl = 64 Flip 90 Matrix 128x128 NSA 1 Center Freq. water Phase FOV = 100 Pixel BW = 1860 diff mode = Free Phase part fourier = 7/8 Echo spacing = .59 diff weighting = 1 Accel factor = 3 EPI factor = 112 Base Res 112 Phase res 100%; 2 times). Here we report on the WM-DTI— de-rived fractional anisotropy (FA) measure, which ranges from 0 to 1 and estimates the degree (or uniformity) to which water diffuses along the direction of myelinated tracks in the white matter [10,14,15]; Zero indicates equal probability of diffusion in all directions (i.e. there is no structural restriction to the flow of molecules), and a‘1’indicates the diffusion occurs along one axis (i.e., the WM tract). Cerebral brain perfusion (CBF; volume of flow per unit brain mass per unit time (mL/100g/min)) was measured with an axial pseudo-Continuous Arterial Spin Labeling (pCASL) technique (Plane Axial Coil 12 channel Psd File name pCASL: Tr 4000 Te 11 Fov 220 mm, Concatenations 1 number sl 20, Base Res 64, Phase res = 100%, thickness 5, distance factor 20%, Center Freq. water, Matrix 64 x 64 NSA 1 Fat suppression = ON Flip = 90 Echo spacing = .47) [11,12]. Here we present the estimate for the GM as it is more reliably ob-tained than measures in WM. Per participant, completion rates for the sequences ranged from 95.9% (pCASL) to 100% (T1, PD/T2 and FLAIR sequences).
A graded alert system was established for patient safety. If the MR technician detected pa-thology that needed immediate attention, the site PI and radiologist were immediately notified and appropriate action taken. Otherwise, each site followed standard operating procedures that involved a clinical reading of the scan by a local clinical and the MR RC within 48 hours.
Image processing was performed by the Section of Biomedical Image Analysis, Department of Radiology, University of Pennsylvania (Dr. C. Davatzikos). Before starting the processing pipeline, an initial QC protocol identified any motion artifacts or any other quality issues; im-ages that failed this QC test were flagged for inspection. After this QC procedure, the scans were processed through an automated pipeline. Quality checks were performed on intermedi-ate and final processing steps by visual inspection and by identifying outliers of calculintermedi-ated vari-able or parameter distributions.
calculating FA from the raw DTI images were used to derive voxel-wise maps [20]. Average FA was computed using the anatomical regions of interest in WM-FA. The mean perfusion vol-ume from the pCASL was quantified into CBF units using the model and software described in Wang et al. [21], resulting in a CBF map. The technical error of measurement, an accuracy index that reflects measurement quality of both acquisition and processing of scans, was esti-mated from scans of 3 persons measured 3 times in the 3 centers; results were 1.2% for TBV, 27.8% for Abnormal WM, 3.4% for FA-WM and 7.3% for GM-CBF.
Risk factors
The behavioral and clinical risk factor data reported here were collected in the Y25 exam, con-currently with the MRI. Seated blood pressure (BP) levels were measured with an OmROn Hem907XL sphygmomanometer on the right arm three times by a trained technician; measures two and three were averaged and used for the blood pressure analysis. Readings were catego-rized into normotensive (SBP<130/DBP<85 mmHg and no treatment), pre-hypertensive (130–139/85 -<90 mmHg), and hypertensive (140/90 mmHg or treatment)[22]. Diabetes was defined following ADA criteria [23] for levels of fasting, non-fasting or postprandial OGTT results, HbA1c percent, or use of anti-diabetes medication; smoking (never, former, current) was assessed by questionnaire. Participants were also questioned about weekly hours engaged in sedentary activities, including listening to TV or music, doing deskwork, talking on the phone, or driving [24]. To capture more extreme comparisons we categorized weekly hours into<25 percentile (i.e.leastamount of sedentary time; (<4.3 hrs), 25–75 percentile, and75 percentile (>8.5 hrs). Body Mass Index (BMI) was calculated from measured height (to the nearest 0.5 cm) and weight (to the nearest 0.2 kg), and categorized according to WHO [25] criteria into normal (<25 km/m2), overweight (25 -<30), obese (30 -<35) and very obese (35).
Cognition
To determine whether the variation in MRI characteristics had functional consequences we in-vestigated the association between MRI values and a composite cognitive score composed of three cognitive tests, described previously [26], administered in the exam concurrent with the MRI: Digit Symbol Substitution Test (measure of psychomotor speed) scored as the number of digits correctly substituted [27], Rey Auditory Verbal Learning Test (verbal memory), scored as the total number of words recalled in the immediate and delayed recall [28], and the modi-fied Stroop test (executive function), scored as the total seconds plus errors to complete the in-terference test where the participant reads a color word that is printed in another color (higher score is worse performance) [29]. The tests were administered by trained and certified CAR-DIA technicians following the protocol of previous studies [30]. The composite score was cal-culated by transforming raw test scores into Z-scores ((individual score—group mean score)/ SD) and adding them together.
Statistical Analyses
There were 719 participants who participated in the BRAIN study: 35% (n = 252) from Oak-land, 41.3% (n = 297) from Minnesota, and 23.6% (n = 170) from Birmingham. Of these, 680 had successfully processed images and complete risk factor data, including 517 with brain per-fusion data. All brain-related variables were transformed into Z scores (as above), so results could be compared across sequences on a standardized one-SD increment.
model that includes all the variables together for each of the four MRI sequences. All models for TBV, AWM, and WM-FA were adjusted for ICV, as a measure of head size; models for CBF were adjusted for TBV, as a measure of total tissue perfused.
Results
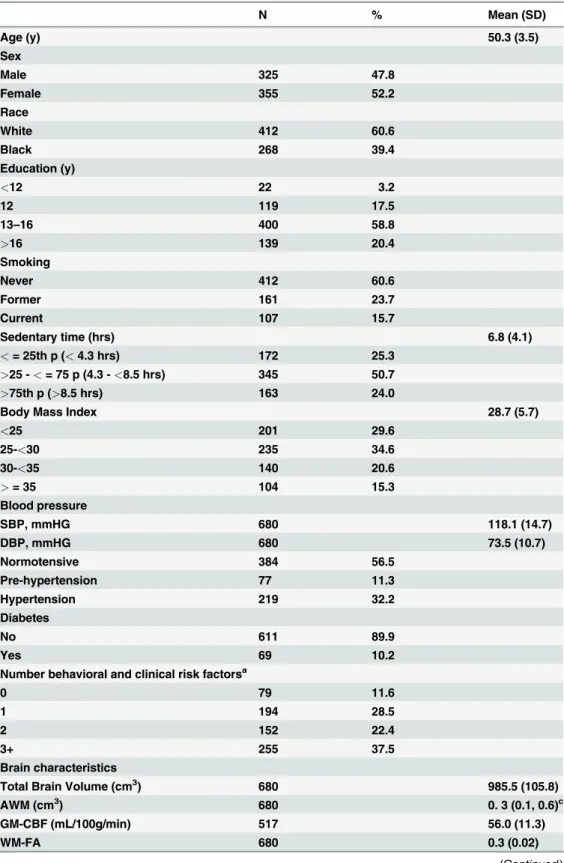
The mean age of the sample was 50.3 (SD 3.5) years, 52.2% were female and 39.4% were Black. Mean systolic and diastolic blood pressures were within the normal range, but overall, the sam-ple had a relatively‘risky’cardiovascular risk factor profile: 35.9% had a BMI of 30 or higher, 32.2% had hypertension, and 39.4% had a history of smoking (Table 1). 37% had 3 or more risk factors, most commonly hypertension, BMI over 30 and smoking After adjusting for age and sex, correlation among the sequences themselves ranged from 0.001 to 0.36 (S1 Table).
Demographic factors
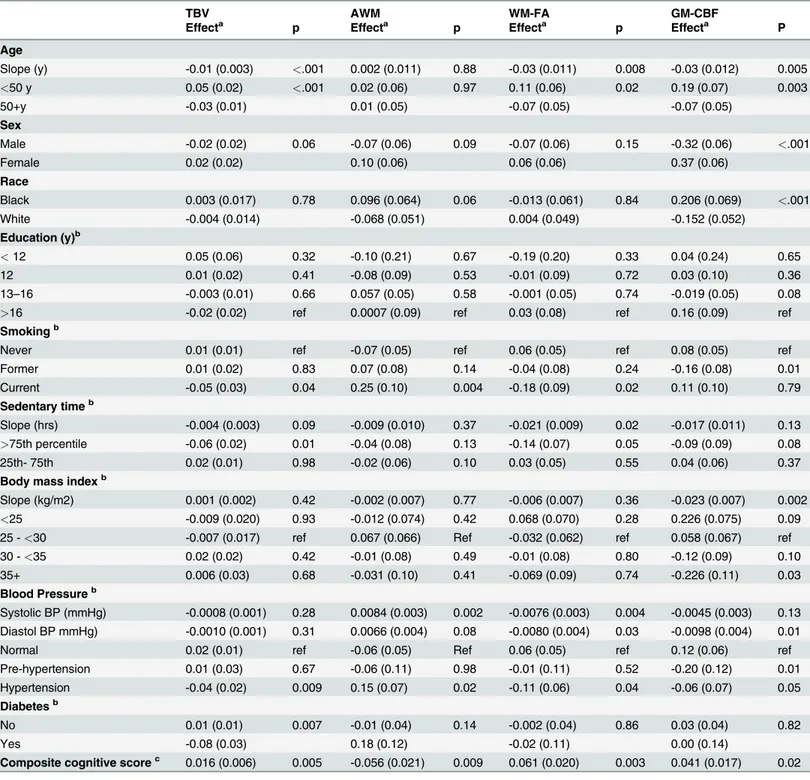
Even within the relatively narrow age (range 43 to 55 y) of the sample, there was already a de-tectable negative association between age and TBV, WM-FA, and GM-CBF (Table 2). Adjust-ing for sex, race and ICV, TBV was 1.058 cc (0.01 SD) lower for each year of age. AdjustAdjust-ing for ICV, age and race, males had significantly lower GM-CBF per mL/g/min. Compared to Whites, Blacks had more AWM, and higher GM-CBF. Education level was not associated with detect-able differences in any of the MRI brain characteristics.
Behavioral factors
In age, sex and race adjusted models, smoking behavior was strongly associated with indicators of brain pathology: Current smokers, compared to never smokers, had significantly smaller TBV, more AWM and lower WM-FA indicating less tissue integrity. Former smokers had sim-ilar brain characteristics to never smokers, except for GM-CBF, which was lower in former compared to never smokers. There was a monotonic decrease in all of the MRI outcomes, with TBV and WM-FA being significantly lower in persons in the 75thcompared to lowest 25th per-centile of time spent in sedentary activities (Table 2).
Clinical factors
Hypertension was clearly associated with indicators of diminished brain health. Expressed as continuous measures, increasing systolic blood pressure was significantly associated with in-creasing AWM and dein-creasing WM-FA; inin-creasing diastolic blood pressure was associated with significantly lower WM-FA and GM-CBF. These middle age participants with hyperten-sion had significantly smaller TBV, more AWM tissue, lower WM-FA and lower GM-CBF compared to normotensive persons. Persons with pre-hypertension levels of blood pressure had significantly lower GM-CBF. Compared to those with no diabetes, persons with diabetes had overall less healthy brains, but only their TBV was significantly smaller (Table 2). Results of the multivariate analyses that included all the risk factor information were essentially the same as the age, sex and race adjusted models (S2 Table).
Cognitive function
Table 1. Demographic, behavioral, clinical and brain characteristics in a bi-racial middle-age cohort: CARDIA BRAIN Sub-study.
N % Mean (SD)
Age (y) 50.3 (3.5)
Sex
Male 325 47.8
Female 355 52.2
Race
White 412 60.6
Black 268 39.4
Education (y)
<12 22 3.2
12 119 17.5
13–16 400 58.8
>16 139 20.4
Smoking
Never 412 60.6
Former 161 23.7
Current 107 15.7
Sedentary time (hrs) 6.8 (4.1)
<= 25th p (<4.3 hrs) 172 25.3
>25 -<= 75 p (4.3 -<8.5 hrs) 345 50.7
>75th p (>8.5 hrs) 163 24.0
Body Mass Index 28.7 (5.7)
<25 201 29.6
25-<30 235 34.6
30-<35 140 20.6
>= 35 104 15.3
Blood pressure
SBP, mmHG 680 118.1 (14.7)
DBP, mmHG 680 73.5 (10.7)
Normotensive 384 56.5
Pre-hypertension 77 11.3
Hypertension 219 32.2
Diabetes
No 611 89.9
Yes 69 10.2
Number behavioral and clinical risk factorsa
0 79 11.6
1 194 28.5
2 152 22.4
3+ 255 37.5
Brain characteristics
Total Brain Volume (cm3) 680 985.5 (105.8)
AWM (cm3) 680 0. 3 (0.1, 0.6)c
GM-CBF (mL/100g/min) 517 56.0 (11.3)
WM-FA 680 0.3 (0.02)
Discussion
In this bi-racial middle age cohort, we found variations in brain characteristics that were asso-ciated with age and key modifiable clinical and behavioral indicators of a healthy CV profile. The trends in brain characteristic—risk factor associations may be suggestive of incipient or al-ready established cerebral pathology, including smaller TBV, more AWM, lower WM-FA and lower GM-CBF. In general, the mean values of the MRI measures are, of course, higher than in older persons with clinical dementia, and possibly those with pre-clinical dementia. Never-the-less there were significant associations of CVRF to MRI measures, and MRI measures to cogni-tion [26], suggesting the MRI measures we investigated may be relevant markers for later risk of cognitive decline. Since the sub-sample of participants in the Brain MRI sub-study mirrored the total CARDIA cohort, and is similar to the US NHANES III nationally representative sam-ple in smoking history, diabetes, and mean blood pressures [31], it is reasonable to suggest the findings we report here are relevant to evaluating brain health in White and Black nationally representative samples in NHANES.
This study has several strengths. It provides the first data on a large community-based bi-racial cohort of this age (mean 50 years), of a range of MRI characteristics in relation to key risk factors for cerebrovascular and coronary disease, as well as for late-life dementia. In partic-ular there are very few studies that have described cross-sectional associations of these CVRF to FA and GM-CBF. Such studies on this age cohort are important as they will provide clues of early changes in the brain, that may eventually predict who is at risk for dementia. Indeed, its cross-sectional study design is a limitation, and an additional follow-up is planned.
Values of TBV among 80 year olds with dementia range between 70%-75% [9] of total intra-cranial volume, compared to the CARDIA mean of 81% in 50 year olds. Studies of older co-horts have found no difference [32] or a higher TBV in Black compared to White participants; for example in the multi-ethnic WHICAP cohort, the difference was 1.6%, compared to a 0.41% in CARDIA [33]. In WHICAP, compared to Whites, Blacks had a significantly higher load of white matter vascular changes, whereas in CARDIA AWM was higher, but not signifi-cantly, in Blacks than Whites. Data on perfusion differences in community-dwelling Black and White subjects are scant. We found higher perfusion rates in Blacks compared to Whites. Pos-sibly, the higher perfusion rates in Blacks compared to Whites reflects compensatory flow in the context of vascular disease, but this awaits follow-up data. Finally, the finding of no differ-ences by education in these multiple brain characteristics is of interest because lower educa-tional attainment has often been associated with poorer scores on cognitive tests and a higher risk for dementia [34]. The different conclusions regarding education from these imaging
Table 1. (Continued)
N % Mean (SD)
Composite cognitive scoreb 663 0.1 (2.3)
Abbreviations: SBP, systolic blood pressure; DBP, diastolic blood pressure; DSST, Digit Symbol Substitution Test; AWM, abnormal white matter; GM-CBF, gray matter cerebral bloodflow; WM-FA, white matter fractional anisotropy.
aIncludes Smoking, Sedentary activity (upper 75th p); BMI>30; Diabetes, and Hypertension. bComposite is the sum of Z-scores from the DSST, modified Stroop Test and Rey Auditory Verbal Learning Test.
cmedian (25%, 75%).
Table 2. Brain characteristics by demographic, behavioral and clinical measures in a bi-racial middle-age cohort: CARDIA Brain Sub-study.
TBV AWM WM-FA GM-CBF
Effecta p Effecta p Effecta p Effecta P
Age
Slope (y) -0.01 (0.003) <.001 0.002 (0.011) 0.88 -0.03 (0.011) 0.008 -0.03 (0.012) 0.005
<50 y 0.05 (0.02) <.001 0.02 (0.06) 0.97 0.11 (0.06) 0.02 0.19 (0.07) 0.003
50+y -0.03 (0.01) 0.01 (0.05) -0.07 (0.05) -0.07 (0.05)
Sex
Male -0.02 (0.02) 0.06 -0.07 (0.06) 0.09 -0.07 (0.06) 0.15 -0.32 (0.06) <.001
Female 0.02 (0.02) 0.10 (0.06) 0.06 (0.06) 0.37 (0.06)
Race
Black 0.003 (0.017) 0.78 0.096 (0.064) 0.06 -0.013 (0.061) 0.84 0.206 (0.069) <.001
White -0.004 (0.014) -0.068 (0.051) 0.004 (0.049) -0.152 (0.052)
Education (y)b
<12 0.05 (0.06) 0.32 -0.10 (0.21) 0.67 -0.19 (0.20) 0.33 0.04 (0.24) 0.65
12 0.01 (0.02) 0.41 -0.08 (0.09) 0.53 -0.01 (0.09) 0.72 0.03 (0.10) 0.36
13–16 -0.003 (0.01) 0.66 0.057 (0.05) 0.58 -0.001 (0.05) 0.74 -0.019 (0.05) 0.08
>16 -0.02 (0.02) ref 0.0007 (0.09) ref 0.03 (0.08) ref 0.16 (0.09) ref
Smokingb
Never 0.01 (0.01) ref -0.07 (0.05) ref 0.06 (0.05) ref 0.08 (0.05) ref
Former 0.01 (0.02) 0.83 0.07 (0.08) 0.14 -0.04 (0.08) 0.24 -0.16 (0.08) 0.01
Current -0.05 (0.03) 0.04 0.25 (0.10) 0.004 -0.18 (0.09) 0.02 0.11 (0.10) 0.79
Sedentary timeb
Slope (hrs) -0.004 (0.003) 0.09 -0.009 (0.010) 0.37 -0.021 (0.009) 0.02 -0.017 (0.011) 0.13
>75th percentile -0.06 (0.02) 0.01 -0.04 (0.08) 0.13 -0.14 (0.07) 0.05 -0.09 (0.09) 0.08
25th- 75th 0.02 (0.01) 0.98 -0.02 (0.06) 0.10 0.03 (0.05) 0.55 0.04 (0.06) 0.37
Body mass indexb
Slope (kg/m2) 0.001 (0.002) 0.42 -0.002 (0.007) 0.77 -0.006 (0.007) 0.36 -0.023 (0.007) 0.002
<25 -0.009 (0.020) 0.93 -0.012 (0.074) 0.42 0.068 (0.070) 0.28 0.226 (0.075) 0.09
25 -<30 -0.007 (0.017) ref 0.067 (0.066) Ref -0.032 (0.062) ref 0.058 (0.067) ref
30 -<35 0.02 (0.02) 0.42 -0.01 (0.08) 0.49 -0.01 (0.08) 0.80 -0.12 (0.09) 0.10
35+ 0.006 (0.03) 0.68 -0.031 (0.10) 0.41 -0.069 (0.09) 0.74 -0.226 (0.11) 0.03
Blood Pressureb
Systolic BP (mmHg) -0.0008 (0.001) 0.28 0.0084 (0.003) 0.002 -0.0076 (0.003) 0.004 -0.0045 (0.003) 0.13 Diastol BP mmHg) -0.0010 (0.001) 0.31 0.0066 (0.004) 0.08 -0.0080 (0.004) 0.03 -0.0098 (0.004) 0.01
Normal 0.02 (0.01) ref -0.06 (0.05) Ref 0.06 (0.05) ref 0.12 (0.06) ref
Pre-hypertension 0.01 (0.03) 0.67 -0.06 (0.11) 0.98 -0.01 (0.11) 0.52 -0.20 (0.12) 0.01
Hypertension -0.04 (0.02) 0.009 0.15 (0.07) 0.02 -0.11 (0.06) 0.04 -0.06 (0.07) 0.05
Diabetesb
No 0.01 (0.01) 0.007 -0.01 (0.04) 0.14 -0.002 (0.04) 0.86 0.03 (0.04) 0.82
Yes -0.08 (0.03) 0.18 (0.12) -0.02 (0.11) 0.00 (0.14)
Composite cognitive scorec 0.016 (0.006) 0.005 -0.056 (0.021) 0.009 0.061 (0.020) 0.003 0.041 (0.017) 0.02
Abbreviations: TBV, total brain volume; AWM, abnormal white matter; GM-CBF, gray matter cerebral bloodflow; WM-FA, white matter fractional anisotropy; BP, blood pressure; DSST, Digit Symbol Substitution Test.
aValues are adjusted Mean Z-scores of brain characteristics or the slope (β) of the change in brain Z-score by unit of the independent variable. bAll models are adjusted for age, sex, and race.
cAlso adjusted for education.
findings compared to studies of cognitive function suggest one or several variable(s) explaining the gap are‘missing‘and require further investigation.
We found current smoking is associated with multiple measures of the brain, ranging from decreased WM-FA, increased AWM, and smaller TBV. We also found former smokers had the lowest GM-CBF that was significantly different from never smokers. Former smokers are usu-ally a mixed group of those who stopped smoking to prevent future disease, or stopped smok-ing because of existsmok-ing disease. More detailed investigations into smoksmok-ing history and its effects on the brain are warranted.
We show, for the first time, that sedentary behavior [35], may pose its own risks to brain health. There is increasing evidence that sedentary behavior, separate from shorter bouts of moderate physical activity, increases the risk for cardio-metabolic disturbances and disease. Based on the emerging evidence, suggestions for CVD risk reduction have been made to inter-vene todecrease sitting, rather than to increase moderate exercise, which may be difficult for at-risk persons to adopt [19]. Such strategies may be beneficial for brain health, and should be further explored.
We found a significant association of very high BMI, indicating very obese, to lower
GM-CBF and no other MRI outcomes. BMI related metabolic or vascular factors, generated pe-ripherally or centrally, have been postulated to increase the risk for dementia [36]. Our data suggest, if there is an association, the cerebral tissue changes may appear later secondary to re-duced cerebral perfusion. It is also possible, our finding reflects the breathing and sleeping problems that accompany very high BMI [37], which is a different pathway to cognitive prob-lems than previously suggested for high BMI.
Mid-life high blood pressure has been associated with stroke, dementia, white matter le-sions, and neuropathologic lesions consistent with neurodegeneration and vascular disease [36]. We show that in this representative middle age community-cohort, age 50 years, persons with hypertension have lower TBV, WM-FA, GM-CBF and more AWM, all suggesting poorer brain health compared to normotensives. These findings strongly suggest control of blood pressure in mid-life may be important to reducing unwanted early brain changes. The point at which high blood pressure should be treated however, is still under consideration. The newest guidelines recommend initiating treatment in persons 60 years and older with a systolic blood pressure150 mmHg [38]. However, we found that, as a continuous variable, increasing blood pressure is associated with relatively poorer brain health in mid-life, reinforcing the need to evaluate guidelines for treatment specifically for cerebral outcomes.
The relationship of diabetes to metabolic and vascular changes leading to late age dementia, while replicated in several studies [39], remains controversial. We found a significantly smaller TBV in persons with, compared to those without diabetes. This is consistent with a finding of reduced gray matter with an increasing duration of diabetes in persons with long standing dia-betes, average 62 years [40]; as well as in older men and women participating in the AGES--Reykjavik Study [30]. Also similar to both studies, there was no association with WML, which was expected due to vascular changes in T2D. Possibly, diabetes leads directly to atrophic pat-terns, which are followed at a later time, by secondary WM diffuse damage.
As differences per year of age is often used as a metric to evaluating clinical significance of differences by risk factors, it is of interest to note that in this middle age cohort, differences in TBV by some risk factors are similar or greater than the 0.08 difference in TBV between the <50 yr old strata and50 yr old strata. For example, there is a 0.04 SD difference between
Our findings on risk factors are generally consistent with mid-to-late life studies investigat-ing risk factors for cognitive disorders. However the mid to late life studies are based on cohorts of participants who were identified and examined (but not imaged) in mid-life and survived to be evaluated in a late-life exam. That study design allows investigation into survivors but does not allow the study of relationships going forward from baseline, as CARDIA does, so that valid early markers of brain disease can be identified. In addition these previous studies have not acquired DTI or perfusion data.
In middle age, compared to older age where comorbidity is an issue, contrasts by CVRF may be sharper and we can better track how these factors may become risk factors for future dementia. Longitudinal follow-up of these individuals, and others who participate in long term studies, is needed to further characterize intermediary trajectories in both CVRF and
MRI outcomes.
We hypothesize that together, these measures reflect a‘pathologic’cyclic cascade whereby the perfusion decreases, followed by decreased tissue integrity, and then macroscopic changes due to neurodegeneration or vascular damage. Although this is a cross-sectional study we can-not draw conclusions on the temporal relationships among levels or change in the MRI mea-sures, there are several important clinical and public health messages that can be taken from these findings now: 1) There is suggestive evidence that cognitive differences and brain pathol-ogy are associated in this current cohort of middle-age individuals; 2) Modifiable mid-life risk factors are associated with mid-life brain health; 3) Changes in life style factors, such as stop-ping smoking and reducing time spent in sedentary activity, may directly or indirectly via hypertension and diabetes, improve brain health; 4) Relatively simple and already known methods to reduce hypertension, in particular, should be targeted. In conjunction with evi-dence from late-life studies, we propose early intervention may reduce late-life cognitive disor-ders that impair an individual’s quality of life and drive up health care costs.
Supporting Information
S1 Table. Partial Correlation Coefficients among MRI sequences. (DOCX)
S2 Table. Full model of correlates of brain characteristics in a bi-racial middle-age cohort: CARDIA BRAIN sub-study.
(DOCX)
S3 Table. Associations of individual tests of cognition and multiple measures of brain health: CARDIA BRAIN sub-study.
(DOCX)
Acknowledgments
Staff from the NHLBI (CARDIA sponsor) served on the executive and steering committees that made decisions on study design, methods, and data collection.
Author Contributions
References
1. Bateman RJ, Xiong C, Benzinger TL, Fagan AM, Goate A, Fox NC, et al. Clinical and biomarker changes in dominantly inherited Alzheimer's disease. N Engl J Med. 2012; 367(9):795–804. doi:10.
1056/NEJMoa1202753PMID:22784036
2. Sperling RA, Aisen PS, Beckett LA, Bennett DA, Craft S, Fagan AM, et al. Toward defining the preclini-cal stages of Alzheimer's disease: recommendations from the National Institute on Aging-Alzheimer's Association workgroups on diagnostic guidelines for Alzheimer's disease. Alzheimers Dement. 2011; 7(3):280–92. doi:10.1016/j.jalz.2011.03.003PMID:21514248
3. Solomon A, Mangialasche F, Richard E, Andrieu S, Bennett DA, Breteler M, et al. Advances in the pre-vention of Alzheimer's disease and dementia. J Intern Med. 2014; 275(3):229–50. doi:10.1111/joim.
12178PMID:24605807
4. Friedman JI, Tang CY, de Haas HJ, Changchien L, Goliasch G, Dabas P, et al. Brain Imaging Changes Associated With Risk Factors for Cardiovascular and Cerebrovascular Disease in Asymptomatic Pa-tients. JACC Cardiovasc Imaging. 2014; 7(10):1039–53. doi:10.1016/j.jcmg.2014.06.014PMID:
25323165
5. Gorelick PB, Scuteri A, Black SE, Decarli C, Greenberg SM, Iadecola C, et al. Vascular contributions to cognitive impairment and dementia: a statement for healthcare professionals from the american heart association/american stroke association. Stroke. 2011; 42(9):2672–713. doi:10.1161/STR.
0b013e3182299496PMID:21778438
6. Qiu C, Winblad B, Fratiglioni L. The age-dependent relation of blood pressure to cognitive function and dementia. Lancet Neurol. 2005; 4(8):487–99. PMID:16033691
7. Lloyd-Jones DM, Hong Y, Labarthe D, Mozaffarian D, Appel LJ, Van Horn L, et al. Defining and setting national goals for cardiovascular health promotion and disease reduction: the American Heart Associa-tion's strategic Impact Goal through 2020 and beyond. Circulation. 2010; 121(4):586–613. doi:10.
1161/CIRCULATIONAHA.109.192703PMID:20089546
8. Prabhakaran V, Nair VA, Austin BP, La C, Gallagher TA, Wu Y, et al. Current status and future perspectives of magnetic resonance high-field imaging: a summary. Neuroimaging Clin N Am. 2012; 22(2):373–97, xii. doi:10.1016/j.nic.2012.02.012PMID:22548938
9. Frisoni GB, Fox NC, Jack CR Jr., Scheltens P, Thompson PM. The clinical use of structural MRI in Alz-heimer disease. Nat Rev Neurol. 2010; 6(2):67–77. doi:10.1038/nrneurol.2009.215PMID:20139996
10. Dong Q, Welsh RC, Chenevert TL, Carlos RC, Maly-Sundgren P, Gomez-Hassan DM, et al. Clinical ap-plications of diffusion tensor imaging. J Magn Reson Imaging. 2004; 19(1):6–18. PMID:14696215
11. Zaharchuk G. Arterial spin label imaging of acute ischemic stroke and transient ischemic attack. Neuro-imaging Clin N Am. 2011; 21(2):285–301, x. doi:10.1016/j.nic.2011.01.003PMID:21640300
12. Brickman AM, Zahra A, Muraskin J, Steffener J, Holland CM, Habeck C, et al. Reduction in cerebral blood flow in areas appearing as white matter hyperintensities on magnetic resonance imaging. Psychi-atry Res. 2009; 172(2):117–20. doi:10.1016/j.pscychresns.2008.11.006PMID:19324534
13. Friedman GD, Cutter GR, Donahue RP, Hughes GH, Hulley SB, Jacobs DR Jr, et al. CARDIA: study design, recruitment, and some characteristics of the examined subjects. J Clin Epidemiol. 1988; 41(11):1105–16. PMID:3204420
14. Zhan W, Zhang Y, Mueller SG, Lorenzen P, Hadjidemetriou S, Schuff N, et al. Characterization of white matter degeneration in elderly subjects by magnetic resonance diffusion and FLAIR imaging correla-tion. Neuroimage. 2009; 47 Suppl 2:T58–65. doi:10.1016/j.neuroimage.2009.02.004PMID:19233296
15. Pfefferbaum A, Adalsteinsson E, Rohlfing T, Sullivan EV. Diffusion tensor imaging of deep gray matter brain structures: effects of age and iron concentration. Neurobiol Aging. 2010; 31(3):482–93. doi:10.
1016/j.neurobiolaging.2008.04.013PMID:18513834
16. Goldszal AF, Davatzikos C, Pham DL, Yan MX, Bryan RN, Resnick SM. An image-processing system for qualitative and quantitative volumetric analysis of brain images. J Comput Assist Tomogr. 1998; 22(5):827–37. PMID:9754125
17. Shen D, Davatzikos C. HAMMER: hierarchical attribute matching mechanism for elastic registration. IEEE Trans Med Imaging. 2002; 21(11):1421–39. PMID:12575879
18. Zacharaki EI, Kanterakis S, Bryan RN, Davatzikos C. Measuring brain lesion progression with a super-vised tissue classification system. Med Image Comput Comput Assist Interv. 2008; 11(Pt 1):620–7.
PMID:18979798
19. Lao Z, Shen D, Liu D, Jawad AF, Melhem ER, Launer LJ, et al. Computer-assisted segmentation of white matter lesions in 3D MR images using support vector machine. Acad Radiol. 2008; 15(3):300–13.
doi:10.1016/j.acra.2007.10.012PMID:18280928
21. Wang Z, Aguirre GK, Rao H, Wang J, Fernandez-Seara MA, Childress AR, et al. Empirical optimization of ASL data analysis using an ASL data processing toolbox: ASLtbx. Magn Reson Imaging. 2008; 26(2):261–9. PMID:17826940
22. Chobanian AV, Bakris GL, Black HR, Cushman WC, Green LA, Izzo JL Jr., et al. The Seventh Report of the Joint National Committee on Prevention, Detection, Evaluation, and Treatment of High Blood Pressure: the JNC 7 report. JAMA. 2003; 289(19):2560–72. PMID:12748199
23. American Diabetes A. Diagnosis and classification of diabetes mellitus. Diabetes Care. 2011; 34 Suppl 1:S62–9. doi:10.2337/dc11-S062PMID:21193628
24. Kohl HW 3rd, Craig CL, Lambert EV, Inoue S, Alkandari JR, Leetongin G, et al. The pandemic of physi-cal inactivity: global action for public health. Lancet. 2012; 380(9838):294–305. doi:
10.1016/S0140-6736(12)60898-8PMID:22818941
25. WHO. Obesity: preventing and managing the global epidemic. Report of a WHO Consultation. WHO Technical Report Series 894. Geneva, Switzerland: WHO; 2000. PMID:11234459
26. Reis JP, Loria CM, Launer LJ, Sidney S, Liu K, Jacobs DR Jr., et al. Cardiovascular health through young adulthood and cognitive functioning in midlife. Ann Neurol. 2013; 73(2):170–9. doi:10.1002/ana.
23836PMID:23443990
27. Wechsler D e.Wechsler adult intelligence scale—revised. New York, NY: Psychological Corporation; 1988.
28. Lezak MD HD, Loring DW.Neuropsychological Assessment, 4th Edition. New York, NY: Oxford Uni-versity Press; 2004.
29. Houx PJ, Jolles J, Vreeling FW. Stroop interference: aging effects assessed with the Stroop Color-Word Test. Exp Aging Res. 1993; 19(3):209–24. PMID:8223823
30. Launer LJ, Miller ME, Williamson JD, Lazar RM, Gerstein HC, Murray AM, et al. Effects of intensive glu-cose lowering on brain structure and function in people with type 2 diabetes (ACCORD MIND): a rando-mised open-label substudy. Lancet Neurol. 2011; 10(11):969–77. doi:
10.1016/S1474-4422(11)70188-0PMID:21958949
31. Yang Q, Cogswell ME, Flanders WD, Hong Y, Zhang Z, Loustalot F, et al. Trends in cardiovascular health metrics and associations with all-cause and CVD mortality among US adults. JAMA. 2012; 307(12):1273–83. doi:10.1001/jama.2012.339PMID:22427615
32. Aggarwal NT, Wilson RS, Bienias JL, De Jager PL, Bennett DA, Evans DA, et al. The association of magnetic resonance imaging measures with cognitive function in a biracial population sample. Arch Neurol. 2010; 67(4):475–82. doi:10.1001/archneurol.2010.42PMID:20385915
33. Brickman AM, Schupf N, Manly JJ, Luchsinger JA, Andrews H, Tang MX, et al. Brain morphology in older African Americans, Caribbean Hispanics, and whites from northern Manhattan. Arch Neurol. 2008; 65(8):1053–61. doi:10.1001/archneur.65.8.1053PMID:18695055
34. Sharp ES, Gatz M. Relationship between education and dementia: an updated systematic review. Alz-heimer Dis Assoc Disord. 2011; 25(4):289–304. doi:10.1097/WAD.0b013e318211c83cPMID:
21750453
35. Rhodes RE, Mark RS, Temmel CP. Adult sedentary behavior: a systematic review. Am J Prev Med. 2012; 42(3):e3–28. doi:10.1016/j.amepre.2011.10.020PMID:22341176
36. Shah NS, Vidal JS, Masaki K, Petrovitch H, Ross GW, Tilley C, et al. Midlife blood pressure, plasma beta-amyloid, and the risk for Alzheimer disease: the Honolulu Asia Aging Study. Hypertension. 2012; 59(4):780–6. doi:10.1161/HYPERTENSIONAHA.111.178962PMID:22392902
37. Roux F, D'Ambrosio C, Mohsenin V. Sleep-related breathing disorders and cardiovascular disease. Am J Med. 2000; 108(5):396–402. PMID:10759096
38. James PA, Oparil S, Carter BL, Cushman WC, Dennison-Himmelfarb C, Handler J, et al. 2014 evi-dence-based guideline for the management of high blood pressure in adults: report from the panel members appointed to the Eighth Joint National Committee (JNC 8). JAMA. 2014; 311(5):507–20. doi:
10.1001/jama.2013.284427PMID:24352797
39. Launer LJ. Diabetes: vascular or neurodegenerative: an epidemiologic perspective. Stroke. 2009; 40(3 Suppl):S53–5. doi:10.1161/STROKEAHA.108.533075PMID:19064803