The Spatial Distribution of Plaque
Vulnerabilities in Patients with Acute
Myocardial Infarction
Guian Zheng1,2, Yuxin Li1*, Tadateru Takayama1,3, Toshihiko Nishida3, Mitsumasa Sudo3, Hironori Haruta3, Daisuke Fukamachi3, Kimie Okubo3, Yoshiharu Higuchi3,
Takafumi Hiro1,3, Satoshi Saito1, Atsushi Hirayama1,3
1Department of Advanced Cardiovascular Imaging, Nihon University School of Medicine, Tokyo, 173-8610, Japan,2Department of Cardiology, Zhangzhou Hospital Affiliated to Fujian Medical University, Zhangzhou, 363000, Fujian, China,3Division of Cardiology, Department of Medicine, Nihon University School of Medicine, Tokyo, 173-8610, Japan
Abstract
Objective
Although the plaque characteristics have been recognized in patients with acute myocardial infarction (AMI), the plaque spatial distribution is not well clarified. Using color-mapping intravascular ultrasound (iMAP-IVUS), we examined culprit lesions to clarify plaque mor-phology, composition and spatial distribution of the sites of potential vulnerability.
Methods
Sixty-eight culprit lesions in 64 consecutive AMI patients who underwent angiography and IVUS examinations before intervention were analyzed. Plaque morphology and composi-tion were quantified with iMAP-IVUS. The spatial distribucomposi-tion of the sites of potential vulner-ability was assessed with longitudinal reconstruction of the consecutive IVUS images. The plaque characteristics were also compared between ruptured and non-ruptured lesions, and between totally occlusive (TO) and non-TO lesions.
Results
The sites with maximum necrotic area (maxNA), maximum plaque burden (maxPB) and most severely narrowed (minimal luminal area, MLA) were recognized vulnerability. In the majority of cases, maxNA sites were proximal to the maxPB sites, and MLA sites were distal to the maxNA and maxPB sites. Ruptures usually occurred close to maxNA sites and proxi-mal to maxPB and MLA sites. The average distance from the site of rupture to the maxNA site was 0.33±4.04 mm. Ruptured lesions showed significant vessel remodeling, greater plaque volume, and greater lipidic volume compared to those of non-ruptured lesions. Both the length and plaque burden (PB) of TO lesions were greater than those of non-TO lesions.
a11111
OPEN ACCESS
Citation:Zheng G, Li Y, Takayama T, Nishida T, Sudo M, Haruta H, et al. (2016) The Spatial Distribution of Plaque Vulnerabilities in Patients with Acute Myocardial Infarction. PLoS ONE 11(3): e0152825. doi:10.1371/journal.pone.0152825
Editor:Heye Zhang, Shenzhen institutes of advanced technology, CHINA
Received:November 1, 2015
Accepted:March 3, 2016
Published:March 31, 2016
Copyright:© 2016 Zheng et al. This is an open access article distributed under the terms of the Creative Commons Attribution License, which permits unrestricted use, distribution, and reproduction in any medium, provided the original author and source are credited.
Data Availability Statement:All relevant data are within the paper.
Funding:The authors have no support or funding to report.
Conclusions
Instead of overlapping on maxPB sites, most maxNA sites are proximal to the maxPB sites and are the sites most likely to rupture. Plaque morphology and composition play critical roles in plaque rupture and coronary occlusion.
Introduction
Acute myocardial infarction (AMI) is commonly caused by atherosclerotic plaque rupture or endothelial erosion with superimposed thrombosis, either of which results in abrupt coronary artery occlusion [1,2]. Although plaque ruptures have often been located in the proximal seg-ments of the coronary arteries [3–6], the reasons for rupture at these locations are not clear. Intravascular ultrasound (IVUS) studies have shown that lesions with an extensive plaque bur-den (PB) and causing compensatory positive remodeling are vulnerable and prone to rupture [7–11]. However, the characteristics of ruptured plaque have not been fully described.
There is increasing evidence that AMI patients with totally occlusive (TO) culprit arterial lesions have worse short- and long-term clinical outcomes, such as reinfarction and death from coronary disease, than those of patients with non-totally occlusive (non-TO) lesions [12–17]. However, differences in plaque features between TO lesions and non-TO lesions remain to be elucidated.
iMAP (Boston Scientific, Marlborough, MA) is a newly developed color-mapping IVUS tis-sue characterization system based on pattern recognition of the radio frequency (RF) signals and can provide quantitative analysis of plaque composition [18–20]. We conducted a retro-spective volumetric analysis of iMAP-IVUS images to investigate the spatial distribution of the sites of vulnerability and rupture. We also compared plaque morphology and composition between ruptured and non-ruptured lesions and between TO and non-TO lesions.
Methods
Ethics Statement
This retrospective study was approved by the Nihon University Itabashi Hospital Institutional Review Board (RK-150609-5) and conducted according to the principles of National Ethical Guidelines for Medical and Health Research Involving Human Subjects. All of the participants provided signed, informed consent at admission, before their data were stored in the hospital database.
Study Patients
manual pullback of the IVUS catheter was necessary, the IVUS images were of poor quality, stent restenosis occurred or vein graft lesioning or extensive coronary artery calcification was found.
Angiographic Analysis
Coronary angiography was performed via the radial or femoral approach after intracoronary administration of nitroglycerin. Stenosis was quantified as follows: (reference vessel diameter
−minimum lumen diameter) / (reference vessel diameter) ×100 (%). Lesions causing 100%
ste-nosis were classified as TO lesions, and lesions causing<100% stenosis were classified as
non-TO lesions.
Acquisition and Analysis of IVUS Images
After intracoronary administration of nitroglycerin, a mechanical rotating 40-MHz IVUS transducer (Atlantis™SR Pro, Boston Scientific) was advanced beyond the culprit lesion after guidewire passage or after dilatation with a 1.5–2.0 mm diameter balloon and then pulled back to the aorto-ostial junction with an automatic pullback device at a rate of 0.5 mm/s. The IVUS images with the RF signals were stored on DVD for offline analysis.
Quantitative analysis of the IVUS images was performed according to criteria set forth in the American College of Cardiology Clinical Expert Consensus Document on IVUS [21]. All measurements were performed independently by an experienced analyst who was blinded to patients’clinical characteristics and angiographic findings. The borders of the external elastic membrane (EEM) and lumen at the sites of target lesions were traced manually by means of IVUS analysis software (echoPlaque 3.0, INDEC Systems, Santa Clara, CA, USA). The EEM area was considered the vessel area. The plaque area was calculated as the EEM area minus the lumen area, and PB was calculated as the plaque area divided by the EEM area. A plaque0.5 mm in thickness was regarded as a lesion. Lesions separated by2 mm of normal vessel were considered discrete lesions. Lesion length was taken as the distance between the lesion’s proxi-mal and distal edges. The miniproxi-mal luminal area (MLA) was defined as the sproxi-mallest luminal area inside the lesion. A plaque rupture was defined as a cavity that was in contact with the lumen with an overlying residual fibrous cap fragment [22]. In iMAP-IVUS analysis of plaque composition, various aspects of the RF signal are processed by autoregressive modeling and matched to a database of known RF signal profiles containing the characteristics of 4 basic tis-sue types [23]. The tissue components of the plaques were classified into the 4 basic types as fibrotic (green), lipidic (yellow), necrotic (red), and calcified (blue). After tracing the EEM and lumen of all involved iMAP-IVUS images from the distal to the proximal direction, the soft-ware automatically calculated lesion length, lumen area and volume, vessel area and volume, plaque area and volume, PB, fibrotic plaque area and volume, lipidic plaque area and volume, necrotic plaque area and volume and calcified plaque area and volume. To compensate for the effect of various lesion lengths on the volumetric variables, length-adjusted volumetric vari-ables were used in the study. For example, length-adjusted lumen volume was calculated as: lumen volume divided by lesion length and then multiplied the median length of all 68 culprit lesions [24].
Statistical Analyses
were tested for normality of distribution by Kolmogorov-Smirnov test. Between-group differ-ences in normally distributed variables were analyzed by unpaired Student’s t-test and in non-normally distributed variables were analyzed by Mann-Whitney U test or Kruskal-Wallis test. Association between various IVUS variables was assessed by simple linear regression analysis. All statistical analyses were performed with JMP 10.0 software (SAS institute, Cary, NC). A p value<0.05 was considered statistically significant.
Results
Patient Characteristics
Patients’clinical characteristics are shown inTable 1. Sixty-nine percent of the patients were male, and 86% had a STEMI. Prior myocardial infarction and a prior PCI were significantly more prevalent among patients with ruptured plaques than among those with non-ruptured plaques. The prevalence of dyslipidemia differed, though not significantly, between the TO group patients and non-TO group patients (46% versus 22%,p= 0.05), but there was no differ-ence in age, sex or other coronary risk factors. STEMI was more prevalent in the TO group than in the non-TO group (95% versus 70%, respectively;p= 0.005).
Angiographic Findings
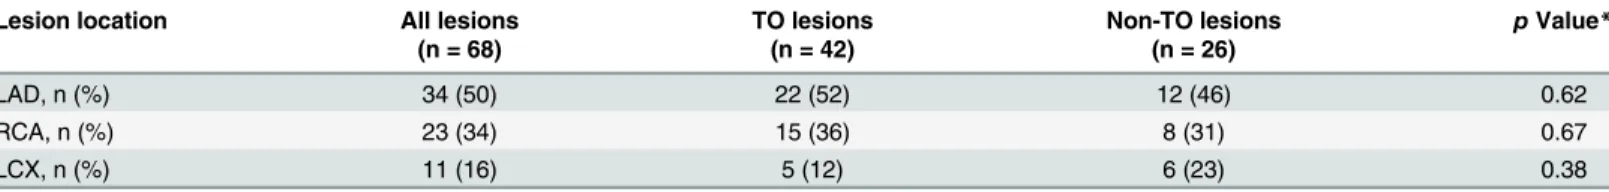
Sixty of the 64 patients had 1 culprit lesion, and the remaining 4 (6%) patients had 2 culprit lesions. Of the 68 lesions, 42 (62%) were TO lesions and 26 (38%) were non-TO lesions. Angio-graphically determined distribution of the culprit lesions is shown inTable 2. Fifty percent of the lesions were located in left anterior descending artery. There was no significant difference in lesion location between the TO group and the non-TO group.
Spatial Distribution of Areas of Vulnerability and Ruptures
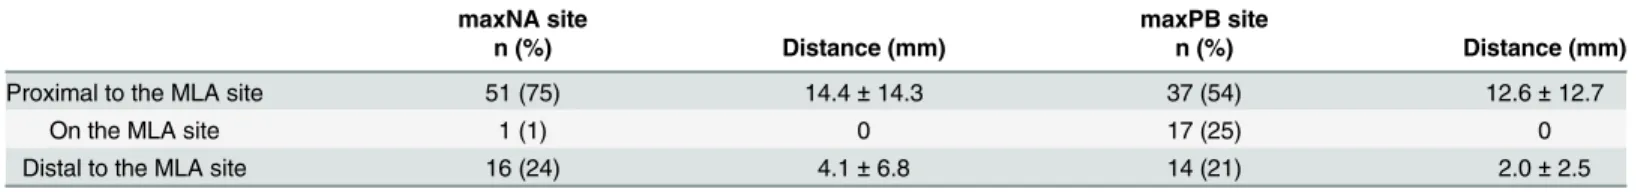
Using longitudinal reconstruction of the consecutive IVUS images, we assessed the spatial rela-tions between sites of potential vulnerability within the culprit lesions by measuring the dis-tance between the sites of maximum necrotic area (maxNA), maximum PB (maxPB), MLA and rupture. Overall, the distance from the proximal edge of the lesion to the site of maxNA was 18.4 ± 17.5 mm, to the site of maxPB was 21.8 ± 17.7 mm and to the MLA site was 28.2 ± 20.1 mm. In the majority of cases, the most stenotic sites (MLAs) were distal to the maxNA and maxPB sites (Fig 1A). Specifically, 75% of maxNA sites were proximal to the MLA sites, and 79% of maxPB sites were proximal to (54%) or overlapped (25%) the MLA sites (Table 3). For the spatial relations between maxNA sites and maxPB sites, 72% of maxNA sites were proximal to (62%) or overlapped (10%) the maxPB sites (Table 4).
In 27 (40%) ruptured plaques, the distance from the proximal edge to the site of rupture was 23.5 ± 20.4 mm, to the maxNA site was 24.7 ± 20.8 mm, to the maxPB site was
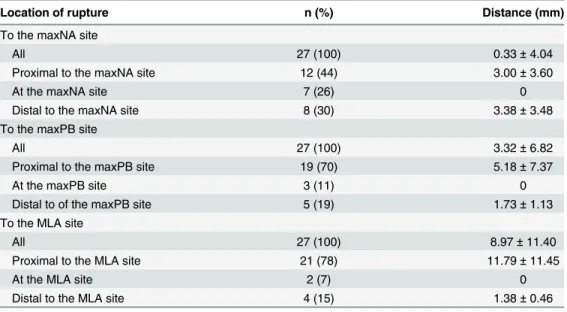
28.3 ± 22.8 mm and to the MLA site was 34.0 ± 21.7 mm. The sites of rupture were closest to the maxNA sites (Fig 1B). The average distance from the site of rupture to the maxNA site was 0.33 ± 4.04 mm (Table 5). Simple linear regression analysis revealed close correlation between the sites of rupture and the maxNA sites (R2= 0.94,p<0.0001;Fig 1C). Specifically,
44% of ruptures were proximal to, 26% overlapped and 30% were distal to a maxNA site. In comparison with the closest correlation between the sites of rupture and maxNA sites, the correlation was weaker but significant between the sites of rupture and maxPB sites (R2= 0.89,p<0.0001;Fig 1D), and between the sites of rupture and MLA sites (R2= 0.69,
were distal to a maxPB site, and 78% of ruptures were proximal to, 7% overlapped and 15% were distal to an MLA site (Table 5).
Plaque characteristics in Ruptured Lesions and in TO Lesions
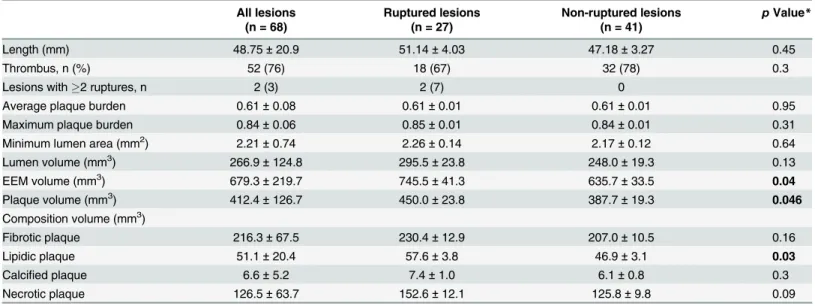
IVUS findings are shown for the ruptured and non-ruptured lesions inTable 6. Although the lumen volumes were comparable, the vessel and plaque volumes of ruptured lesions were signif-icantly greater than those of non-ruptured lesions (vessel volume: 745.5 ± 41.3 mm3versus 635.7 ± 33.5 mm3,p= 0.04; plaque volume: 450.0 ± 23.8 mm3versus 387.7 ± 19.3 mm3,
p= 0.046). With respect to plaque composition, the lipidic volume (57.6 ± 3.8 mm3versus 46.9 ± 3.1 mm3,p= 0.03) of ruptured lesions was significantly greater than that of non-ruptured lesions, and the necrotic volume of the ruptured lesions tended to be greater (152.6 ± 12.1 mm3 versus 125.8 ± 9.8 mm3,p= 0.09).
Table 1. Clinical characteristics of the total patients, patients with ruptured versus non-ruptured plaques, and patients with TO versus non-TO lesions.
All patients Rupture Non-rupture TO Non-TO
(n = 64) (n = 26) (n = 38) pValue* (n = 41) (n = 23) pValue**
Age (years) 66.1±13.5 68.4±2.6 64.5±2.2 0.26 64.3±14.9 69.2±10.2 0.17
Male sex 44 (69) 17 (65) 27 (71) 0.63 25 (61) 19 (83) 0.07
BMI (kg/m2) 24.1±3.8 23.3±0.7 24.6±0.6 0.18 24.3±4.0 23.8±3.6 0.57
Current Smoking 38 (59) 15 (58) 23 (61) 0.82 23 (56) 15 (65) 0.48
Hypertension 42 (66) 18 (69) 24 (63) 0.62 24 (59) 18 (78) 0.11
Diabetes 29 (45) 12 (46) 17 (45) 0.91 16 (39) 13 (57) 0.18
Dyslipidemia 24 (37) 10 (38) 14 (37) 0.90 19 (46) 5 (22) 0.05
Family history of CAD 9 (14) 5 (19) 4 (11) 0.33 6 (15) 3 (13) 0.86
Prior myocardial infarction 5 (8) 5 (19) 0 0.005 3 (7) 2 (9) 0.84
Prior PCIs 5 (8) 5 (19) 0 0.005 3 (7) 2 (9) 0.84
Plaque rupture 26(41) 26 0 NA 17 (42) 9 (38) 0.69
Clinical presentation
STEMI 55 (86) 23 (88) 32 (84) 39 (95) 16 (70)
Non-STEMI 9 (14) 3 (12) 6 (16) 0.63 2 (5) 7 (30) 0.005
Values are mean±SD or n (%). CAD, coronary artery disease; PCI, percutaneous coronary intervention; STEMI, ST-segment elevation myocardial
infarction. TO, totally occlusive; BMI, body mass index; *Rupture versus non-rupture.
**TO versus non-TO.
doi:10.1371/journal.pone.0152825.t001
Table 2. Angiographically determined distribution of the culprit lesions.
Lesion location All lesions TO lesions Non-TO lesions pValue*
(n = 68) (n = 42) (n = 26)
LAD, n (%) 34 (50) 22 (52) 12 (46) 0.62
RCA, n (%) 23 (34) 15 (36) 8 (31) 0.67
LCX, n (%) 11 (16) 5 (12) 6 (23) 0.38
*Total occlusion versus non-total occlusion lesions.
LAD: left anterior descending artery; RCA: right coronary artery; LCX: left circumflex.
The IVUS findings are shown for the TO lesions and non-TO lesions inTable 7. Lesion length was greater (54.16 ± 21.16 mm versus 40.01 ± 17.51 mm,p= 0.006), and the average PB and maxPB were greater (avgPB: 0.63 ± 0.07 versus 0.58 ± 0.08,p= 0.02; maxPB: 0.85 ± 0.06 versus 0.82 ± 0.06,p= 0.03) in the TO group than in the non-TO group. Thrombus was more prevalent in the TO group (83% versus 65%,p= 0.09). There was no significant between-group difference in vessel volume, lumen volume or plaque composition, and there was no significant difference in the prevalence of plaque rupture between the TO and non-TO lesions.
Fig 1. A: Representative iMAP color-mapping images of the maxNA site, the maxPB site and the MLA site, and longitudinal reconstruction of the consecutive IVUS images from the proximal edge to distal edge of culprit lesion.B: Representative iMAP color-mapping images of the site of rupture, the maxNA site, the maxPB site and the MLA site, and longitudinal reconstruction of the consecutive IVUS images from the proximal edge to distal edge of ruptured lesion. Scatter plots showing correlation between locations of plaque rupture and locations of the maximum necrotic area(C); correlation between locations of plaque rupture and locations of maximum plaque burden(D); and correlation between locations of plaque rupture and locations of minimum lumen area(E). Locations are plotted as distances from the proximal edges of ruptured lesions. maxNA: maximum necrotic area; maxPB: maximum plaque burden; MLA: minimum lumen area; MD: mean distance.
doi:10.1371/journal.pone.0152825.g001
Table 3. Overall spatial relations between the maxNA and maxPB sites and the MLA site.
maxNA site maxPB site
n (%) Distance (mm) n (%) Distance (mm)
Proximal to the MLA site 51 (75) 14.4±14.3 37 (54) 12.6±12.7
On the MLA site 1 (1) 0 17 (25) 0
Distal to the MLA site 16 (24) 4.1±6.8 14 (21) 2.0±2.5
Distances are mean±SD for the total lesions. maxNA: maximum necrotic area; maxPB: maximum plaque burden; MLA: minimum lumen area.
Discussion
Although maxNA, maxPB and MLA sites in AMI culprit lesions were shown to promote pla-que rupture or blockage of blood flow and were recognized vulnerability, whether these sites overlap and the spatial correlations between the sites are still not known. This study investi-gated the spatial distribution of these sites and found these sites did not overlap in most cases. The sites of maxNA, maxPB and MLA originated proximally to distally within the lesions. The plaque ruptures originated mainly in the vicinity of the maxNA sites and proximal to the maxPB and MLA sites. This study also investigated the differences in plaque morphology and composition between TO and non-TO culprit lesions, and between ruptured and non-ruptured lesions in AMI patients. The TO culprit lesions, in comparison to the non-TO lesions, were longer and had a greater PB, but there was no difference in plaque composition. The ruptured lesions, in comparison to the non-ruptured lesions, were related to significantly greater vessel and plaque volumes and had significantly greater lipidic volume and somewhat greater necrotic volume.
In clinical practice, before the advent of IVUS, interventional cardiologists relied on angio-graphic identification of the narrowest part of a vessel as the focus for intervention therapy [25]. However, in the present study, we often found that the sites of greatest stenosis were not
Table 4. Distance from the maxNA site to the maxPB site in all lesions.
Location of the maxNA site n (%) Distance (mm)
Proximal to the maxPB site 42 (62) 7.8±9.8
At the maxPB site 7 (10) 0
Distal to the maxPB site 19 (28) 5.00±8.8
Distances are mean±SD. maxNA, maximum necrotic area; maxPB, maximum plaque burden.
doi:10.1371/journal.pone.0152825.t004
Table 5. Spatial relations between the sites of rupture, maxNA, maxPB and MLA sites.
Location of rupture n (%) Distance (mm)
To the maxNA site
All 27 (100) 0.33±4.04
Proximal to the maxNA site 12 (44) 3.00±3.60
At the maxNA site 7 (26) 0
Distal to the maxNA site 8 (30) 3.38±3.48
To the maxPB site
All 27 (100) 3.32±6.82
Proximal to the maxPB site 19 (70) 5.18±7.37
At the maxPB site 3 (11) 0
Distal to of the maxPB site 5 (19) 1.73±1.13
To the MLA site
All 27 (100) 8.97±11.40
Proximal to the MLA site 21 (78) 11.79±11.45
At the MLA site 2 (7) 0
Distal to the MLA site 4 (15) 1.38±0.46
Distances are mean±SD for the ruptured lesions. maxNA, maximum necrotic area; maxPB, maximum
plaque burden; MLA, minimum lumen area.
the sites of greatest danger. In most cases, the site of rupture was closest to the maxNA and proximal to narrowest part of the vessel. Although the results of a few previous studies indi-cated that the maxNA was often proximal to the most severe narrowing [26–28], we investi-gated the spatial distribution of the sites of rupture and found that, instead of the sites of maxPB or greatest narrowing, the sites of maxNA were at the greatest risk of plaque rupture. Although the locations of the sites of rupture correlated significantly with the locations of
Table 6. Intravascular ultrasound characteristics of the total lesions, ruptured and non-ruptured culprit lesions.
All lesions Ruptured lesions Non-ruptured lesions pValue*
(n = 68) (n = 27) (n = 41)
Length (mm) 48.75±20.9 51.14±4.03 47.18±3.27 0.45
Thrombus, n (%) 52 (76) 18 (67) 32 (78) 0.3
Lesions with2 ruptures, n 2 (3) 2 (7) 0
Average plaque burden 0.61±0.08 0.61±0.01 0.61±0.01 0.95
Maximum plaque burden 0.84±0.06 0.85±0.01 0.84±0.01 0.31
Minimum lumen area (mm2) 2.21±0.74 2.26±0.14 2.17±0.12 0.64
Lumen volume (mm3) 266.9±124.8 295.5±23.8 248.0±19.3 0.13
EEM volume (mm3) 679.3±219.7 745.5±41.3 635.7±33.5 0.04
Plaque volume (mm3) 412.4±126.7 450.0±23.8 387.7±19.3 0.046
Composition volume (mm3)
Fibrotic plaque 216.3±67.5 230.4±12.9 207.0±10.5 0.16
Lipidic plaque 51.1±20.4 57.6±3.8 46.9±3.1 0.03
Calcified plaque 6.6±5.2 7.4±1.0 6.1±0.8 0.3
Necrotic plaque 126.5±63.7 152.6±12.1 125.8±9.8 0.09
Values are mean±SD unless otherwise indicated. Volumes were adjusted for lesion length. EEM, external elastic membrane. *Ruptured versus non-ruptured.
doi:10.1371/journal.pone.0152825.t006
Table 7. Intravascular ultrasound features of TO lesions and non-TO lesions.
TO lesions Non-TO lesions pValue
(n = 42) (n = 26)
Length (mm) 54.16±21.16 40.01±17.51 0.006
Thrombus, n (%) 35 (83) 17 (65) 0.09
Plaque rupture, n (%) 17 (40) 10 (38) 0.87
Average plaque burden 0.63±0.07 0.58±0.08 0.02
Maximum plaque burden 0.85±0.06 0.82±0.06 0.03
Minimum lumen area (mm2) 1.99±0.11 2.56±0.14 0.001
Lumen volume (mm3) 250.8±19.1 292.9±24.3 0.18
EEM volume (mm3) 669.1±34.1 695.8±43.3 0.63
Plaque volume (mm3) 418.3±19.7 403.0±25.0 0.63
Composition volume (mm3)
Fibrotic plaque 224.9±10.4 202.3±13.2 0.18
Lipidic plaque 50.2±3.2 52.6±4.0 0.65
Calcified plaque 6.1±0.8 7.4±1.0 0.31
Necrotic plaque 135.5±10.0 138.1±12.6 0.87
Values are mean±SD unless otherwise indicated. Volumes were adjusted for lesion length. TO, totally occlusive; EEM, external elastic membrane.
maxPB and greatest narrowing, most ruptures occurred proximal to the maxPB and MLA sites. Shear stress and fragility of the plaque surface may play important roles in plaque rupture. Increased shear stress has been found at the proximal part of the plaque hill [29,30], and when the shear stress meets with the fragile plaque surface, plaque rupture is initiated [31,32]. Thus, we hypothesize that the sites of maxNA, which are proximal to maxPB sites and MLA sites, may bear the highest stress and be the most fragile.
Interestingly, although the sites of rupture were closest to the maxNA sites, only 26% of rup-tures occurred at the maxNA sites. The other 74% of ruprup-tures occurred proximal (44%) or distal (30%) to the maxNA sites. These data indicate that the longitudinal“shoulder”of the maxNA might be the weakest spot. Prior studies of cross-sections have shown that the shoulder region of a plaque with a necrotic core is the most susceptible to rupture [33–35]. The current study extended this 2-dimensional concept to a 3-dimensional concept.
Plaque rupture with superimposed thrombosis plays a crucial role in the pathogenesis of AMI [36]. The frequencies of plaque rupture of culprit lesions in our AMI patients were 40%. The ruptured plaques and non-ruptured plaques had comparable lumen volumes but the vessel volumes of ruptured plaques were significantly increased. These results indicated that positive remodeling is a risk factor for plaque rupture [8,37–39]. Moreover, the plaques with greater lipidic and necrotic components were prone to rupture. Although it is widely acknowledged, on the basis of pathologic assessment at autopsy, that a large lipid pool or necrotic core covered by a thin fibrous cap is a feature of unstable plaque [40–42],in vivostudies investigating the composition of ruptured plaques are scarce. Ourin vivocolor-mapping IVUS imaging findings confirmed the pathologic findings and highlighted the significance of the various plaque com-ponents in plaque rupture. AMI patients with TO lesions, in comparison to AMI patients with non-TO lesions, have been shown to have larger infarcts and increased mortality as well as higher incidences of stent thrombosis and reinfarction [12–17]. Delayed revascularization, a lower PCI success rate and more severe clinical complications are assumed to be responsible for the poorer clinical outcomes in patients with TO lesions [12–14]. The present study pro-vided some explanations for the serious clinical outcomes in patients with TO lesions. The longer lesions and greater PB suggest the development of more extensive and severe atheroscle-rotic plaques in the TO lesions [43]. Indeed, as in previously reported patient series [44,45], our patients with TO lesions often presented with STEMI, whereas our patients with non-TO lesions often presented with non-STEMI.
Conclusions
Instead of overlapping each other, most maxNA sites are proximal to the maxPB sites and MLA sites. The plaque ruptures originated mainly in the vicinity of the maxNA sites. Plaque morphology and composition play critical roles in plaque rupture and coronary occlusion.
Acknowledgments
We thank Emi Tashiro, Tomoko Kobayashi, and Natsuko Yamamoto for their excellent secre-tarial assistance and technical assistance.
Author Contributions
Conceived and designed the experiments: YL TT SS AH. Performed the experiments: GZ. Ana-lyzed the data: GZ YL TH. Contributed reagents/materials/analysis tools: TT TN MS HH DF KO YH TH. Wrote the paper: GZ YL.
References
1. Virmani R, Burke AP, Farb A, Kolodgie FD. Pathology of the vulnerable plaque. J Am Coll Cardiol. 2006; 47:C13–C18. PMID:16631505
2. Davies MJ. The pathophysiology of acute coronary syndromes. Heart. 2000; 83:361–366. PMID: 10677422
3. Toutouzas K, Karanasos A, Riga M, Tsiamis E, Synetos A, Michelongona A, et al. Optical coherence tomography assessment of the spatial distribution of culprit ruptured plaques and thin-cap fibroathero-mas in acute coronary syndrome. Eurointervention. 2012; 8:477–485. doi:10.4244/EIJV8I4A75PMID: 22917732
4. Kim SW, Hong YJ, Mintz GS, Lee SY, Doh JH, Lim SH, et al. Relation of ruptured plaque culprit lesion phenotype and outcomes in patients with ST elevation acute myocardial infarction. Am J Cardiol. 2012; 109:794–799. doi:10.1016/j.amjcard.2011.10.042PMID:22196783
5. Wykrzykowska JJ, Mintz GS, Garcia-Garcia HM, Maehara A, Fahy M, Xu K, et al. Longitudinal distribu-tion of plaque burden and necrotic core-rich plaques in nonculprit lesions of patients presenting with acute coronary syndromes. JACC Cardiovasc Imaging. 2012; 5:S10–S18. doi:10.1016/j.jcmg.2012. 01.006PMID:22421223
6. Finn AV, Nakano M, Narula J, Kolodgie FD, Virmani R. Concept of vulnerable/unstable plaque. Arter-ioscler Thromb Vasc Biol. 2010; 30:1282–1292. doi:10.1161/ATVBAHA.108.179739PMID:20554950 7. Kusama I, Hibi K, Kosuge M, Sumita S, Tsukahara K, Okuda J, et al. Intravascular ultrasound
assess-ment of the association between spatial orientation of ruptured coronary plaques and remodeling mor-phology of culprit plaques in ST-elevation acute myocardial infarction. Heart Vessels. 2012; 27:541–
547. doi:10.1007/s00380-011-0184-7PMID:21892739
8. Ouldzein H, Elbaz M, Roncalli J, Cagnac R, Carrié D, Puel J, et al. Plaque rupture and morphological characteristics of the culprit lesion in acute coronary syndromes without significant angiographic lesion: Analysis by intravascular ultrasound. Ann Cardiol Angeiol. 2012; 61:20–26.
9. Tanaka A, Shimada K, Yoshida K, Jissyo S, Tanaka H, Sakamoto M, et al. Non-invasive assessment of plaque rupture by 64-slice multidetector computed tomography: comparison with intravascular ultra-sound. Cir J. 2008; 72:1276–1281.
10. Tian JW, Ren XF, Vergallo R, Xing L, Yu H, Jia H, et al. Distinct morphological features of ruptured cul-prit plaque for acute coronary events compared to those with silent rupture and thin-cap fibroatheroma a combined optical coherence tomography and intravascular ultrasound study. J Am Coll Cardiol. 2014; 63:2209–2216. PMID:24632266
11. von Birgelen C, Klinkhart W, Mintz GS, Papatheodorou A, Herrmann J, Baumgart D, et al. Plaque distri-bution and vascular remodeling of ruptured and nonruptured coronary plaques in the same vessel: an intravascular ultrasound study in vivo. J Am Coll Cardiol. 2001; 37:1864–1870. PMID:11401124 12. Wang TY, Zhang M, Fu YL, Armstrong PW, Newby LK, Gibson CM, et al. Incidence, distribution, and
prognostic impact of occluded culprit arteries among patients with non-ST-elevation acute coronary syndromes undergoing diagnostic angiography. Am Heart J. 2009; 157:716–723. doi:10.1016/j.ahj. 2009.01.004PMID:19332201
myocardial infarction and early invasive treatment strategy. Clin Res Cardiol. 2011; 100:457–467. doi: 10.1007/s00392-010-0269-9PMID:21165625
14. Kim MC, Ahn Y, Rhew SH, Jeong MH, Kim JH, Hong YJ, et al.; KAMIR Investigators. Impact of total occlusion of an infarct-related artery on long-term mortality in acute non-ST-elevation myocardial infarc-tion patients who underwent early percutaneous coronary interveninfarc-tion. Int Heart J. 2012; 53:160–164. PMID:22790683
15. Piccolo R, Galasso G, Iversen AZ, Eitel I, Dominguez-Rodriguez A, Gu YL, et al. Effects of baseline cor-onary occlusion and diabetes mellitus in patients with ST-segment elevation myocardial infarction undergoing primary percutaneous coronary intervention. Am J Cardiol. 2014; 114:1145–1150. doi:10. 1016/j.amjcard.2014.07.030PMID:25193670
16. Shin DI, Chang K, Ahn Y, Hwang BH, Park HJ, Seo SM, et al. Impact of occluded culprit arteries on long-term clinical outcome in patients with non-ST-elevation myocardial infarction: 48-month follow-up results in the COREA-AMI Registry. J Interv Cardiol. 2014; 27:12–20. doi:10.1111/joic.12078PMID: 24147831
17. Pride YB, Tung P, Mohanavelu S, Zorkun C, Wiviott SD, Antman EM, et al.; TIMI Study Group. Angio-graphic and clinical outcomes among patients with acute coronary syndromes presenting with isolated anterior ST-segment depression a TRITON TIMI 38 (trial to assess improvement in therapeutic out-comes by optimizing platelet inhibition with prasugrel thrombolysis in myocardial infarction 38) sub-study. JACC Cardiovasc Interv. 2010; 3:806–811. PMID:20723851
18. Shin ES, Garcia-Garcia HM, Ligthart JM, Witberg K, Schultz C, van der Steen AF, et al. In vivo findings of tissue characteristics using iMAP (TM) IVUS and Virtual Histology (TM) IVUS. Eurointervention. 2011; 6:1017–1019. doi:10.4244/EIJV6I8A175PMID:21330252
19. Heo JH, Brugaletta S, Garcia-Garcia HM, Gomez-Lara J, Ligthart JM, Witberg K, et al. Reproducibility of intravascular ultrasound iMAP for radiofrequency data analysis: implications for design of longitudi-nal studies. Catheter Cardiovasc Interv. 2014; 83:E233–E242. doi:10.1002/ccd.23335PMID: 22109902
20. Yamada R, Okura H, Kume T, Neishi Y, Kawamoto T, Miyamoto Y, et al. A comparison between 40 MHz intravascular ultrasound iMap imaging system and integrated backscatter intravascular ultra-sound. J Cardiol. 2013; 61:149–154. doi:10.1016/j.jjcc.2012.10.008PMID:23265675
21. Mintz GS, Nissen SE, Anderson WD, Bailey SR, Erbel R, Fitzgerald PJ, et al. American College of Car-diology clinical expert consensus document on standards for acquisition, measurement and reporting of intravascular ultrasound studies (IVUS). A report of the American College of Cardiology Task Force on Clinical Expert Consensus Documents. J Am Coll Cardiol. 2001; 37:1478–1492. PMID:11300468 22. Xie Y, Mintz GS, Yang JQ, Doi H, Iñiguez A, Dangas GD, et al. Clinical outcome of nonculprit plaque
ruptures in patients with acute coronary syndrome in the PROSPECT study. JACC Cardiovasc Imag-ing. 2014; 7:397–405. doi:10.1016/j.jcmg.2013.10.010PMID:24631511
23. Garcia-Garcia HM, Gogas BD, Serruys PW, Bruining N. IVUS-based imaging modalities for tissue char-acterization: similarities and differences. Int J Cardiovasc Imaging. 2011; 27:215–224. doi:10.1007/ s10554-010-9789-7PMID:21327914
24. Nissen SE, Tuzcu EM, Schoenhagen P, Crowe T, Sasiela WJ, Tsai J, et al.; Reversal of Atherosclero-sis with Aggressive Lipid Lowering (REVERSAL) Investigators. Statin therapy, LDL cholesterol, C-reac-tive protein, and coronary artery disease. N Engl J Med. 2005; 352:29–38. PMID:15635110
25. Kushner FG, Hand M, Smith SC Jr, King SB 3rd, Anderson JL, Antman EM, et al. 2009 focused updates: ACC/AHA guidelines for the management of patients with ST-elevation myocardial infarction (updating the 2004 guideline and 2007 focused update) and ACC/AHA/SCAI guidelines on percutane-ous coronary intervention (updating the 2005 guideline and 2007 focused update) a report of the Ameri-can College of Cardiology Foundation/AmeriAmeri-can Heart Association Task Force on Practice Guidelines. J Am Coll Cardiol. 2009; 54:2205–2241. PMID:19942100
26. de Graaf MA, van Velzen JE, de Graaf FR, Schuijf JD, Dijkstra J, Bax JJ, et al. The maximum necrotic core area is most often located proximally to the site of most severe narrowing: a virtual histology intra-vascular ultrasound study. Heart Vessels. 2013; 28:166–172. doi:10.1007/s00380-012-0236-7PMID: 22349692
27. Kaple RK, Maehara A, Sano K, Missel E, Castellanos C, Tsujita K, et al. The axial distribution of lesion-site atherosclerotic plaque components: an in vivo volumetric intravascular ultrasound radio-frequency analysis of lumen stenosis, necrotic core and vessel remodeling. Ultrasound Med Biol. 2009; 35:550–
557. doi:10.1016/j.ultrasmedbio.2008.09.024PMID:19110364
28. Legutko J, Jakala J, Mintz GS, Kaluza GL, Mrevlje B, Partyka L, et al. Radiofrequency-intravascular ultrasound assessment of lesion coverage after angiography-guided emergent percutaneous coronary intervention in patients with non-ST elevation myocardial infarction. Am J Cardiol. 2013; 112:1854–
29. Li ZY, Gillard JH. Plaque rupture: plaque stress, shear stress, and pressure drop. J Am Coll Cardiol. 2008; 52:499–500. doi:10.1016/j.jacc.2008.04.040PMID:18672176
30. Li ZY, Howarth SPS, Tang T, Gillard JH. How critical is fibrous cap thickness to carotid plaque stability? A flow-plaque interaction model. Stroke. 2006; 37:1195–1199. PMID:16574926
31. Speelman L, Akyildiz AC, den Adel B, Wentzel JJ, van der Steen AF, Virmani R, et al. Initial stress in biomechanical models of atherosclerotic plaques. J Biomech. 2011; 44:2376–2382. doi:10.1016/j. jbiomech.2011.07.004PMID:21782179
32. Tang DL, Teng ZZ, Canton G, Yang C, Ferguson M, Huang X, et al. Sites of rupture in human athero-sclerotic carotid plaques are associated with high structural stresses an in vivo MRI-based 3D fluid-structure interaction study. Stroke. 2009; 40:3258–3263. doi:10.1161/STROKEAHA.109.558676 PMID:19628799
33. Fishbein MC. The vulnerable and unstable atherosclerotic plaque. Cardiovasc Pathol. 2010; 19:6–11. doi:10.1016/j.carpath.2008.08.004PMID:18835793
34. Toutouzas K, Karanasos A, Tsiamis E, Riga M, Drakopoulou M, Synetos A, et al. New insights by opti-cal coherence tomography into the differences and similarities of culprit ruptured plaque morphology in non-ST-elevation myocardial infarction and ST-elevation myocardial infarction. Am Heart J. 2011; 161:1192–1199. doi:10.1016/j.ahj.2011.03.005PMID:21641368
35. Plutzky J. Atherosclerotic plaque rupture: Emerging insights and opportunities. Am J Cardiol. 1999; 84:15J–20J. PMID:10418853
36. Falk E, Nakano M, Bentzon JF, Finn AV, Virmani R. Update on acute coronary syndromes: the patholo-gists’view. Eur Heart J. 2013; 34:719–728. doi:10.1093/eurheartj/ehs411PMID:23242196
37. Kubo T, Imanishi T, Takarada S, Kuroi A, Ueno S, Yamano T, et al. Assessment of culprit lesion mor-phology in acute myocardial infarction: ability of optical coherence tomography compared with intravas-cular ultrasound and coronary angioscopy. J Am Coll Cardiol. 2007; 50:933–939. PMID:17765119 38. Topaz O, Bernardo NL, Shah R, McQueen RH, Desai P, Janin Y, et al. Effectiveness of excimer laser
coronary angioplasty in acute myocardial infarction or in unstable angina pectoris. Am J Cardiol. 2001; 87:849–855. PMID:11274939
39. Takumi T, Lee S, Hamasaki S, Toyonaga K, Kanda D, Kusumoto K, et al. Limitation of angiography to identify the culprit plaque in acute myocardial infarction with coronary total occlusion utility of coronary plaque temperature measurement to identify the culprit plaque. J Am Coll Cardiol. 2007; 50:2197–
2203. PMID:18061065
40. Uemura S, Ishigami K, Soeda T, Okayama S, Sung JH, Nakagawa H, et al. Thin-cap fibroatheroma and microchannel findings in optical coherence tomography correlate with subsequent progression of coronary atheromatous plaques. Eur Heart J. 2012; 33:78–85. doi:10.1093/eurheartj/ehr284PMID: 21831910
41. Virmani R, Kolodgie FD, Burke AP, Finn AV, Gold HK, Tulenko TN, et al. Atherosclerotic plaque pro-gression and vulnerability to rupture: angiogenesis as a source of intraplaque hemorrhage. Arterioscler Thromb Vasc Biol. 2005; 25:2054–2061. PMID:16037567
42. Bentzon JF, Otsuka F, Virmani R, Falk E. Mechanisms of plaque formation and rupture. Circ Res. 2014; 114:1852–1866. doi:10.1161/CIRCRESAHA.114.302721PMID:24902970
43. Nicholls SJ, Hsu A, Wolski K, Hu B, Bayturan O, Lavoie A, et al. Intravascular ultrasound-derived mea-sures of coronary atherosclerotic plaque burden and clinical outcome. J Am Coll Cardiol. 2010; 55:2399–2407. doi:10.1016/j.jacc.2010.02.026PMID:20488313
44. Chan MY, Sun JL, Newby LK, Shaw LK, Lin M, Peterson ED, et al. Long-term mortality of patients undergoing cardiac catheterization for ST-elevation and non-ST-elevation myocardial infarction. Circu-lation. 2009; 119:3110–3117. doi:10.1161/CIRCULATIONAHA.108.799981PMID:19506116 45. van Leeuwen MAH, Daemen J, van Mieghem NM, de Boer SP, Boersma E, van Geuns RJ, et al.;
Inter-ventional Cardiologists of the Thoraxcenter 2000–2009. Comparison of long-term outcomes in STEMI and NSTE-ACS after coronary stent placement: an analysis in a real world BMS and DES population. Int J Cardiol. 2013; 167:2082–2087. doi:10.1016/j.ijcard.2012.05.064PMID:22664371
46. Arbustini E, Dal Bello B, Morbini P, Burke AP, Bocciarelli M, Specchia G, et al. Plaque erosion is a major substrate for coronary thrombosis in acute myocardial infarction. Heart. 1999; 82:269–272. PMID:10455073
47. Nissen SE, Yock P. Intravascular ultrasound: novel pathophysiological insights and current clinical applications. Circulation. 2001; 103:604–616. PMID:11157729