Development and Validation of Analytical
Method for Simultaneous Estimation of
Cefuroxime Axetil and Linezolid in Tablet
Dosage form
Rimakumari N. Chavda*, Hitendra N. Yadav, Madhuri A. Hinge, Rashmi D. Shing, Ekta S. Patel, Dhawal R. Patel
Department of Quality assurance, Rofel, Shri G. M. Bilakhia College of Pharmacy, Vapi. Rofel Namdha Campus, Vapi-Namdha Road, Vapi-396191, Gujarat.
E-mail Id: [email protected] Phone No: 9712706032
Abstract:
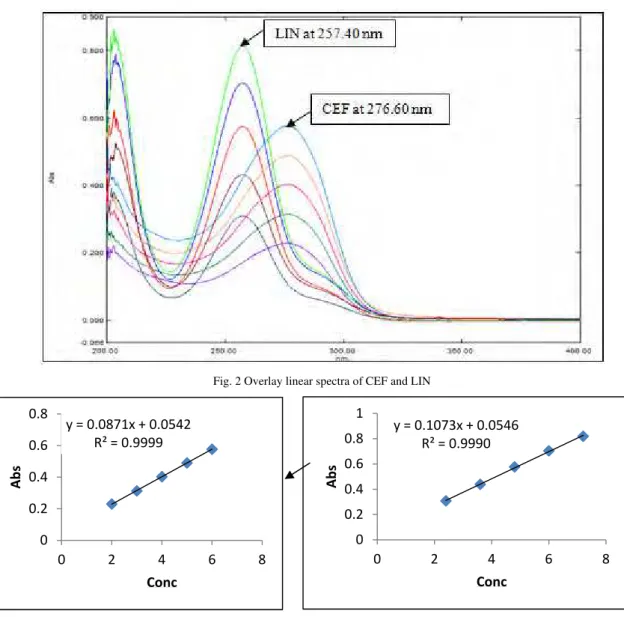
A simple, precise, accurate, sensitive and rapid Simultaneous Equation method was developed for simultaneous estimation of Cefuroxime Axetil(CEF) and Linezolid(LIN) in Tablet dosage form. The proposed method was applied for the determination of Cefuroxime Axetil and Linezolid in Tablet formulation, for determination of sampling using two wavelengths, CEF and LIN were scanned in 200-400 nm range and sampling wavelengths were 276.60 nm for CEF and 257.40 nm for LIN are selected for development and validation of simultaneous equation method. For this method linearity observed in the range of 2-6 μg/ml for CEF and 2.4-7.2 μ g/ml for LIN and in their pharmaceutical formulation with mean percentage recoveries 99.90± 0.005 and 100.02± 0.009, respectively. The method was validated according to ICH guidelines and can be applied for routine quality control testing.
Keywords: Spectroscopic method, simultaneous equation method, Cefuroxime Axetil and Linezoli
1. Introduction
The aim of the present work was to develop a new simple, precise, accurate and rapid method for the simultaneous determination of components having overlapping spectra in tablet formation. To prove the ability of the newly described method in resolving the overlapping spectral data and simultaneous determination of each component, it was applied for the analysis of a mixture of Cefuroxime Axetil (CEF) and Linezolid (LIN) formulated together in the form of tablet widely used for the treatment of bacterial infection. [1-5]
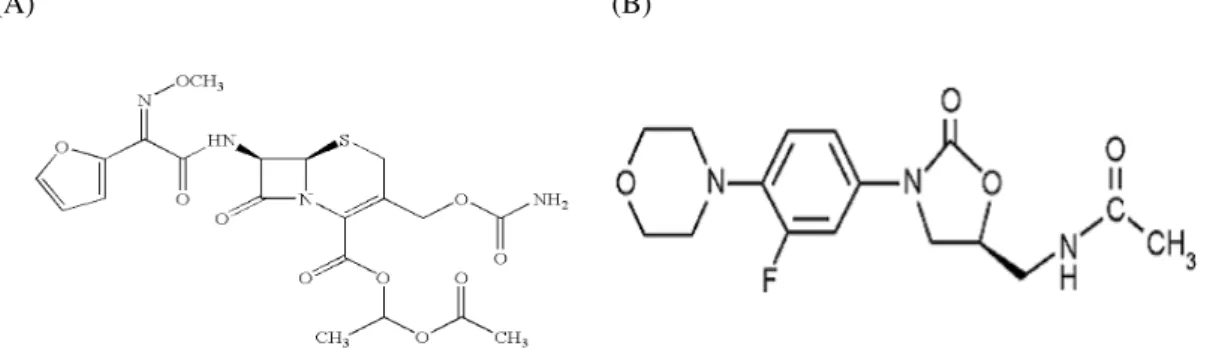
Cefuroxime Axetil is chemically (1 RS)-1-(acetyloxy)ethyl(6R,7R)-3-[(carbamoyloxy)methyl]-7[[(Z)-2-(furan-2-yl)-2-(methoxyimino)acethyl]amino]-8-oxo-5-thia-1-azabicyclo[4.2.0]oct-2-ene-2-carboxylate. Cefuroxime Axetil is a bactericidal in action. Like other cephalosporins, the antibacterial activity of the drug results from inhibition of mucopeptide synthesis in the bacterial cell wall. That is used for treating bacterial infection. Linezolid is chemically N-[(5S)-3-[3-fluoro-4-(4-morpholinyl)phenyl]-2-oxo-5-oxazolidinyl]methyl]acetamide. Linezolid is a member of a new structural class of antibiotics, oxazolidinones. The oxazolidinones have a good activity against Gram-positive bacteria. They act uniquely by inhibiting the formulation of protein synthesis initiation in Gram-positive bacteria. Combination of Cefuroxime Axetil and Linezolid is used to treat bacterial infection. [6-16]
(A) (B)
1.1. Theory
We can find out concentration of both the drug from combination mixture using the simultaneous equation method. In this method using the absorbance of both the drug and mixture at their wavelength and put this value in following equation and we can find out the concentration of drugs present in combination.
Cx = (A2 × ay1) – (A1 × ay2)
--- --- (1)
(ay1 × ax2) – (ay2 × ax1)
Cy = (A1 × ax2) – (A2 × ax1)
--- --- (2) (ay1× ax2) – (ay2× ax1)
Where,
Cx = Concentration of drug X A1 = Absorbance of mixture at wavelength 1 Cy = Concentration of drug Y A2 = Absorbance of mixture at wavelength 2
ax1 = Absorptivity of drug A at wavelength 1 ay1 = Absorptivity of drug B at wavelength 1
ax2 = Absorptivity of drug A at wavelength 2 ay2 = Absorptivity of drug B at wavelength 2
2. Material and method 2.1. Apparatus
A double beam UV-Visible spectrophotometer (Shimadzu model-1800, Software-UV Probe, Version 2.42) having two matched quartz cells with 1 cm light path.
2.2. Reference samples
CEF and LIN reference standard are kindly supply by Wockhardt, Mumbai and Aristo pharmaceuticals Pvt. Ltd, Mumbai as a gift sample respectively.
2.3. Pharmaceutical formulation
Linox*-XT tablet, labelled to contain 500 mg CEF and 600 mg LIN, manufactured by Unichem laboratories Ltd.
2.4.Materials and reagents Methanol AR grade (RANKEM) 2.5.Standard solutions
2.5.1. Standard solution of Cefuroxime Axetil (CEF)
Accurately weighed quantity of CEF 100 mg was transferred to 100ml volumetric flask, dissolved and diluted up to mark with Methanol to give a standard stock solution having strength 1000µg/ml. Then pipette out 10ml from the standard stock solution in other 100ml volumetric flask and diluted up to mark with Methanol to give a working standard solution having strength 100µg/ml. Pipette out 25ml from the working standard solution in other 50ml volumetric flask and diluted up to mark with Methanol to give a working standard solution having strength 50µg/ml.
2.5.2. Standard solution of Linezolid (LIN)
Accurately weighed quantity of LIN 100 mg was transferred into 100 ml volumetric flask, dissolved and diluted up to mark with Methanol to give a stock solution having strength 1000µg/ml. Then pipette out 10ml from the standard stock solution in other 100ml volumetric flask and diluted up to mark with Methanol to give a stock solution having strength 100µg/ml. Pipette out 25ml from the working standard solution in other 50ml volumetric flask and diluted up to mark with Methanol to give a working standard solution having strength 50µg/ml.
2.5.3. Preparation of standard mixture
Pipette out accurately 0.4 ml of CEF stock solution (100µg/ml), 0.48 ml of LIN stock solution (100µg/ml) in 10 ml volumetric flask and make up the volume up to the mark with Methanol. It gives solution containing CEF 4µg/ml, LIN 4.8µg/ml.
2.5.4. Test Sample Preparation
2.6. Procedures
2.6.1.Calibration curve for Cefuroxime Axetil
This series consisted of five concentrations of standard CEF solution ranging from 2-6μg/ml. The solutions were prepared by pipette out standard CEF working solution (0.4ml, 0.6ml, 0.8ml, 1ml, 1.2ml) was transferred into a series of 10 ml volumetric flasks and volume was adjusted up to mark with Methanol. A zero order spectra of the resulting solutions were recorded, measured the absorbance at 276.60nm against a reagent blank solution (Methanol). Calibration curve was prepared by plotting absorbance versus respective concentration of CEF.
2.6.2.Calibration curve for Linezolid
This series consisted of five concentrations of standard LIN solution ranging from 2.4-7.2μg/ml. The solutions were prepared by pipette out Standard LIN working solution (0.48ml, 0.72ml, 0.96ml, 1.20ml, and 1.44ml) was transferred into a series of 10 ml volumetric flasks and volume was adjusted up to mark with Methanol. A zero order spectra of the resulting solutions were recorded and measured the absorbance at 257.40 nm against a reagent blank solution (Methanol). Calibration curve was prepared by plotting absorbance versus respective concentration of LIN.
Fig. 2 Overlay linear spectra of CEF and LIN
Fig. 3 calibration curve of CEF at 276.60nm Fig. 4 calibration curve of LIN at 257.40nm y = 0.1073x + 0.0546
R² = 0.9990
0 0.2 0.4 0.6 0.8 1
0 2 4 6 8
Abs
Conc
y = 0.0871x + 0.0542 R² = 0.9999
0 0.2 0.4 0.6 0.8
0 2 4 6 8
Abs
Fig. 5 calibration curve of CEF at 257.40nm Fig. 6 calibration curve of LIN at 276.60nm
3. Experimental Work
3.1. Linearity and range
The linearity of method is its ability within a given range to obtain test results which are directly or through a mathematical transformation, proportional to the concentration of analyte. Linearity of the method was determined at five concentration levels for CEF and LIN independently.
3.2. Accuracy
The accuracy of an analytical method is the closeness of the test results to the true value. It was tested by spiking standard CEF solution in different concentration 80, 100 and 120% to a tablet solution. The tablet solution was analyzed at 276.60 nm for estimation of CEF. Similarly, the accuracy for LIN was determined at 257.40 nm, respectively.
3.3. Precision
The intra-day precision (repeatability) of method was determined by measuring the absorbance of tablet solution-I at 276.60 and 257.40 nm for CEF and LIN, respectively. The inter-day precision (intermediate precision) was determined by measuring the absorbance of tablet solution-I at 276.60 and 257.40 nm for CEF and LIN, respectively. The %RSD was calculated for intra and inter-day precision.
3.4. LOD and LOQ
The LOD of an analytical method is the lowest amount of analyte in a sample which can be detected but not necessarily quantified. The detection limit (DL) of method was determined by equation, DL = (3.3 σ)/S, where, σ– standard deviation of blank response, S– slope of the calibration curve. The quantitation limit (QL) of analyte was determined by equation DL = (10 σ)/S, where, σ– standard deviation of blank response, S– slope of the calibration curve.
4. Results and discussion
A) Linearity and Range:
The linearity range for CEF at 276.60 nm&257.40 nm and LIN at 257.40 nm&276.60 nm was found to be in the range of 2-6 μg/ml and 2.4-7.2 μg/ml respectively.
Tab.1 Linearity data for CEF at 276.60 nm Tab.2 Linearity data for LIN at 257.40 nm y = 0.0620x + 0.0476
R² = 0.9991
0 0.1 0.2 0.3 0.4 0.5
0 2 4 6 8
Abs
Conc
y = 0.0365x + 0.0242 R² = 0.9984
0 0.05 0.1 0.15 0.2 0.25 0.3 0.35
0 2 4 6 8
Abs
Conc
Sr. No
Conc. (µg/ml)
Absorbance at 276.60 nm Mean ± S.D. (n=5)
%R.S.D.
1 2 0.2300±0.000632 0.274
2 3 0.3131±0.001169 0.373
3 4 0.4031±0.000753 0.186
4 5 0.4901±0.001169 0.238
5 6 0.5770±0.000632 0.109
Sr. No
Conc. (µg/ml)
Absorbance at 257.40 nm Mean ± S.D. (n=5)
%R.S.D.
1 2.4 0.3081±0.000753 0.244
2 3.6 0.4390±0.000632 0.143
3 4.8 0.5770±0.001095 0.189
4 6 0.7043±0.001033 0.146
Tab.3 Linearity data for CEF at 257.40 nm b.4 Linearity data for LIN at 276.60 nm
B) Precision: I. Repeatability:
The data for repeatability for CEF at 276.60 nm&257.40 nm and LIN at 257.40 nm&276.60 nm is shown in table 5&6 respectively.
Tab.5 Repeatability data of CEF and LIN Tab.6 Repeatability data of CEF and LIN
Sample Conc. Mean ± S.D. (n=6)
%R.S.D.
Cefuroxime Axetil
4 0.29216 ± 0.003488
1.193%
Linezolid 4.8 0.19700 ± 0.001414
0.717%
II. Intraday precision:
The data for intraday precision for CEF at 276.60 nm&257.40 nm and LIN at 257.40 nm&276.60 nm is shown in table 7, 8, 9& 10 respectively.
Tab.7 Intraday precision data of CEF at 276.60nm Tab.8 Intraday precision data of LIN at 257.40nm
Tab.9 Intraday precision data of CEF at 257.40nm Tab.10 Intraday precision data of LIN at 276.60nm
Sr. No Conc. (µg/ml) Absorbance at 276.60 nm Mean ± S.D. (n=5)
%R.S.D.
1 2 0.1726±0.000816 0.472
2 3 0.2340±0.001897 0.810
3 4 0.2921±0.001329 0.454
4 5 0.3620±0.001414 0.390
5 6 0.4186±0.001211 0.289
Sr. No Conc. (µg/ml) Absorbance at 257.40 nm Mean ± S.D. (n=5)
%R.S.D.
1 2.4 0.1101±0.000632 0.574
2 3.6 0.1601±0.000753 0.470
3 4.8 0.1970±0.000632 0.320
4 6 0.2421±0.001169 0.482
5 7.2 0.2880±0.001265 0.439
Sample Conc. Mean ± S.D. (n=6)
%R.S.D.
Cefuroxime Axetil
4 0.40333 ± 0.000816
0.202%
Linezolid 4.8 0.57733 ± 0.003386 0.577% Sr. No. Conc. (µg/ml)
Mean abs. ± S.D. (n=3)
%R.S.D.
1. 3
0.313667±0.002082 0.663
2. 4
0.403333±0.000577 0.143
3. 5 0.490333±0.001528 0.311
Sr. No.
Conc. (µg/ml)
Mean abs. ± S.D. (n=3) %R.S.D. 1. 3.6 0.439000±0.002000 0.455 2. 4.8 0.577333±0.006506 1.126
3. 6 0.704000±0.007000 0.994
Sr. No.
Conc. (µg/ml)
Mean abs. ± S.D. (n=3)
%R.S.D.
1. 3
0.234000±0.002000 0.854
2. 4
0.292000±0.003000 1.027
3. 5 0.362000±0.004000 1.104
Sr. No.
Conc. (µg/ml)
Mean abs. ± S.D. (n=3) %R.S.D. 1. 3.6 0.160000±0.002000 1.250 2. 4.8 0.197000±0.001000 0.507
II. Interday precision:
The data for interday precision for CEF at 276.60 nm&257.40 nm and LIN at 257.40 nm&276.60 nm is shown in table 11, 12, 13& 14 respectively.
Tab.11 Interday precision data of CEF Tab.12 Interday precision data of LIN
Tab.13 Interday precision data of CEF Tab.14 Interday precision data of LIN
C) Accuracy:
Accuracy of the method was confirmed by recovery study from marketed formulation at three level of standard addition. The results are shown in table 15&16.
Tab.15 Determination of Accuracy for CEF and LIN
Drug Level Amount of sample (µg/ml)
Amount of standard spiked (µg/ml)
Total Amount
(µg/ml)
Amount Recovered
(µg/ml)
% Mean Recovery ± SD
(n=3)
CEF (276.60 nm)
0 % 4 - 4 3.992 -
80% 4 3.2 7.2 7.193 99.90%±0.005
100 % 4 4 8 7.980 99.75%±0.017
120 % 4 4.8 8.8 8.703 98.89%±0.081
LIN (257.40 nm)
0 % 4.8 - 4.8 4.784 -
80 % 4.8
3.8 8.6 8.642 100.02%±0.009
100% 4.8 4.8 9.6 9.500 98.95%±0.081
120 % 4.8 5.7 10.5 10.543 99.83%±0.009
Sr. No.
Conc. (µg/ml)
Mean abs. ± S.D. (n=3)
%R.S.D.
1. 3
0.313333±0.002517 0.803
2. 4
0.403000±0.002000 0.496
3. 5 0.490000±0.004000 0.816
Sr. No.
Conc. (µg/ml)
Mean abs. ± S.D. (n=3)
%R.S.D.
1. 3.6
0.439333±0.005508 1.253
2. 4.8
0.577333±0.007506 1.300
3. 6 0.704333±0.009504 1.349
Sr. No.
Conc. (µg/ml)
Mean abs. ± S.D. (n=3)
%R.S.D.
1. 3
0.313333±0.002517 0.803
2. 4
0.403000±0.002000 0.496
3. 5 0.490000±0.004000 0.816
Sr. No.
Conc. (µg/ml)
Mean abs. ± S.D. (n=3)
%R.S.D.
1. 3.6
0.439333±0.005508 1.253
2. 4.8
0.577333±0.007506 1.300
Tab.16 Determination of Accuracy for CEF and LIN
Drug Level Amount of sample (µg/ml)
Amount of standard spiked (µg/ml)
Total Amount
(µg/ml)
Amount Recovered
(µg/ml)
% Mean Recovery ± SD
(n=3)
CEF (257.4 0 nm)
0 % 4
- 4 3.974 -
80% 4
3.2 7.2 7.183 99.76%±0.016
100 % 4 4 8 8.006 100.07%±0.016
120 % 4
4.8 8.8 8.710 98.97%±0.088
LIN (276.6 0 nm)
0 % 4.8 - 4.8 4.816 -
80 % 4.8 3.8 8.6 8.523 98.64%±0.096
100% 4.8
4.8 9.6 9.710 101.14%±0.113
120 % 4.8 5.7 10.5 10.514 99.56%±0.027
Analysis of marketed formulation: Applicability of the proposed method was tested by analyzing the commercially available tablet formulation Linox*-XT. The results are shown in table 17.
Tab.17 Analysis of marketed formulation
Formulation (Tablet Linox*-XT)
Actual concentration
µg/ml
Amount obtained µg/ml
% CEF ± SD (n=3)
%LIN ± SD (n=3)
CEF LIN CEF LIN
Batch No.
MCRAE03 4 4.8 3.93 4.82
98.40± 0.011
Tab.18 Summary of Validation parameter of proposed method
5. Conclusion
From the overlay spectra of Cefuroxime Axetil and Linezolid it is observed that estimation of both the drug can be possible using Simultaneous Equation method. The method was developed and validated. The value of % recovery and standard deviation reveals that the proposed method was successfully utilized for the estimation of Cefuroxime Axetil and Linezolid in tablet dosage form. A simple, rapid and sensitive method is proposed for the analysis of two binary mixtures with overlapping spectra. The method involves the generation of absorbance spectra followed by measurement of the absorbance. Therefore, the presented methodology is adequate for the routine quality control analysis of these fixed-dose combinations.
Acknowledgements
The authors are thankful to the Wockhardt, Mumbai for providing the gift sample of Cefuroxime Axetil and Aristo Pharmaceuticals Pvt. Ltd, Mumbai for providing gift sample of Linezolid. The authors are also thankful to the Principle, Rofel Shri G. M. Bilakhia College of Pharmacy,Vapi, India, for providing the required facilities to carry out this research work.
References
[1] A. H. Backett, J. B. Stenlake, Practical pharmaceutical chemistry, CBS publishers and distributors, Delhi, 2002, 264-337. [2] K. D. Tripathi, Essentials of Medical Pharmacology, Sixed Ed., Jaypee Brothers Medical Publishers Ltd, 2010, 213-218. [3] G. R. Chatwal, S. Anand, Instrumental Methods of Chemical Analysis, Fifth Ed, Himalaya Publishing House, 2012, 180-198. [4] D. A. Skoog, F. J. Holler, T. A. Nieman, Introduction to UV Spectroscopy, Principle of instrumental analysis; fifth Ed, Thomson
Brooks/Cole publication, 2004,725-728.
[5] Y. R. Sharma, Ultraviolet and visible spectroscopy in Elementary Organic Spectroscopy, First Ed, S. Chand & Company Ltd., New Delhi, 2004, 9-60.
[6] S. B. Amir, M. A. Hossain, Development and validation of UV-Spectrophotometric method for determination of Cefuroxime axetil in bulk and in formulation. J.Sci.Res., 2014, 6:133-141.
Parameter
CEF at 276.60 nm
LIN at 257.40 nm
CEF at 257.40 nm
LIN at 276.60 nm
Conc. range (µg/ml) 2-6 2.4-7.2 2-6 2.4-7.2
Regression equation (y
= mx + c ) 0.0871x+0.0542 0.1073x+0.0546 0.0620x+0.0476 0.0365x+0.0242
Mean of Slop (m)
(n=6) 0.0871 0.1073 0.0620 0.0365
SD of Intercept (c)
(n=6) 0.05430 0.05460 0.04790 0.02420
Regression co-efficient 0.9999 0.9990 0.9991 0.9984
Repeatability (%RSD)
(n=6) 0.202 0.577 0.933 0.717
Intraday precision (n=3)
(% RSD)
0.372 0.858 0.995 0.861
Interday precision (n=3)
(% RSD)
0.705 1.300 1.159 1.376
LOD (µg/ml) (n=6) 0.026 0.021 0.065 0.972
LOQ (µg/ml) (n=6)
0.079 0.065 0.198 1.475
% Recovery 80%
99.90% 100.02% 99.76% 98.64%
100%
99.75% 98.95% 100.07% 101.14%
120%
[7] M. D. Game, D. M. Sakarkar, K. B. Gabhane, K. K. Tapar, Validated Spectrophotometric methods for the determination of Cefuroxime axetil in bulk drug and tablets. Int.J.ChemTech Res., 2010, 2:1259-1262.
[8] P. P. Jain, S. M. Surana, Development and validation of UV-Spectrophotometric method for determination of Cefuroxime axetil in bulk and in formulation. Int.J.Drug Res., 2011, 3:318-322.
[9] P. L. Ingale, S. A. Dalvi, D. D. Jadav, Simultaneous determination of Cefuroxime axetil and Potassium clavulanate in pharmaceutical sciences. Int.J.Pharm.Sci. 2013, 5:179-181.
[10] P. Prashanthi, A. Mateti, P. Vanitha, Development and validation of UV Spectrophotometric method for the Estimation of Linezolid in bulk and pharmaceutical formulation. Int.J.Pharm.Sci.Res., 2012, 2: 57-60.
[11] B. H. Saikiran, S. K. Johnny, UV Spectrophotometric method for the Estimation of Linezolid in tablets. Int J.Pharm.Chem.Sci., 2013, 3:729-731.
[12] D. T. Gadhiya, H. L. Bagada, Simultaneous equation method for the estimation of Cefixime trihydrate and Linezolid in their combined tablet dosage form by UV-Visible spectrophotometry. Inter.Bullet Drug Rese, 2013, 3:29-38.
[13] H. V. Joshi, J. K. Patel, Simultaneous estimation of linezolid and cefixime in their combined dosage form. Pharmatutor., 2014, 3:48-52.
[14] H. Shah, Method development and validation of spectrophotometric method for simultaneous estimation of cefiximetrihydrate and linezolid in their combined tablet dosage form. Int.J.Pharm.Res., 2012, 1:516-529.
[15] Indian Pharmacopoeia, the Indian Pharmacopoeia Commission, Ghaziabad, Govt. of India Ministry of Health and Family Welfare, 2010, 3:1326.