Article
J. Braz. Chem. Soc., Vol. 22, No. 6, 1068-1072, 2011. Printed in Brazil - ©2011 Sociedade Brasileira de Química 0103 - 5053 $6.00+0.00
A
*e-mail: [email protected]
Simultaneous HPTLC Determination of Nabumetone and Paracetamol in
Combined Tablet Dosage Form
Santosh V. Gandhi,* Sandeep S. Ranher, Padmanabh B. Deshpande and Dixit K. Shah
Department of Pharmaceutical Analysis, AISSMS College of Pharmacy, Kennedy Road, Pune - 411 00, Maharashtra, India
Um novo método de cromatograia em camada delgada de alta eiciência (HPTLC) para determinação simultânea de nebumetona e paracetamol em forma combinada em comprimido foi desenvolvido e validado. As separações foram efetuadas em placas de alumínio prerrecobertas com sílica gel 60 F254 utilizando tolueno:propanol-2:ácido acético (8:2:0.1, v/v/v) como fase móvel. A
determinação quantitativa das bandas foi feita por varredura densitométrica a 236 nm. Os fatores de retenção calculados para nebumetona e paracetamol foram 0,78 ± 0,03 e 0,32 ± 0,03, respectivamente. O método foi validado com relação à linearidade, exatidão, precisão e robustez. A curva de calibração mostrou-se linear dentro do intervalo de 50-250 ng por banda de ambas as drogas. O método tem sido aplicado com sucesso nas análises das drogas em formulações farmacêuticas. As porcentagens de precisão de ensaio (média ± desvio padrão) foram 99,89 ± 1,15 para nabumetona e 101,10 ± 0,71 para paracetamol, ambos de comprimidos disponíveis comercialmente.
A new simple high performance thin layer chromatographic method (HPTLC) for simultaneous determination of nabumetone and paracetamol in combined tablet dosage form was developed and validated. The separations were carried out on Merck aluminum plates precoated with silica gel 60 F254, using toluene:2-propanol:acetic acid (8:2:0.1, v/v/v) as mobile phase. Quantitative
determination of bands was done by densitometric scanning at 236 nm. The calculated retention factors for nabumetone and paracetamol were 0.78 ± 0.03 and 0.32 ± 0.03, respectively. The method was validated with respect to linearity, accuracy, precision and robustness. The calibration curves showed to be linear over a range of 50-250 ng per band for both drugs. The method has been successfully applied for the analysis of drugs in pharmaceutical formulation. The percentages of assay (mean ± S.D.) were 99.89 ± 1.15 for nabumetone and 101.10 ± 0.71 for paracetamol, both of commercially available tablets.
Keywords: nabumetone, paracetamol, high performance thin layer chromatography (HPTLC), tablet dosage form
Introduction
Nabumetone (NAB), chemically, 4-(6-methoxy-2-naphthyl)-2-butanone is a non-steroidal anti-inlammatory drug of the arylalkanoic acid family used to treat pain or inlammation caused by arthritis,1 being oficial in British
Pharmacopoeia2 and United States Pharmacopeia3 and Indian
Pharmacopeia.4Paracetamol (PAR), 4-hydroxyacetanilide
is a widely-used analgesic and antipyretic drug.5
T h e l i t e r a t u r e s u r vey r eve a l s t h a t s eve r a l chromatographic methods have been used for the analysis of NAB in biological fluids6-11 and in pharmaceutical
formulations.10-12 Also colorimetric13 and micellar stabilized
room temperature phosphorescence quantitation14 of NAB
as single component, or in combinations with other drugs, has been reported. Analytical methods have been reported for the determination of PAR including: high-performance
liquid chromatography-diode array (HPLC-DAD) with
online post-column photochemical derivatization,15
non-suppressed ion chromatography(IC),16 UV-Visible
spectrophotometry,17 HPLC,17-20 gas
chromatograph-mass spectrometry (GC-MS)21 as single component or in
combinations with other drugs. The chemical structures of the drugs are given in Figure 1.
HPTLC method for simultaneous determination of NAB and PAR in combined tablet dosage form. The proposed HPTLC method can be used for analysis of ten or more formulations on a single plate and is a rapid and cost-effective quality-control tool for routine simultaneous analysis of drugs. The technique is simpler and provides more lexibility than HPLC. The method was optimized and validated as per the International Conference on Harmonization (ICH) guidelines.22
Experimental
Reagents and chemicals
Authentic samples of NAB and PAR were obtained from Divi’s Laboratories Ltd. (Hyderabad, India) and Cipla Ltd. (Pune, India), respectively, used as such without further puriication. Brand of tablets Niltis P (Ipca laboratories Ltd., India), labeled to contain 500 mg of NAB and 500 mg of PAR were procured from the local market. Methanol, toluene, 2-propanol and acetic acid (all AR grade) were obtained from Sisco Research Laboratories (Mumbai, India). Silica gel 60 F254 TLC plates (20 × 20 cm, layer
thickness 0.2 mm, from Merck, Germany) were used as stationary phase.
Preparation of standard stock solutions
Standard stock solution of NAB and PAR was prepared by dissolving 10 mg of each drug in 10 mL of methanol separately to get concentration of 1 mg mL-1 from which
0.5 was further diluted to 10 mL to get stock solution of 50 ng µl-1 of each drug.
Chromatographic condition
The plates were prewashed with methanol and activated at 110 oC for 5 min, prior to chromatography.
The slit with dimensions of 5 × 0.45 mm and scanning speed of 20 mm s-1 were employed. The linear ascending
development was carried out in 10 × 10 cm twin trough glass chamber (Camag, Muttenz, Switzerland) using toluene:2-propanol:acetic acid (8:2:0.1, v/v/v) as mobile phase, after saturation of the chamber with mobile phase vapor for 10 min. The development distance and time were 9 cm and 20 min, respectively. After, chromatography plates were dried in a current of air with the help of a hair dryer. A Camag HPTLC system containing Camag Linomat V semiautomatic sample applicator, Hamilton syringe (100 µl), Camag TLC Scanner-3 with winCATS software version 1.4.2 and Camag twin- trough chamber (10 × 10 cm) were used for the present study. The source of radiation utilized was deuterium lamp emitting a continuous UV spectrum between 200 to 400 nm.
Selection of detection wavelength
After chromatographic development bands were scanned over the range of 200-400 nm (with a spectrum scan speed of 100 nm s-1) and the spectra were overlain.
It was observed that both drugs showed considerable absorbance at 236 nm, which was selected as the wavelength for detection (Figure 2).
Preparation of calibration curves
The standard stock solutions of NAB and PAR (50 ng µL-1 each) were applied by overspotting on TLC
plate in range of 1-5 µL with the help of CAMAG 100 µL
sample syringe, using Linomat 5 sample applicator to get concentrations 50, 100, 150, 200 and 250 ng per
band. The plate was developed and scanned under above established chromatographic conditions. Each standard in ive replicates was analyzed and peak areas were recorded. Calibration curves of NAB and PAR were plotted separately of peak area vs. respective concentration of NAB and PAR. Figure 1. Chemical structures of NAB and PAR.
H3CO
CH3
O
NAB
PAR HO
H N
CH3
O
Analysis of tablet formulation
Twenty tablets were weighed accurately and finely powdered. A quantity of powder equivalent to 10 mg of each NAB and PAR was weighed and transferred to a 10 mL volumetric lask containing approximately 7 mL of methanol, ultrasonicated for 5 min, and volume was made up to the mark with the methanol. The solution was iltered through Whatman 41 ilter paper, and 0.5 mL of iltrate was further diluted to 10 mL with methanol. Then, 2 µL volume were were applied to a TLC plate to furnish inal concentration of 100 ng per band for both NAB and PAR. After chromatographic development the peak areas of the bands were measured at 236 nm and the amount of each drug present in sample was estimated from the respective calibration curves. Procedure was repeated six times for the analysis of homogenous sample.
Recovery studies
To check the accuracy of the method, recovery studies were carried out by addition of standard drug solution to preanalyzed sample solution at three different levels, 50, 100 and 150%. Chromatogram was developed and the peak areas were noted. At each level of the amount, three determinations were carried out.
Precision
Set of three different concentrations in three replicates of mixed standard solutions of NAB and PAR were prepared. All the solutions were analyzed on the same day in order to record any intra-day variations in the results. For inter-day variation study of three different concentrations of the mixed standard solutions in linearity range were analyzed on three consecutive days.
Robustness studies
In the robustness study, the inluence of small, deliberate variations of the analytical parameters on peak area of the drugs were examined. Factors varied were development distance (± 5%), time from application to development (0, 10, 20 and 30 min) and from development to scanning (0, 30, 60, and 90 min). One factor at a time was changed to study the effect. Robustness of the method was checked at a concentration level of 100 ng per bandfor both NAB and PAR.
Results and Discussion
Different mobile phases containing various ratios of toluene, methanol, acetic acid were examined
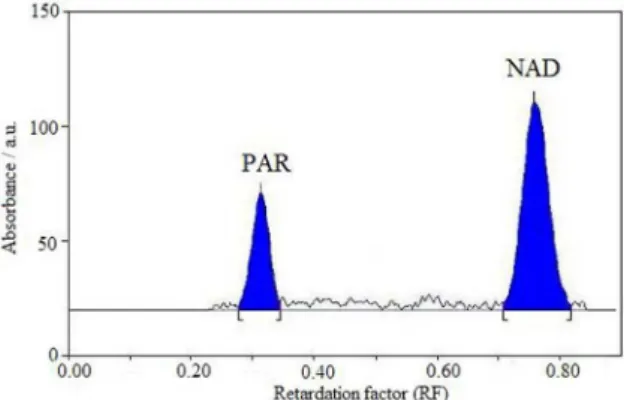
(data not shown). Finally the mobile phase containing toluene:2-propanol:acetic acid (8:2:0.1, v/v/v) was selected as optimal for obtaining well deined and resolved peaks. The optimum wavelength for detection and quantitation used was 236 nm. The retention factors for NAB and PAR were found to be 0.78 ± 0.03 and 0.32 ± 0.03, respectively. Representative densitogram obtained from a mixed standard solution of NAB and PAR is shown in Figure 3.
Straight-line calibration graphs were obtained for NAB and PAR in the concentration range 50-250 ng per band for both the drugs with high correlation coeficient > 0.999 (Figure 4). For NAB, the percentage of recovery study ranged from 99.44 to 100.41% with % RSD values ranging from 0.85 to 1.28%. For PAR, the recovery results ranged from 99.41 to 100.77% with % RSD values ranging from 0.99 to 1.34%. The method was found to be accurate and precise, as indicated by recovery studies as recoveries were close to 100% and % RSD not more than 2. Results of recovery studies are reported in Table 1. Intra-day variation, as % RSD, was 0.78 for NAB and 0.92 for PAR. Inter-day variation, as % RSD was 1.64 for NAB and 1.43 for PAR, as presented in Table 2.
Robustness of the method checked after deliberate alterations of the analytical parameters showed that areas of peaks of interest remained unaffected by small changes of the operational parameters (% RSD < 2). The results are given in Table 3. The proposed method was also evaluated by the assay of commercially available tablets containing NAB and PAR. The % of assay (mean ± S.D.) was found to be 99.89 ± 1.15 for NAB and 101.10 ± 0.71 for PAR.
Conclusions
The validated HPTLC method employed proved to be simple, fast, accurate, precise and robust, thus can be used for routine analysis of NAB and PAR in combined tablet dosage form.
Table 1. Recovery studies of NAB and PAR
Drug Level of % of recovery
Amount taken (ng per band)
Amount added (ng per band)
Total amount found
(ng per band) % of recovery
a % RSDa
NAB 50 100 50 149.35 99.57 1.19
100 100 100 200.82 100.41 1.28
150 100 150 248.60 99.44 0.85
PAR 50 100 50 149.58 99.72 1.34
100 100 100 198.82 99.41 1.14
150 100 150 251.92 100.77 0.99
aAverage of three determinations.
Table 2. Percentages of recovery for intra- and inter-day variation studies
Concentration (ng per band)
NAB (% of recovery) PAR (% of recovery)
Intra-day Inter-day Intra-day Inter-day
100 100.53 100.09 100.6 99.23
100 98.65 99.79 99.53 100.78
100 99.53 101.36 98.48 98.12
150 101.1 102.89 99.78 98.52
150 99.86 99.85 98.54 100.65
150 99.12 98.12 98.69 99.38
200 99.87 101.89 100.6 98.58
200 100.07 98.42 98.32 102.7
200 98.89 98.56 98.62 99.73
Mean
(% of recovery) 99.74 100.11 99.24 99.74
% RSD 0.78 1.64 0.92 1.43
Table 3. Relative standard deviation of peak area obtained under robustness study
Serial
Number Parameter varied NAB PAR
1 development distance 0.96 0.68
2 time from application to development (min) 0.84 0.49
3 time from development to scanning (min) 1.12 0.62
Figure 4. Calibration curves for NAB and PAR.
Acknowledgement
The authors wish to express their gratitude to M/s Divi’s Laboratories Ltd. (Hyderabad, India) for the sample of pure nabumetone and M/s Cipla Ltd. (Kurkumbh, India) for the sample of pure paracetamol.
References
1. http://en.wikipedia.org/wiki/nabumetone accessed in April 2008.
2. The United States Pharmacopeial Convention, The United States Pharmacopeia, 29th ed., Rockville, 2006.
3. The Oficial Compendia of Standards, British Pharmacopoeia, vol. 1, Her Majesty’s Stationery Ofice: London, 1993. 4. The Oficial Compendia of Standards, Indian Pharmacopoeia,
vol. 2, the Controller of Publication: New Delhi, 1996. 5. http://en.wikipedia.org/wiki/paracetamol accessed in April
2008.
6. AL-Momani, I. F.; Anal. Lett. 1997, 30,2485.
7. Kobylinska, K.; Barlinska, M.; Kobylinska, M.; J. Pharm. Biomed. Anal.2003, 32, 323.
8. Nobilis, M.; Kopecky, J.; Kvetina, J.; Svoboda, Z.; Pour, M.; Kunes J.; Holcapek, M.; J. Pharm. Biomed. Anal.2003, 32, 641.
10. Mikami, E.; Goto, T.; Ohno T.; Matsumoto, H.; Nishida, M.;
J. Pharm. Biomed. Anal.2000, 23, 917.
11. Rao,R. N.; Meena, S.; Nagaraju, D.; Rao, A. R. R.; Biomed. Chromatogr.2004, 19, 362.
12. Can, N. O.; Tuncel, M.; Aboul-Enein, H. Y.; Pharmazie 2003,
58, 22.
13. Rao, Y. S.; Chowdary, K. P. R.; Rao, J. V.; Seshagiri, L. N.;
Indian J. Pharm. Sci.2003, 65, 206.
14. Murilo, P. J. A.; Alañón, M. A.; Alañón, P. M. T.; Anal. Chim. Acta2005, 528, 77.
15. Di Pietra, A. M.; Gatti, R.; Andrisano, V.; Cavrini, V.;
J. Chromatogr. A 1996, 729, 355.
16. Perez, J. L.; Bello, M. A.; Talanta. 1999, 48, 1199.
17. Dinc, E.; Kokdil, G.; Onur, F.; J. Pharm. Biomed. Anal.2001,
26, 769.
18. Franeta, J. T.; Agbaba, D.; Eric, S.; Pavkov, S.; Aleksic, M. Vladimirov, S.; IlFarmaco2002, 57, 709.
19. Momin, M. Y.; Yeole, P. G.; Puranik, M. P.; Wadher, S. J.; Indian J. Pharm. Sci.2006, 68, 387.
20. Panusa, A.; Multari, G.; Incarnato, G.; Gagliardi, L.; J. Pharm. Biomed. Anal.2007, 43, 1221.
21. Alves, T. M. A.; Augusti, R.; J. Braz. Chem. Soc. 2008, 19, 81. 22. ICH, International Conference on Harmonization of Technical
Requirements for Registration of Pharmaceuticals for Human Use, Q2B(R1), Guideline on Validation of Analytical Procedure: Text and Methodology, Geneve, 2005.
Submitted: May 5, 2010