Short Report
S
J. Braz. Chem. Soc., Vol. 22, No. 10, 2005-2012, 2011.Printed in Brazil - ©2011 Sociedade Brasileira de Química 0103 - 5053 $6.00+0.00
*e-mail: [email protected]
Development and Validation of a Simple and Rapid Capillary Zone Electrophoresis
Method for Determination of NNRTI Nevirapine in Pharmaceutical Formulations
Luiz A. Zanolli Filho,a Cristiane R. Galdez,b Claudinei A. Silva,a
Marina F. M. Tavares,a Diana M. Costab and María S. Aurora-Prado*,c
aInstituto de Química, Universidade de São Paulo, Av. Prof. Lineu Prestes, 748,
05508-900 São Paulo-SP, Brazil
bCentro de Ciências Biológicas e da Saúde, Universidade Federal de Maranhão,
Av. dos Portugueses, s/n, Bacanga,Campus do Bacanga, 65085-580 São Luís-MA, Brazil
cFaculdade de Ciências Farmacêuticas, Universidade de São Paulo,
Av. Prof. Lineu Prestes, 580, 05508-900 São Paulo-SP, Brazil
Um método simples e rápido por eletroforese capilar foi desenvolvido e validado para a quantiicação do inibidor não nucleosídeo da transcritase reversa (NNRTI) nevirapina,
em medicamentos. A análise foi otimizada utilizando tampão fosfato de sódio 10 mmol L-1,
pH 2,5, voltagem aplicada de +25 kV, injeção hidrodinâmica a 0,5 psi por 5 s e detecção UV
em 200 nm. Diazepam (50,0 µg mL-1) foi usado como padrão interno. Sob estas condições,
nevirapina foi analisada em aproximadamente menos de 2,5 min. A curva analítica apresentou um coeiciente de correlação de 0,9994. Os limites de detecção e quantiicação foram
1,4 µg mL-1 e 4,3 µg mL-1, respectivamente. Precisões intra e inter-dia expressas como desvio
padrão relativo foram 1,4% e 1,3%, respectivamente e a recuperação média foi de 100,81%. O fármaco foi submetido a testes de hidrólises (ácida, básica e neutra) e a estresse oxidativo. Não foi observada interferência por parte dos produtos de degradação, nem dos excipients na análise da nevirapina. Este método mostrou ser rápido, simples, preciso, exato e econômico para a determinação de nevirapina em produtos farmacêuticos e é apropriado para o controle de qualidade em análise de rotina uma vez que a eletroforese capilar oferece benefícios em termos de desenvolvimento rápido dos métodos e custos muito reduzidos de operação.
A simple and fast capillary zone electrophoresis (CZE) method has been developed and validated for quantiication of a non-nucleoside reverse transcriptase inhibitor (NNRTI)
nevirapine, in pharmaceuticals. The analysis was optimized using 10 mmol L-1 sodium
phosphate buffer pH 2.5, +25 kV applied voltage, hydrodynamic injection 0.5 psi for 5 s and
direct UV detection at 200 nm. Diazepam (50.0 µg mL-1) was used as internal standard. Under
these conditions, nevirapine was analyzed in approximately less than 2.5 min. The analytical curve presented a coeficient of correlation of 0.9994. Limits of detection and quantiication
were 1.4 µg mL-1 and 4.3 µg mL-1, respectively. Intra- and inter-day precision expressed as
relative standard deviations were 1.4% and 1.3%, respectively and the mean recovery was 100.81%. The active pharmaceutical ingredient was subjected to hydrolysis (acid, basic and neutral) and oxidative stress conditions. No interference of degradation products and tablet excipients were observed. This method showed to be rapid, simple, precise, accurate and economical for determination of nevirapine in pharmaceuticals and it is suitable for routine quality control analysis since CE offers beneits in terms of quicker method development and signiicantly reduced operating costs.
Introduction
Nevirapine (11-cyclopropyl-4-methyl-5,11-dihydro-6H-dipyrido[3,2-b:2’,3’-e][1,4]diazepin-6-one)1,2 is a non-nucleoside reverse transcriptase inhibitor (NNRTI) that stops HIV from multiplying by preventing the reverse transcriptase enzyme from working. This drug is usually included in the generic fixed-dose combinations and has shown eficacy in advanced HIV disease.3 Several analytical methods have been developed for analyzing nevirapine and other antiretroviral drugs including derivative UV spectrophotometry4 and high performance thin layer chromatography (HPTLC).5 High performance liquid chromatography (HPLC) has been widely used for determination of antiretrovirals in both biological luids and pharmaceutical formulations,6-11 hyphenated HPLC-MS12-17 systems have also been introduced for the determination of antiretrovirals in plasma. Many of these methods require the use of expensive and hazardous chemicals which make the process complex, time consuming and costly. Capillary electrophoresis has become an active research and development area of considerable interest in analytical chemistry and has been widely adopted for the analysis of drugs and pharmaceuticals18 due to its simplicity, wide application, small sample volume requirement, short analysis time, high resolution and low running cost with eco-friendly solvents as compared to HPLC.
Several CE methods were also available in the recent literature for the determination and separation of antiretroviral drugs in serum samples using solid phase extraction procedures.19-22 Hyphenated CE-MS systems were also used.23 A few CE methods were reported for the determination and validation of antiretrovirals drugs in bulk drugs and pharmaceutical formulations.24,25 Sekar and Azhaguvel,25 separated and determined lamivudine and stavudine with the nevirapine (NNRTI) in pharmaceutical formulations by micellar electrokinetic capillary chromatographic (MEKC) method, all antiretroviral drugs were separated within 14 min using 10 mmol L-1 sodium tetraborate (pH 9.8), 100 mmol L-1 SDS and 15% 2-propanol as an organic modiier. The development of a simple CZE method when compared with MEKC method can supply a very useful alternative for routine analysis of pharmaceutical formulations.
Thus, as part of our ongoing anti-HIV research and considering that nevirapine is currently part of the AIDS treatment, there is a need to develop speciic methodologies for its quality control. The aim of this study was to develop and validate a rapid, simple, inexpensive and environmental friendly capillary zone electrophoresis method, which is much faster than the existing MEKC or even CZE methods,
for the determination of nevirapine in drug substance and formulated products suitable for routine quality control analysis and stability tests.
Experimental
Reagents and chemicals
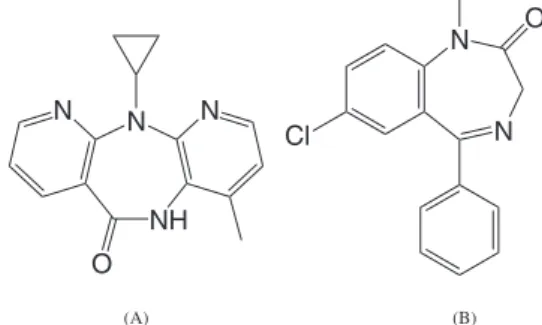
All the reagents used in the method development and validation were of analytical grade, the solvents of chromatographic purity and the water was puriied by deionization (Milli-Q, Millipore, Bedford, MA, USA). The electrolyte buffer phosphate at 10 mmol L-1 concentration and pH 2.52 was prepared by dissolution of equimolar amounts of sodium dihydrogenphosphate dehydrate (Merck, São Paulo, Brazil) and o-phosphoric acid (Sigma, Milwaukee, WI, USA). Nevirapine (Figure 1A) and diazepam (Figure 1B) standards were kindly donated by Farmanguinhos (Rio de Janeiro, Brazil) and used without further puriication. Commercial samples of nevirapine tablets containing 200.0 mg of nevirapine were obtained from three local laboratories (São Paulo, Brazil) named laboratory A, B and C.
Equipment and capillary conditioning
The experiments were performed using two CE systems: model P/ACE 5510 (Beckman Coulter Instruments, Fullerton, CA, USA), equipped with a variable UV-Vis, software for data acquisition and treatment (Beckman P/ ACE System Gold Software) and model HP3DCE (Agilent Technologies, Palo Alto, CA, USA), equipped with a diode array detector, software for data acquisition and treatment (HP ChemStation, rev A.08.03). Samples were introduced onto the capillary via hydrodynamic injection (0.5 psi for 5 s, Beckman instrument, 1 psi = 6894.76 Pa; 50 mBar for 5 s, Agilent instrument, 1 mBar = 100 Pa). The instruments were operated under positive polarity, with a constant voltage of +25 kV. Detection wavelength was set at 200 nm and the capillary temperature was 25 ºC.
Figure 1. Chemical structures of nevirapine (A) and diazepam (B).
NH N
N N
O
N N
Cl
O
For capillary conditionating an uncoated fused-silica capillaries (Polymicro Technologies, Phoenix, AZ, USA) with an inner diameter of 75 µm and total length of 27.0 cm (19.4 cm to the detector) for Beckman instrument and 31.5 cm (23.0 cm to the detector) for Agilent instrument were used. New capillaries were conditioned by lushes with 1 mol L-1 NaOH (30 min), followed by deionized water (30 min) and electrolyte (10 min). At the beginning of the day, the capillary was conditioned with 1 mol L-1 of NaOH for 5 min, followed by deionized water for 5 min and electrolyte buffer for 10 min. In between runs, the capillary was rinsed with the electrolyte solution for 1 min. At the end of the day, a inal 5 min wash with 1 mol L-1 NaOH and water was performed.
Preparation of standard solutions
Separate standard stock solutions of nevirapine (200.0 µg mL-1) and diazepam (500.0 µg mL-1), used as internal standard (IS), were prepared in acetonitrile and methanol, respectively. Working standard solutions were prepared fresh daily by diluting appropriately the stock solutions with deionized water.
Sample preparation
Twenty tablets of each sample (laboratories A, B and C) were inely powdered. Amounts corresponding to 20.0 mg of nevirapine of each sample were weighed, transferred into separate 100 mL volumetric amber lasks; 50 mL of acetonitrile was added to each lask for dissolution. The volume was completed with deionized water. The solutions were sonicated for 10 min and iltered using a 0.45 µm ilter (Millipore), rejecting the irst 5 mL. Aliquots of 5 mL of these solutions and 1.0 mL of standard stock solution of diazepam (500.0 µg mL-1) were transferred into 10 mL volumetric amber lasks and volumes were completed with deionized water. Final concentrations were 100.0 µg mL-1 and 50.0 µg mL-1 for nevirapine and diazepam, respectively. A standard solution was prepared at the same concentration of the sample, following the procedure described above. The samples and the standards solutions were sonicated for 10 min prior to introduction onto the capillary column.
Stress testing
For stress degradation studies the drug substance, nevirapine, was subjected to neutral, acid and alkaline hydrolysis and chemical oxidation. Individually 10.0 mg mL-1 of the drug were diluted with 5 mL of water, 1 mol L-1 HCl and 1 mol L-1 NaOH solutions in 10 mL volumetric lasks,
the volumes were completed with acetonitrile. To analyze chemical oxidation, 10.0 mg mL-1 of the drug was diluted with 5 mL 3% H2O2 solution in a 10 mL volumetric lask. These mixtures were heated at 80 ºC for 2 h. After completion of the degradation processes, the acid and alkaline solutions were neutralized. After stressing time adequate dilutions were made from each solution. The inal concentration of nevirapine was 100.0 µg mL-1.
Method validation
The proposed CZE method was validated based on the recommendations of the International Conference on Harmonization26 and United States Pharmacopeia2 guidelines.
Linearity
Aliquots of 4.0, 4.5, 5.0, 5.5, and 6.0 mL from the standard stock solution of nevirapine (200.0 µg mL-1) and aliquots of 1.0 mL from standard stock solution of diazepam (500.0 µg mL-1) were transferred into separate 10 mL volumetric amber lasks. The volumes were completed with deionized water. Concentration range from 80.0 to 120.0 µg mL-1 of nevirapine, and 50.0 µg mL-1 of diazepam were obtained. The solutions were sonicated for 10 min, and iltered using a 0.45 µm ilter (Millipore) prior injection.
Precision
The repeatability (intra-day precision) was determined preparing samples solutions of nevirapine at three concentration levels (80.0, 100.0 and 120.0 µg mL-1) of the analytical curve with a constant amount of diazepam (50.0 µg mL-1) (IS). Three determinations of each concentration level were performed.
The intermediate precision (inter-day precision) was evaluated as described in repeatability, but it was performed in three different days. Precision was expressed by the relative standard deviation (RSD%) for peak area ratio (PAR) of nevirapine/IS.
Accuracy (recovery test)
To determine the accuracy of the CZE method, recovery experiments were performed according to procedures endorsed by AOAC International.27 Nevirapine standard stock solution was added to commercial sample solutions and analyzed by the proposed method, according to the procedure depicted in Table 1.
Robustness
CE instruments. Signiicance tests were performed in the results to verify whether there is a statistically signiicant difference. Moreover, the effects of the applied voltage (22-28 kV) and capillary temperature (22-28 ºC) were deliberately modified. Standard solutions containing 100.0 µg mL-1 of nevirapine and 50.0 µg mL-1 of diazepam (IS) were prepared and injected in triplicate. Relative standard deviations (RSD %) for peak area ratio (PAR) of nevirapine/IS were obtained.
Results and Discussion
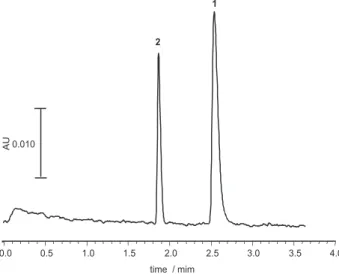
Prior to method development, a few structural characteristics of the compound structure were taken into account. The basic character of nevirapine (Figure 1A) makes it a suitable molecule for CE analysis. The overall charge of the molecule and consequently its mobility can be modified by controlling the electrolyte buffer pH. At low pH, the amine groups are readily protonated and the molecule bears a positive charge. At this low pH condition, only the electrophoretic mobility contributes for the net transport of the analyte towards the detector, since a negligible electroosmotic low is observed. Thus, a good choice for the electrolyte is a phosphate buffer, which presents adequate buffering capacity around pH 2.5. An internal standard (diazepam, Figure 1B) was selected. Internal standards are often used to minimize injection volume luctuations, dilution errors and errors during sample treatment. The proper choice of an internal standard can substantially improve precision of peak area determinations. The choice of detection wavelength was based on the inspection of the UV spectra of nevirapine and diazepam in the optimal electrolyte (not shown). In order to assure the method maximum sensitivity and accuracy, 200 nm was selected. Figure 2 illustrates the separation of diazepam and nevirapine standards under selected optimal conditions, conirming that diazepam performs well as internal standard. Migration times were approximately 2.0 and 2.6 min, respectively.
Sekar and Azhaguvel,25 using micellar electrokinetic chromatography (MEKC) method separated nevirapine from lamivudine and stavudine (tablets) in approximately 12 min. The migration time of nevirapine is approximately ive times higher when compared with the proposed CZE method. Furthermore, the CZE method did not generate hazardous organic solvents in contrast to MEKC method above described which uses 2-propanol.
In the HPLC methods described by Sarkar9 and Kapoor10 the authors identiied nevirapine in about 5 and 14.5 min, respectively in pharmaceutical tablet form. Rebiere11 separated nevirapine from the others antiretrovirals drugs in approximately 2.7 min but nevirapine was not well separated from fosamprenavir drug.
The applicability of proposed method to commercial sample tablets containing nevirapine is demonstrated by Figure 3B.
Before a method is routinely used, it must be validated. The validation process provides that the method is acceptable for its purpose. In the present work the CZE method was validated by determining its performance characteristics regarding speciicity, linearity, limits of detection and quantiication, precision, accuracy, robustness and system suitability.2,26 All validation parameters were determined using Beckman instrument except for speciicity (Agilent instrument) and robustness, which was assessed during sample analyses in both Beckman and Agilent instruments.
System suitability tests are used to verify that the resolution and reproducibility of the chromatographic system are adequate for the analysis to be done.2 According
Table 1. Procedure for the recovery test (standard solution of nevirapine added to commercial sample solution)
Nevirapine standard solution (200.0 µg mL-1)
Commercial samplea
(200.0 µg mL-1)
Final concentration / (µg mL-1)
Aliquots / mLb Aliquots / mLb Nevirapine Internal Standard
2 2 80 50
2.5 2.5 100 50
3 3 120 50
aProcedure was performed on commercial samples A, B and C; bto 10 mL
volumetric amber lasks.
Figure 2. Electropherogram of nevirapine (peak 1; 100.0 µg mL-1) and
diazepam (peak 2; 50.0 µg mL-1) standard drugs. Conditions: silica-fused
capillary with 75 µm i.d. and a total length of 27 cm (19.4 cm to the detector), electrolyte constituted of 10 mmol mL-1 phosphate buffer at
to the FDA28 theoretical plate number must be higher than 2000, tailing factor ≤ 2, and resolution higher than 2. Table 2 shows the results obtained for nevirapine (100.0 µg mL-1 and diazepam (50.0 µg mL-1) standard solutions. All parameters are in accordance with FDA recommendations.
Since sample placebo was not available, the method speciicity was attested by inspection of the spectral purity of the nevirapine peak in the sample electropherogram
(Agilent instrument, not shown). A purity index superior to 98.8% was obtained, conirming the method speciicity for nevirapine. Furthermore, was demonstrated non-interference between nevirapine and excipients from the sample (Figure 3B).
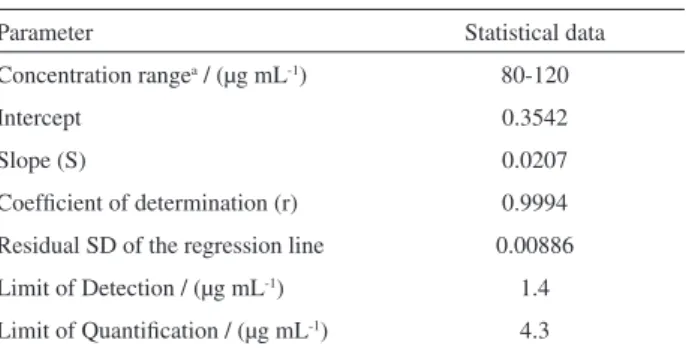
To establish the method linearity, diluted fortified standard solutions were injected in triplicate and average peak area ratios (nevirapine/diazepam) were plotted against the corresponding nevirapine concentrations. Linearity was assessed by least-squares regression analysis.29 Coeficients of correlation (0.99 or greater) and intercept close to the origin should be obtained.30 As shown by the statistical data organized in Table 3, the method exhibited excellent linearity (r > 0.999) over the concentration range 80.0-120.0 µg mL-1. Limits of detection and quantiication were 1.4 µg mL-1 and 4.3 µg mL-1, respectively. The criterion used to determine the limit of detection (LOD) and quantiication (LOQ) was based on the residual standard deviation (SE) of the regression line of the analytical curve and its slope (S) (Table 3), according to LOD = 3.3 SE/S and LOQ = 10 SE/S.31
The intra- and inter-day precisions of the proposed analytical method were determined at concentrations in the low, middle and high linearity range with the constant amount of IS. The RSD % values for the peak area ratios are given in Table 4. Averages values of 1.4% and 1.3% RSD for intra- and inter-day precision were obtained indicating a good agreement among individual test results. The criterion for precision demands a RSD smaller than 2%.18
The method accuracy was evaluated as the percentage recovery of a known amount of standard added to samples as endorsed by ICH26 and AOAC International27 protocols. Table 5 shows that recoveries ranged from 99.64 to 102.46% for three concentration level. Mean recoveries should be within 100 ± 2% at each concentration level over the range 80-120% of the target concentration.1
Figure 3. Electropherograms of: A) nevirapine (peak 1; 100.0 µg mL-1)
and diazepam (peak 2; 50.0 µg mL-1) standard solutions. B) Typical
pharmaceutical sample (tablet from laboratory A). Conditions: capillary of silica-fused with 75 µm i.d. and a total length of 27 cm (19.4 cm to the detector), electrolyte: 10 mmol mL-1 phosphate buffer at pH = 2.5,
injection: 0.5 psi for 5 s, detection at 200 nm, voltage: +25 kV.
Table 2. System suitability testing for CZE method
Parameters CZE
Nevirapine Diazepam
Theoretical plates (N, plates/m) 1.27 × 10⁴ 2.2 × 10⁴
Asymmetry (As) 1.5 1.0
Selectivity (α) (IS-nevirapine) 1.3
Resolution (Rs) (IS-nevirapine) 3.25
IS: internal standard (diazepam).
Table 3. Linearity, limit of detection and limit of quantiication determined for the proposed CZE method
Parameter Statistical data
Concentration rangea / (µg mL-1) 80-120
Intercept 0.3542
Slope (S) 0.0207
Coeficient of determination (r) 0.9994
Residual SD of the regression line 0.00886
Limit of Detection / (µg mL-1) 1.4
Limit of Quantiication / (µg mL-1) 4.3
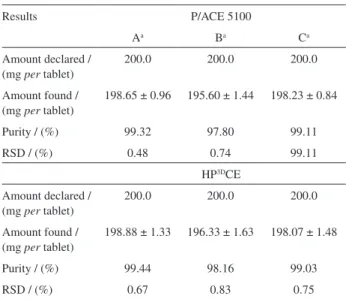
Samples of nevirapine tablets from three different laboratories were assayed against a reference standard solution of nevirapine to establish the assay. Both solutions were prepared at 100.0 µg mL-1 of nevirapine. The results in Table 6 demonstrated that the proposed method is suitable for determination of nevirapine in tablets within tolerance limits (90-110% label claim).
The robustness of the proposed method was evaluated by statistical comparison of assay results generated by two different CE instruments (Table 6). Signiicance tests were performed in the results (Table 7). As observed, calculated
F values are smaller than the critical F value, attesting that there is no statistical difference in the assay results, at a conidence level of P = 95%.32 Furthermore, no signiicant changes were observed in the instrumental responses when the analytical parameters were deliberately modiied. When the voltage was changed from 22 kV to 28 kV, the values of RSD% were 1.52% and 1.53%, respectively for PAR of nevirapine/IS and when the temperature was changed from 22 ºC to 28 ºC, the RSDs% were 1.07% and 1.17%, respectively for PAR of nevirapine/IS. These results obtained were similar to those of the initial conditions
(25 kV and 25 ºC). Thus, the proposed method can be considered robust and reliable.
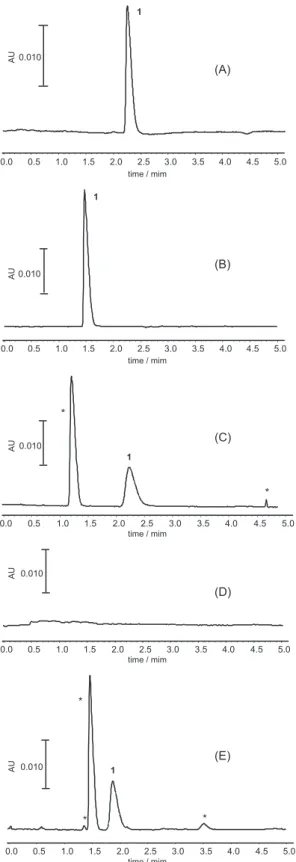
CZE studies of drug nevirapine obtained on stress testing suggested the following degradation behavior. Degradation was not observed when nevirapine was subjected to neutral hydrolysis (water at 80 ºC for 2 h) (Figure 4B). Signiicant degradation was observed when the drug was subjected to alkaline hydrolysis (1 mol L-1 NaOH at 80 ºC for 2 h), leading to the formation of unknown degradation products in approximately 1.2 (major peak) and 4.6 min (Figure 4C). The same was observed under oxidative conditions (3% H2O2 at 80 ºC for 2 h) leading to the formation of unknown degradation peaks in approximately 1.4, 1.6, and 3.7 min, the major product was seen at around 1.6 min (Figure 4E). Under acidic conditions (1 mol L-1 HCl at 80 ºC for 2 h) nevirapine was almost completely degraded (Figure 4D). The proposed CZE method was appropriate for quantitative determination of nevirapine in the presence of its degradation products.
Table 4. Intra and inter-day precision of the proposed CZE method for nevirapine quantitative determination
Precision Sample concentration / (µg mL
-1)
80.0 100.0 120.0
Intra-day/(% RSD for PAR)a 1.2 1.4 1.7
Average / (%RSD) 1.4
Inter-day / (%RSD for PAR)a
Day 1 1.7 1.1 1.7
Day 2 1.0 1.7 1.1
Day3 1.1 1.7 1.0
Average / (%RSD)b 1.3
PAR: peak area ratio (nevirapine/internal standard). aThree determinations
at each concentration level. bAverage of relative standard deviation (27
determination).
Table 5. Recovery of a standard solution of nevirapine added to samples and determined using the proposed CZE method
Standard added to commercial samples / (µg mL-1)
Standard found / (µg mL-1)
Samples
Recoverya /
(%) Samples
A B C A B C
40.0 39.87 40.13 40.54 99.68 100.33 101.35
50.0 51.23 50.35 49.82 102.46 100.70 99.64
60.0 59.95 61.28 60.65 99.92 102.13 101.08
aAverage of three determinations. A, B and C: pharmaceutical laboratories.
Table 6. Assay results for sample tablets of nevirapine
Results P/ACE 5100
Aa Ba Ca
Amount declared / (mg per tablet)
200.0 200.0 200.0
Amount found / (mg per tablet)
198.65 ± 0.96 195.60 ± 1.44 198.23 ± 0.84
Purity / (%) 99.32 97.80 99.11
RSD / (%) 0.48 0.74 99.11
HP3DCE
Amount declared / (mg per tablet)
200.0 200.0 200.0
Amount found / (mg per tablet)
198.88 ± 1.33 196.33 ± 1.63 198.07 ± 1.48
Purity / (%) 99.44 98.16 99.03
RSD / (%) 0.67 0.83 0.75
aAverage of three determinations. A, B and C: pharmaceutical laboratories.
Table 7. Results obtained in the comparison of the precision of nevirapine determination, using the two CE equipmentsa
Samples Comparison between HP3DCE and P/ACE MDQ
Precision, calculated F-valueb
A 1.39
B 1.13
C 1.76
A, B and C: Pharmaceutical laboratories. aHP3DCE: capillary
electrophoresis system from Agilent Technologies and P/ACE MDQ: capillary electrophoresis system from Beckman Coulter Inc. bTabulated
Conclusions
A fast, simple and reliable CZE method for the determination of nevirapine in tablets has been developed and validated. This electrophoretic assay fulilled all the requirements to be identiied as a reliable and feasible method, including linearity, accuracy, robustness and precision data. It is a highly speciic and precise analytical procedure. Therefore, this method performance makes it suitable for implementation in pharmaceutical laboratories for routine analysis of nevirapine formulations and raw materials and it can be used as a stability-indicating method.
Acknowledgments
The authors wish to acknowledge the Fundação de Amparo à Pesquisa do Estado de São Paulo of Brazil for inancial support (FAPESP 97/01320-4; 00/04414-4) and fellowships (FAPESP, 05/52079-3).
References
1. http://www.who.int/phint accessed in June 2010.
2. United States Pharmacopeia 33th ed.:Validation of Compendial
Procedures; The United States Pharmacopeial Convention Inc.: Rockville, MD, 2010, ch. 1225.
3. Podzamczer, D.; Ferrer, E.; Consiglio, E.; Gatell, J. M.; Perez, P.; Perez, J. L.; Luna, E.; González, A.; Pedrol, E.; Lozano, L.; Ocaña, L.; Llibre, J. M.; Casiró, A.; Aranda, M.; Barrufet, P.; Martínez-Lacasa, J.; Miró, J. M.; Badía, X.; Casado, A.; Lupo, S.; Cahn, P.; Maños, M.; Estela, J.; Antivir. Ther.2002, 7, 81. 4. Erk, N.; Pharmazie2004, 59, 106.
5. Kaul, N.; Agrawal, H.; Parakdar, A. R.; Mahadik, K. R.; Talanta
2004, 62, 843.
6. Marchei, E.; Valvo, L.; Paciici, R.; Pellegrini, M.; Tossini, G.; Zucaro, P.; J. Pharmaceut. Biomed. Anal.2002, 29, 1081. 7. Daily, E.; Rafi, F.; Jolliet, P.; J. Chromatogr., A2004, 813, 353. 8. Anbazhagan, S.; Indumathy, N.; Shanmugapandiyan, P.; Sridhar,
S. K.; J. Pharmaceut. Biomed. Anal.2005, 39, 801.
9. Sarkar, M.; Khandavilli, S.; Panchagnula, R.; J. Chromatogr., B: Anal. Technol. Biomed. Life Sci. 2006, 830, 349.
10. Kapoor, N.; Khandavilli, S.; Panchagnula, R.; Anal. Chim. Acta
2006, 570, 41.
11. Rebiere, H.; Mazel, B.; Civade, C.; Bonnet, P.-A.; J. Chromatogr., B: Anal. Technol. Biomed. Life Sci. 2007, 850, 376.
12. D’Avolio, A.; Siccardi, M.; Sciandra, M.; Lorena, B.; Bonora, S.; Trentini, L.; Perri, G. D.; J. Chromatogr., B: Anal. Technol. Biomed. Life Sci. 2007, 859, 234.
13. Mistri, H. N.; Jangid, A. G.; Pudage, A.; Gomes, N.; Sanyal, M.; Shrivastav, P.; J. Chromatogr., B: Anal. Technol. Biomed. Life Sci. 2007, 853, 320.
Figure 4. Electropherograms after stress testing standard nevirapine: A) nevirapine (100.0 µg mL-1) standard solution (without stress); B) neutral
hydrolysis (in water at 80 ºC for 2 h); C) basic hydrolysis (in 1 mol L-1
NaOH at 80 ºC for 2 h); D) acidic hydrolysis (in 1 mol L-1 HCl at 80 ºC for
2 h) and E) oxidative conditions (in 3% H2O2 at 80 ºC for 2 h). Conditions: silica-fused capillary with 75 µm i.d. and a total length of 27 cm (19.4 cm to the detector); electrolyte: 10 mmol mL-1 sodium phosphate buffer at
14. Notari, S.; Manconea, C.; Alonzi, T.; Tripodi, M.; Narciso, P.; Ascenzi, P.; J. Chromatogr., B: Anal. Technol. Biomed. Life Sci.
2008, 683, 249.
15. Martin, J.; Deslandes, G.; Dailly, E.; Renaud, C.; Reliquet, V.; Rafi, F.; Jolliet, P.; J. Chromatogr., B: Anal. Technol. Biomed. Life Sci. 2009, 877, 3072.
16. D’Avolio, A.; Simiele, M.; Siccardi, M.; Baietto, L.; Sciandra, M.; Bonora, S.; Di Perri, G.; J. Pharmaceut. Biomed. Anal.
2010, 52, 774.
17. Else, L.; Watson, V.; Tjia, J.; Hughes, A.; Siccardi, M.; Khoo, S.; Back, D.; J. Chromatogr., B: Anal. Technol. Biomed. Life Sci. 2010, 878, 1455.
18. Altria, K. D.; Analysis of Pharmaceuticals by Capillary Electrophoresis. Chromatographia CE-Series; Vieweg Verlag: Germany, 1998.
19. Fan, B.; Stewart, J. T.; J. Pharmaceut. Biomed. Anal. 2002, 30, 955.
20. Gutleben, W.; Scherer, K.; Tuan, N. D.; Stoiber, H.; Dierich, M. P.; Zemann, A.; J. Chromatogr., A2002, 982, 153. 21. Alnouti, Y.; White, C. A.; Bartlett, M. G.; Biomed. Chromatogr.
2004, 18, 523.
22. Pereira, E. A.; Micke, G. A.; Tavares, M. F. M.; J. Chromatogr., A2005, 1091, 169.
23. Cahours, X.; Morin, P.; Dessans, H.; Agrofoglio, L. A.;
Electrophoresis2002, 23, 88.
24. Aurora-Prado, M. S.; Kedor-Hackmann, E. R. M.; Santoro, M. I. R. M.; Pinto, T. J. A.; Tavares, M. F. M.; J. Pharmaceut. Biomed. Anal. 2004, 34, 441.
25. Sekar, R.; Azhaguvel, S.; Chromatographia2008, 67, 389. 26. ICH (2005); International Conference on Harmonization of
Technical Requirements for Registration of Pharmaceuticals for Human Use, Topic Q2 (R1): Validation of Analytical Procedures: Text and Methodology, Geneva, 2005.
27. Garield, F. M.; Quality Assurance Principles for Analytical Laboratories, 2nd ed.; AOAC International: Arlington, 1991.
28. http://www.fda.gov/cder/guidance/cmc3.pdf accessed in June 2010.
29. Miller, J. C.; Miller, J. N.; Estadística para Química Analítica, 2nd ed., Addison-Wesley Iberoamericana: Estados Unidos, 1993.
30. Altria, K. D.; Methods in Molecular Biology Series,Vol. 52: Capillary Electrophoresis Guidebook-Principles, Operation, and Applications; Humana Press: Totowa, 1996.
31. McEvoy, E.; Donegan, S.; Power, J.; Altria, K. D.; J. Pharm. Biomed. Anal.2007, 44, 137.
32. Bolton, S.; Pharmaceutical Statistics. Practical and Clinical Applications,2nd ed.; Marcel Dekker Inc: New York, 1990.
Submitted: September 6, 2010 Published online: August 2, 2011